DWESD
1, 173–212, 2008The Dutch secret
P. W. M. H. Smeets et al.
Title Page
Abstract Introduction
Conclusions References
Tables Figures
◭ ◮
◭ ◮
Back Close
Full Screen / Esc
Printer-friendly Version
Interactive Discussion Drink. Water Eng. Sci. Discuss., 1, 173–212, 2008
www.drink-water-eng-sci-discuss.net/1/173/2008/ © Author(s) 2008. This work is distributed under the Creative Commons Attribution 3.0 License.
Drinking Water Engineering and Science Discussions
Drinking Water Engineering and Science Discussionsis the access reviewed discussion forum ofDrinking Water Engineering and Science
The Dutch secret: safe drinking water
without chlorine in the Netherlands
P. W. M. H. Smeets1,2, G. J. Medema1, and J. C. van Dijk2
1
Kiwa Water Research, Groningenhaven 7, 3433 PE Nieuwegein, The Netherlands 2
Technical University Delft, PO. Box 5048, 2600 GA Delft, The Netherlands
Received: 26 August 2008 – Accepted: 22 September 2008 – Published: 27 October 2008 Correspondence to: J. C. van Dijk (j.c.vandijk@tudelft.nl)
DWESD
1, 173–212, 2008The Dutch secret
P. W. M. H. Smeets et al.
Title Page
Abstract Introduction
Conclusions References
Tables Figures
◭ ◮
◭ ◮
Back Close
Full Screen / Esc
Printer-friendly Version
Interactive Discussion
Abstract
The Netherlands is one of the few countries where chlorine is not used at all, neither for primary disinfection nor to maintain a residual disinfectant in the distribution net-work. The Dutch approach that allows production and distribution of drinking water without the use of chlorine while not compromising microbial safety at the tap, can be 5
summarized as follows:
1. Use the best source available, in order of preference:
– microbiologically safe groundwater,
– surface water with soil passage such as artificial recharge or bank filtration,
– direct treatment of surface water in a multiple barrier treatment; 10
2. Use a preferred physical process treatment such as sedimentation, filtration and UV-disinfection. If absolutely necessary, also oxidation by means of ozone or peroxide can be used, but chlorine is avoided;
3. Prevent ingress of contamination during distribution;
4. Prevent microbial growth in the distribution system by production and distribution 15
of biologically stable (biostable) water and the use of biostable materials;
5. Monitor for timely detection of any failure of the system to prevent significant health consequences.
New developments in safe drinking water in the Netherlands include the adaptation of the Dutch drinking water decree, implementation of quantitative microbial risk as-20
DWESD
1, 173–212, 2008The Dutch secret
P. W. M. H. Smeets et al.
Title Page
Abstract Introduction
Conclusions References
Tables Figures
◭ ◮
◭ ◮
Back Close
Full Screen / Esc
Printer-friendly Version
Interactive Discussion
1 Introduction
The Netherlands is one of the few countries where chlorine is not used at all, neither for primary disinfection nor to maintain a residual disinfectant in the distribution network. Although it is generally believed that a chemical disinfection increases drinking water safety, the Dutch feel that it provides more problems than benefits. Therefore, the Dutch 5
have gradually adopted a total system approach that allows production and distribution of drinking water without the use of chlorine while not compromising microbial safety at the tap. The Dutch approach to safe drinking water was described previously by van der Kooij et al. (1995, 1999, 2003a). This approach can be summarized as follows:
1. Use the best source available, in order of preference: 10
– microbiologically safe groundwater,
– surface water with soil passage such as artificial recharge or bank filtration,
– direct treatment of surface water in a multiple barrier treatment;
2. Use a preferred physical process treatment such as sedimentation, filtration and UV-disinfection. If it cannot be avoided, also oxidation by means of ozone or 15
peroxide can be used but chlorine is not used;
3. Prevent ingress of contamination during distribution;
4. Prevent microbial growth in the distribution system by production and distribution of biologically stable (biostable) water and the use of biostable materials;
5. Monitor for timely detection of any failure of the system to prevent significant 20
health consequences.
DWESD
1, 173–212, 2008The Dutch secret
P. W. M. H. Smeets et al.
Title Page
Abstract Introduction
Conclusions References
Tables Figures
◭ ◮
◭ ◮
Back Close
Full Screen / Esc
Printer-friendly Version
Interactive Discussion water treatment efficacy, safe distribution, biostability of drinking water during
distribu-tion andLegionella. This paper summarizes the previous publications by van der Kooij et al. and provides an update of how the Dutch water companies warrant the safety of the drinking water without chlorine.
2 Legal requirements
5
Member states of the European Union have to implement the European drinking water directive (European Commission, 1998) in their national drinking water legislation. The Dutch drinking water decree (Staatsblad, 2001) generally applies stricter requirements for drinking water quality. Although the European directive allows exceptions for small supplies (less than 10 m3water per day or 50 persons), the Dutch regulations do not 10
include this. It was stated that drinking water should fulfill the same requirements regardless of system size. Moreover, the exception would only apply to a low number of systems. Monitoring requirements are related to the size of the system and will be discussed below. Dutch legislation includes no requirements for primary or secondary disinfection. A direct health-based target was included in the revision of the decree in 15
2001, and microbial requirements now include:
1. A QMRA for sites at risk (surface water) must show that the estimated risk of in-fection is below 1 inin-fection per 10 000 persons per year for enteric viruses, Cryp-tosporidiumandGiardiaand any other relevant pathogen.
2. E. coliand enterococci 0 CFU/100 ml 20
3. Aeromonas<1000 CFU/100 ml (operational parameter)
4. Colony count at 22◦C<100 CFU/ml (operational parameter)
DWESD
1, 173–212, 2008The Dutch secret
P. W. M. H. Smeets et al.
Title Page
Abstract Introduction
Conclusions References
Tables Figures
◭ ◮
◭ ◮
Back Close
Full Screen / Esc
Printer-friendly Version
Interactive Discussion Implementation of the statutory QMRA has put the focus on microbial drinking water
safety again. It has led to the intensified monitoring of full-scale drinking water systems and to research into treatment efficacy and distribution safety. The World Health Or-ganization (WHO) promotes a water safety plan (WSP) as a way to manage the safety of drinking water (WHO, 2004). Many water companies have implemented or are im-5
plementing a WSP for their systems. The WSP framework, shown in Fig. 1, provides a systematic approach to safe drinking water. This framework is used here to describe the Dutch approach to safe drinking water on a national level.
3 System assessment
3.1 Description of the Dutch water supply 10
In the Netherlands the highest quality water source is selected for drinking water pro-duction. Since the start of drinking water supply in the Netherlands, the preferred source has therefore always been microbiologically safe groundwater (in the Nether-lands this source can be found in confined sandy aquifers in most parts of the country, except the western provinces where the groundwater is brackish; see Fig. 2). The 15
water is distributed through a pressurized distribution system that prevents the ingress of water. Furthermore, the groundwater is usually biologically stable and, therefore, chlorination of the water to prevent bacterial growth is not needed. As a result, chlorine has never been used in the northern, eastern and southern parts of the country.
In the western part (city of Amsterdam, The Hague and surrounding urban area) 20
fresh water was originally abstracted from the dunes. After World War II the natural replenishment became insufficient due to increasing urbanization and drinking water use. Now, surface water from the rivers Meuse and Rhine is pretreated, transported to the dunes and infiltrated. The infiltration of pretreated surface water enables more than a 10-fold capacity increase in the same abstraction area compared to natural ground-25
DWESD
1, 173–212, 2008The Dutch secret
P. W. M. H. Smeets et al.
Title Page
Abstract Introduction
Conclusions References
Tables Figures
◭ ◮
◭ ◮
Back Close
Full Screen / Esc
Printer-friendly Version
Interactive Discussion are polluted by untreated and treated wastewater discharges, industrial activities and
agricultural land use upstream. Infiltration provides a natural filter for pathogenic par-asites, bacteria and viruses, a constant water quality and temperature, and a large storage reservoir to overcome pollution waves in the river. Infiltrated surface water is treated in a multiple barrier system to provide high quality drinking water. To a smaller 5
extent, artificial groundwater along rivers (river bank filtration) is used to provide a soil passage of surface water.
In some locations, including the Rotterdam and Amsterdam areas, direct treatment of surface water was also needed to satisfy the water demand. To improve source water quality, off-stream reservoirs were constructed. On the one hand, this created 10
a storage capacity which allowed the selective intake of water during periods of poor river water quality. On the other hand, the water quality significantly improved during storage due to natural processes. Until 1973 the stored surface water was treated directly by coagulation, sedimentation, filtration and disinfection by chlorine. This water was distributed with a chlorine residual, which sometimes led to customer complaints 15
about taste and odor. When the chemist from the Rotterdam water supply, Joop Rook, discovered that chlorine disinfection was responsible for the production of disinfectant by-products such as trihalomethanes (THM) (Rook, 1976), it led to a revolution in the philosophy regarding drinking water treatment in the Netherlands.
After stormy debates it was decided to abate the use of chlorine whenever possi-20
ble. Improved pretreatment by soil passage, optimized coagulation-sedimentation and rapid and slow sand filtration, and optimization of the chlorination process initially re-duced the use of chlorine. Further improvements included oxidation by ozonation in combination with granular activated carbon filtration (GAC). This replaced chlorination as the main disinfectant where applied and also improved the taste and odor of the 25
DWESD
1, 173–212, 2008The Dutch secret
P. W. M. H. Smeets et al.
Title Page
Abstract Introduction
Conclusions References
Tables Figures
◭ ◮
◭ ◮
Back Close
Full Screen / Esc
Printer-friendly Version
Interactive Discussion regrowth. At several locations the surface water treatment was augmented with UV. In
2005 the last chlorine disinfection process was replaced by a new generation UV sys-tem that was validated for its microbial inactivation efficacy. This improved taste and odor, reduced DBPs and did not result in regrowth problems. Moreover, UV inactivates a wider spectrum of pathogens than chemical disinfection, and microbial safety is eas-5
ily warranted by process monitoring and control. Innovative treatment processes also form an important barrier against microorganisms. Membrane filtration such as ultra filtration (UF) and reverse osmosis (RO) can remove all microbes from the water when the integrity of the membrane (and all connections) is guaranteed (Kamp et al., 2000). The most recently applied process of advanced oxidation with H2O2-UV irradiation is 10
effective for micro-pollutants as well as for microbes (Kruithof et al., 2007).
The groundwater supplies continued to distribute unchlorinated water. To further improve the water quality of surface water treatment plants (prevention of disinfec-tion by-products and improved taste and odor), the focus of drinking water treatment shifted to producing biostable water. The philosophy was and still is to prevent growth 15
in the distribution network by starvation rather than by the curative approach of (ap-parently) suppressing regrowth with a disinfectant residual. Thus, there was no more need for a disinfectant residual during distribution to prevent regrowth. The level of post-disinfection at surface water treatment plants was lowered to such an extent that, in 2008, no chlorine is being applied at all, and the few locations where chemical dis-20
infection is applied (chlorine dioxide) no residual disinfectant can be measured in the distributed water.
3.2 Hazard analysis
3.2.1 Hazards
Surface water supplies are facing numerous hazards, both microbial and chemical. The 25
DWESD
1, 173–212, 2008The Dutch secret
P. W. M. H. Smeets et al.
Title Page
Abstract Introduction
Conclusions References
Tables Figures
◭ ◮
◭ ◮
Back Close
Full Screen / Esc
Printer-friendly Version
Interactive Discussion by all sorts of human, animal and industrial wastes. The water suppliers intensively
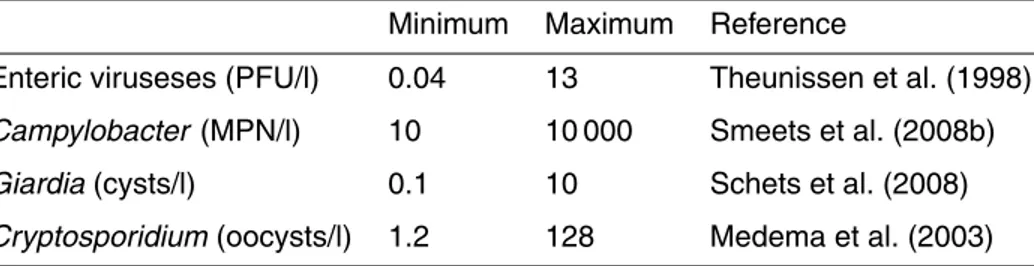
monitor the river water at several stations and at the intake points for drinking water. Microbial hazards such as pathogenic protozoa (Cryptosoridium andGiardia), bacteria (Campylobacter and E. coli O157) and viruses (enteroviruses, Norovirus, Rotavirus, Hepatitis A and E viruses and adenovirus) are regularly detected. Table 1 provides an 5
overview of the numbers of pathogens detected in river water in the Netherlands. Most of these organisms lead to mild symptoms such as gastroenteritis, but some can lead to severe illness or even death (see for details WHO guidelines 3rd edition, WHO 2004). Health consequences can also be more severe for specific groups (chil-dren, elderly, pregnant women, immuno-compromised persons).
10
Microorganisms with opportunistic pathogenic properties and the ability to multiply in drinking water networks, such asLegionella, Aeromonas, Pseudomonas and my-cobacteria, can constitute a risk during treatment or distribution. Since an outbreak of legionellosis following a flower show in 1999 (den Boer et al., 1999) , the prevention of
Legionellagrowth has received much attention (van der Kooij et al., 2005). 15
Chemical hazards in the source water are not discussed in this paper. However, dis-infection by-products (DBP) will be discussed since they can be formed during drinking water production and distribution. The DBPs of concern are trihalomethanes formed during chlorination and bromate formed during ozonation. These compounds can have mutagenetic or carcinogenetic effects (Rook, 1976; Orlandini et al., 1997).
20
Taste, odor, color and turbidity are also considered hazards. Although these parame-ters have no health effect, they need to be acceptable to the consumer. These hazards can be present in the source water but can also be created by treatment or distribution, e.g., temporary chlorination after maintenance leads to customer complaints.
3.2.2 Hazardous events 25
waste-DWESD
1, 173–212, 2008The Dutch secret
P. W. M. H. Smeets et al.
Title Page
Abstract Introduction
Conclusions References
Tables Figures
◭ ◮
◭ ◮
Back Close
Full Screen / Esc
Printer-friendly Version
Interactive Discussion water treatment plants. Drought can also form a hazard since river water is more
concentrated and a higher percentage of it consists of wastewater. Since the Meuse and Rhine rivers are continuously polluted with wastewater, the concentrations of pathogens constantly vary. One would only refer to events in case of extreme levels of contamination. A hazard that is related to the groundwater supply is contamination at 5
or close to the well-head. Although this has led to the detection of fecal indicators in the water, an outbreak of disease has not occurred.
Hazardous events during treatment can include equipment failure, operational er-ror or improper protection of the water, e.g., rainwater leakage into the process water. These events have not been systematically analyzed at a national level. However, 10
many potential hazards have been identified in the process of developing water safety plans. Important potential hazards were ventilation openings at different stages of treat-ment, temporary adaptations to the system for startup or maintenance that were not removed (e.g., connection between raw- and treated water) and unhygienic cleaning practices. However, the major hazard appears to be human error. Therefore, adequate 15
training of personnel is the most important measure for risk reduction during treatment. All three outbreaks that occurred in the Netherlands since 1945 were caused by cross-connections during distribution: one to a sewer (Gemeentewaterleidingen Ams-terdam, 1962), a second to wastewater from a navy vessel through a drinking water supply connection (Huisman and Nobel, 1981), and the third to a household water sup-20
ply system in 2001 (Raad voor de Transportveiligheid, 2003). Other hazardous events have led to the contamination of drinking water with E. coli but did not lead to the outbreak of disease. These events were:
– leakage of a drinking water reservoir (esp. in combination with heavy rainfall);
– mains breaks; 25
– maintenance and repair;
DWESD
1, 173–212, 2008The Dutch secret
P. W. M. H. Smeets et al.
Title Page
Abstract Introduction
Conclusions References
Tables Figures
◭ ◮
◭ ◮
Back Close
Full Screen / Esc
Printer-friendly Version
Interactive Discussion Outbreaks and hazardous events have been analyzed in international studies
(Hrudey and Hrudey, 2004; Westrell et al., 2003; Risebro et al., 2007; Nilsson et al., 2007). These have shown that hazards in source water, treatment and distribution can all lead to outbreaks and that outbreaks are often a consequence of simultaneous events in these parts of the drinking water system. The Techneau Hazard Database 5
(Beuken, 2007) provides an overview of hazardous events that were identified by an international research team. It can be used as a checklist for risk assessment and management.
3.3 Identify control measures
3.3.1 Protection of groundwater 10
Groundwater is the preferred source for the production of drinking water in the Nether-lands. Groundwater in the Netherlands is abstracted within restricted areas, where land use is regulated. Land in the immediate neighborhood of the abstraction wells is owned by the water companies. Water from outside the restricted areas will take at least 25–50 years to arrive at the abstraction wells. These large areas (in total some 15
1500 km2, 4.4% of the land area in the Netherlands) allow adequate protection and a very long response time in case of a groundwater contamination. Groundwater protec-tion zones prevent contaminaprotec-tion around the drinking water wells. In general a 60-day zone with the highest level of protection prevents fecal contamination. Confined sandy aquifers are covered by impermeable clay layers which protect the groundwater from 20
surface contamination. The 60-day zone allows sufficient time and distance for highly effective filtration and the die-offof microorganisms (Schijven and Hassanizadeh, 2002; van der Wielen et al., 2008). A few shallow anoxic aquifers require more than 60 days residence time. This high quality water requires no additional disinfection and is only treated for physical parameters such as oxygen, iron, ammonium and manganese by 25
per-DWESD
1, 173–212, 2008The Dutch secret
P. W. M. H. Smeets et al.
Title Page
Abstract Introduction
Conclusions References
Tables Figures
◭ ◮
◭ ◮
Back Close
Full Screen / Esc
Printer-friendly Version
Interactive Discussion sonnel and by using strict hygienic protocols (Leunk and van Lieverloo, 2007).
3.3.2 Selective intake and storage of surface water
Surface water systems have several built-in control measures. In most cases the intake point can be changed to a different source during contamination events or water short-age. The available storage allows stoppage of the intake for days to months. Storage 5
in reservoirs reduces the microbial hazards due to natural processes like die-off, sedi-mentation, UV inactivation and predation. Figure 3 shows the reduction ofClostridium Perfringensby retention in open reservoirs (van der Veer, 2008). Pretreatment before storage and infiltration in the dunes also reduces microbial and chemical hazards.
3.3.3 Drinking water treatment to control microbial hazards 10
Since 2001 the microbial safety of drinking water has been regulated in the Netherlands by a health-based target of 10−4 risk of infection per person per year. A quantitative microbial risk assessment (QMRA) is required to verify compliance of these targets for surface water treatment plants and other plants at risk. Drinking water treatment needs to be tailored to the hazards in the source water to provide safe water leaving the plant. 15
This requires the assessment of source water quality and treatment efficacy. Instead of using log-credits (as applied in the USEPA LT2ESWTR 2006), the companies need to verify by monitoring (where possible) that their systems are indeed effective under both nominal and event conditions. By 2008 QMRA’s have been performed on the surface water systems in the Netherlands, providing insight into the actual efficacy of 20
full-scale drinking water treatment. Table 2 provides an overview of the log reduction that is required to comply to the health-based target at Dutch surface water treatment plants.
Infiltration in the dunes or other means of soil passage are the major barrier against microbial hazards, since it contributes over 8 logs of pathogen reduction (Schijven, 25
disin-DWESD
1, 173–212, 2008The Dutch secret
P. W. M. H. Smeets et al.
Title Page
Abstract Introduction
Conclusions References
Tables Figures
◭ ◮
◭ ◮
Back Close
Full Screen / Esc
Printer-friendly Version
Interactive Discussion fection and slow sand filtration each provide some additional reduction of pathogens.
Direct treatment of surface water relies on a series of barriers, including traditional pro-cesses like filtration, disinfection and slow sand filtration (Hijnen et al., 2005; Smeets, 2008a). These have been complemented with new techniques like UV disinfection (Hijnen et al., 2006), advanced oxidation with UV-H2O2 (Kruithof et al., 2007) and 5
membrane filtration including ultrafiltration (UF) and reverse osmosis (RO) (Kamp et al., 2000).
3.3.4 Preventing contamination during distribution
In the Netherlands the focus is on maintaining a high quality distribution system with sufficient pressure to prevent ingress during normal operation. Additionally, strict hy-10
gienic protocols are set for building, maintenance and repair of distribution systems (van Lieverloo et al., 2002). The 100 000 km length of mains (>50 mm) consists of non-plastic polyvinyl chloride (PVC, 40%), asbestos (36%), cast iron (14%), polyethylene (2.5%) and others (7.5%). The leakage rate is low, generally<3%. A study showed that leakage is lower when pipelines are placed in sandy or clay soils, when water pres-15
sure is low and the proportion of PVC pipelines is high (VEWIN, 2005; DVGW, 2008). Figure 4 shows the leakage rates in several European countries.
Pressure fluctuations and surges that could result in negative pressure in the dis-tribution network are minimized by variable pumps, pressure dampening devices and automated distribution control to prevent large variations in flow (e.g., when filling reser-20
voirs). Negative pressures (syphonage) and high pressures in hilly areas are prevented by defining pressure zones with limited pressure ranges.
The prevention of cross-connections and backflow is extremely important. Connec-tions to installaConnec-tions that could present a risk, for example through the connection of pumps or from high levels of pathogens at the location, are only allowed through a 25
DWESD
1, 173–212, 2008The Dutch secret
P. W. M. H. Smeets et al.
Title Page
Abstract Introduction
Conclusions References
Tables Figures
◭ ◮
◭ ◮
Back Close
Full Screen / Esc
Printer-friendly Version
Interactive Discussion 3.3.5 Preventing microbial growth in the distribution system
Measures to prevent microbial growth in the distribution system were described by van der Kooij (2003b). The following approaches are used to control or limit microbial activity in the distribution system in the absence of a disinfectant residual:
– Production of biologically stable drinking water; 5
– A distribution system with non-reactive, biologically stable materials;
– An optimized distribution system to prevent stagnation and sediment accumula-tion.
Aerobic groundwater contains little organic compounds and is generally biostable. Anaerobic groundwater is generally not biostable due to the presence of organic com-10
pounds, methane and ammonia. Treatment by aeration and sand filtration is gener-ally sufficient to achieve biostable drinking water with AOC levels below 10µg carbon/l. Surface water requires extensive treatment to produce biostable water. Biological treat-ment processes, such as storage in open reservoirs, soil passage, granular activated carbon filtration and (slow) sand filtration, in combination with physical and chemical 15
treatment processes, such as coagulation-sedimentation and oxidation, form a barrier against biodegradable compounds. When ozonation is applied, AOC is formed from larger organic compounds. Two-stage filtration is then needed to achieve biostable wa-ter. AOC is degraded in the first stage and the second stage removes the biomass and fines from the first stage. Biological filtration processes can reduce AOC and BDOC 20
levels by 80%. Chlorine should be avoided in the influent of biological filters. In the Netherlands chlorine is not used in treatment and chlorine dioxide is only applied as a post-disinfection, and therefore does not affect any treatment processes. The contact times for ozonation are such that no residual ozone reaches the consecutive filtration steps. The effect of membrane filtration on biological stability depends on the type of 25
DWESD
1, 173–212, 2008The Dutch secret
P. W. M. H. Smeets et al.
Title Page
Abstract Introduction
Conclusions References
Tables Figures
◭ ◮
◭ ◮
Back Close
Full Screen / Esc
Printer-friendly Version
Interactive Discussion The biostability of materials is tested with the biofilm formation potential (BFP) test
(van der Kooij and Veenendaal, 1993). All materials in the Netherlands have to be tested by Kiwa before they can be used in drinking water. The majority of the distri-bution system consists of biostable asbestos cement or PVC, which is generally also used when old distribution pipes are replaced (van der Kooij et al., 1999).
5
Optimized distribution systems are designed so that stagnant zones are prevented and the build-up of sediment is prevented. Since distribution systems have a long lifetime, changes to the design can only be implemented slowly. Still, measures in operation can reduce the build-up of sediment by (Vreeburg, 2007):
– Optimizing treatment to minimize particles in drinking water entering the network; 10
– Applying sufficiently high flow velocities during distribution, resulting in a “self-cleaning network”;
– Regular flushing under specified conditions.
4 Operational monitoring
4.1 Source water monitoring 15
The Dutch drinking water decree requires monthly monitoring of coliforms andE. coliin abstracted groundwater andE. coli, enterococci andClostridium perfringensfor surface water. River water is monitored on-line and with grab samples at several stations and at intake points for drinking water. The data are made available to water companies via the internet. A range of biomonitors is used at the intake points to detect a broad 20
DWESD
1, 173–212, 2008The Dutch secret
P. W. M. H. Smeets et al.
Title Page
Abstract Introduction
Conclusions References
Tables Figures
◭ ◮
◭ ◮
Back Close
Full Screen / Esc
Printer-friendly Version
Interactive Discussion allow for active management of source water intake. Apart from the legally required
parameters, monitoring programs to quantify pathogen concentrations in surface water are also regularly performed. The microbial monitoring data is used in a statistical analysis for the QMRA to estimate nominal and peak concentrations. Thus, risks from these hazards can be adequately quantified (Smeets, 2008a).
5
For groundwater abstractions that may be vulnerable for contamination at the surface or may be under the influence of surface water, the inspectorate guidance document (de Roda Husman and Medema, 2004) suggests event monitoring. The abstracted water should be tested for the presence ofE. coli and F-specific coliphage in 10-liter samples during event conditions, such as heavy rainfall or flooding. The sampling 10
moment should be corrected for the expected residence time for a contamination to reach the well to maximize the probability of detection.
4.2 Process monitoring
All surface water systems are equipped with automated control systems (SCADA). Relevant process parameters such as pH and turbidity are measured on-line and are 15
used for automated control. Important barriers against microbes are strictly monitored. Sufficient UV disinfection is guaranteed by monitoring the flow, UV transmission of the water and UV intensity of the UV lamps. Ozonation is controlled by measuring water flow, flow of and ozone concentration in the ozone dosing gas and the ozone residual in the water. Thus, sufficient Ct is controlled under all conditions. UF and RO are 20
monitored by particle removal and sulfate removal, respectively. In addition regular off -line integrity tests are performed. The intensity of monitoring and control is related to the required efficacy of the process. For example, highly effective barriers that achieve 6-log reduction require on-line monitoring to verify that the process is effective every 10 s (Smeets, 2008a). A new development is the design of integrated process control to 25
optimize not only individual processes but also the total combined effect of all treatment processes (van der Helm, 2007).
DWESD
1, 173–212, 2008The Dutch secret
P. W. M. H. Smeets et al.
Title Page
Abstract Introduction
Conclusions References
Tables Figures
◭ ◮
◭ ◮
Back Close
Full Screen / Esc
Printer-friendly Version
Interactive Discussion to verify treatment efficacy (Hijnen et al., 2005). The time required for microbial analysis
does not allow for direct control based on these measurements. A statistical analysis of these data provides insight into the efficacy and variability of the treatment processes (Smeets, 2008a). A software tool was developed by the Dutch water companies to automate this analysis for risk assessment (QMRA tool). So far, the QMRA studies 5
showed that treatment processes in practice may be far less effective than would be expected based on experimental tests. Figure 5 shows the results of microbial anal-ysis during treatment at a specific treatment site (Smeets et al., 2008b). Monitoring results were plotted in a complementary cumulative frequency distribution (CCDF), as the proportion of the samples that exceeded a concentration. For example, 10% of 10
the raw water samples exceeded a concentration of 900 MPN/l. Although the concen-tration varies over two log-units at each stage, Fig. 5 clearly shows that the treatment processes reduce the concentrations. The data analysis allows an estimation of the fre-quency and magnitude of high concentration events by extrapolating the distributions. It also provides an estimate of the distribution of concentrations below the detection 15
limit after ozonation (shown by the part of the ozonation graph without markers).
4.3 Microbial drinking water monitoring
Dutch legislation requires sampling the produced drinking water forE. coli,Clostridium perfringens, coliforms and colony count on a weekly basis for groundwater, and daily for surface water. In practice, produced drinking water is tested for the absence of 20
E. coli in a 100 to 1000 ml sample on a daily basis and some water companies take large volume samples of up to 1000 l on a monthly basis.
4.4 Microbial monitoring in distribution
The statutory monitoring of distribution systems is related to the capacity of the system. Per year 26 samples are required per 2000 m3/day. So, for a system of 10 000 m3/day, 25
DWESD
1, 173–212, 2008The Dutch secret
P. W. M. H. Smeets et al.
Title Page
Abstract Introduction
Conclusions References
Tables Figures
◭ ◮
◭ ◮
Back Close
Full Screen / Esc
Printer-friendly Version
Interactive Discussion from reservoirs and taps in homes or public buildings.
5 Management and communication
5.1 Corrective action and incidence response
Corrective action is generally very specific per drinking water system. The water com-panies have prepared emergency responses by procedures and emergency plans. The 5
implementation of water safety plans is rapidly increasing in the Netherlands. Some general corrective actions are discussed here. Corrective actions for the source wa-ter include closing intake at moments of poor raw wawa-ter quality and, in some cases, discharging the contamination from the intake reservoir back into the river. Process control during treatment and corrective action are related to the types of processes. 10
General hazards such as the loss of power or flooding are covered by emergency power supplies and by partitioning the system in water-tight compartments.
Events in distribution pose the biggest threat to safe drinking water at the tap. In case of contamination, the affected area is contained by selectively closing valves while maintaining pressure in the system. The system is flushed where possible and chlo-15
rination can be applied to inactivate pathogens that could remain in the distribution system after flushing. Customers are informed, e.g., by door-to-door boiling notices, the internet and radio. Regional crisis centers are used when the event is of significant size. When water safety is verified by microbial sampling, the boiling notice is lifted (van Lieverloo et al., 2002). To prevent pressure losses, a water supply security plan 20
was developed allowing other systems to partly take over water supply in an affected area.
5.2 Record keeping
DWESD
1, 173–212, 2008The Dutch secret
P. W. M. H. Smeets et al.
Title Page
Abstract Introduction
Conclusions References
Tables Figures
◭ ◮
◭ ◮
Back Close
Full Screen / Esc
Printer-friendly Version
Interactive Discussion the Netherlands Ministry of Housing, Spatial planning and the Environment (VROM)
that reports yearly on the Dutch drinking water quality. Incidents are also reported to VROM. Water companies store automated monitoring data which can then be used for analysis, e.g., in QMRA. Most water companies have automated systems to record and store operational information (diaries) and failure reports. Periodically, these reports 5
can be evaluated.
5.3 Verification of safe drinking water at the tap
5.3.1 Verification of microbial safety: health surveillance
Dutch outbreaks were summarized by van Lieverloo et al. (2007): “In the Netherlands, only three outbreaks have been reported for public drinking water systems since the 10
end of World War II. The first of these occurred in 1962, when five cases of typhoid fever were reported in Amsterdam, probably as a result of a contamination of a drinking-water main with sewage (Gemeentedrinking-waterleidingen Amsterdam, 1962). The second reported outbreak occurred in 1981 in Rotterdam, when sewage and wastewater from a foreign navy vessel were pumped into the distribution system via a drinking wa-15
ter supply valve for marine vessels. This event led to 609 reported cases, mainly of gastroenteritis. Pathogens isolated from stool samples includedGiardia(8%),
Campy-lobacter (5%), Entamoeba histolytica (2.3%), andSalmonella (1.2%) (Huisman and
Nobel, 1981). In 2001, an outbreak of waterborne gastro-enteritis occurred in the Netherlands as a result of an accidental cross-connection between the drinking water 20
DWESD
1, 173–212, 2008The Dutch secret
P. W. M. H. Smeets et al.
Title Page
Abstract Introduction
Conclusions References
Tables Figures
◭ ◮
◭ ◮
Back Close
Full Screen / Esc
Printer-friendly Version
Interactive Discussion 5.3.2 Verification of microbial safety: QMRA of surface water systems
Since 2001 the Dutch water companies have assessed their drinking water systems through QMRA. Figure 6 shows the summarized results of such a QMRA study for one drinking water system. Numbers were taken from a QMRA study of a surface water treatment plant. The risk was assessed for four index pathogens.
Cryptosporid-5
ium,Giardiaand Enteric viruses are explicitly mentioned in the drinking water decree.
Campylobacter was not named explicitly, however it is considered a relevant index pathogen to cover risks from bacteria. The QMRA is summarized by pairs of bars in Fig. 6. The first bar shows the required log reduction by drinking water treatment based on the measured concentration of pathogens in source water and the health-based tar-10
get. The second bar shows how the different treatment barriers contribute to achieving the required log reduction. The graph illustrates how the treatment barriers can have a different significance for the index pathogens. UV disinfection is essential for the reduc-tion ofCampylobacter, while it is not essential, but provides additional safety, against
Cryptosporidium. 15
Treatment efficacies in Figs. 6 and 7 were based on microbial monitoring and surro-gate monitoring at full-scale for the first treatment step (Hijnen et al., 2005). Pilot-scale experiments and process monitoring supported the estimated efficacy of the final treat-ment steps. For most systems, compliance with the 10−4 per person per year risk of infection could be proven for all index pathogens. In some cases the available infor-20
mation was insufficient to verify this level, and more research was conducted. The quantitative approach did provide several eye-openers for the water companies such as:
– The importance of contamination through “indirect flows” such as leakage near wells of an artificial infiltration site;
25
DWESD
1, 173–212, 2008The Dutch secret
P. W. M. H. Smeets et al.
Title Page
Abstract Introduction
Conclusions References
Tables Figures
◭ ◮
◭ ◮
Back Close
Full Screen / Esc
Printer-friendly Version
Interactive Discussion
– Suboptimal design of a process can have a strong impact on treatment efficacy;
– The importance of strict sampling procedures to prevent contamination of sam-ples or the switching of samsam-ples since these errors can have a significant impact on the risk assessment outcome.
Given the outcomes of the QMRA studies, it could be stated that drinking water en-5
tering the distribution system is indeed safe and does not contain microbial pathogens at a level that would be of any health concern.
5.3.3 Verification of microbial safety: E. coli monitoring of produced drinking water
Van Lieverloo et al. (2007a) found that 0.01 to 0.09% of the yearly samples of finished drinking water from groundwater and surface water systems (over 10 000 samples per 10
year) in the Netherlands in 2001, 2002 and 2003 were positive forE. coli or thermo-tolerant coliforms. A more detailed study of this data showed that only one surface water treatment system had foundE. coli in treated water in 0.08% of 5840 samples between 1996 and 2003. For all Dutch surface water treatment plants, only 5 out of 17 277 finished drinking water samples were positive (0.03%).
15
5.3.4 Verification of microbial safety: E. coli monitoring in distribution
Van Lieverloo et al. (2007a) found that 0.1% of the yearly samples of distributed drink-ing water (over 33 000 samples per year) in the Netherlands in 2001, 2002 and 2003 were positive forE. coli or thermotolerant coliforms. They also showed that the statu-tory monitoring program was not very sensitive for detecting sewage ingress (2007b). 20
DWESD
1, 173–212, 2008The Dutch secret
P. W. M. H. Smeets et al.
Title Page
Abstract Introduction
Conclusions References
Tables Figures
◭ ◮
◭ ◮
Back Close
Full Screen / Esc
Printer-friendly Version
Interactive Discussion Van Lieverloo et al. (2006, 2007a) have applied QMRA to estimate the health risks
that detections of E. coli in distributed water might indicate. They compared three assumptions for the ratio between pathogen and thermotolerant coliform (TTC) con-centration related to the type of contamination that occurred. In sewage, the ratio of
Campylobacter, Cryptosporidium, Giardia and enteric viruses to TTC was estimated 5
on the order of 10−3 , 10−6 ,10−5 and 10−6,respectively. In surface water this was 10−1, 10−4,10−3and 10−5, and in soil and groundwater this was 10−2to 1 for viruses. Table 3 shows the theoretical estimated daily risk of infection resulting from these as-sumptions. The results suggest that the risk from bacterial pathogens is high when TTC are detected.
10
5.3.5 Verification of microbial safety: Legionella monitoring
Currently, Legionella is the most significant known source of infection through drink-ing water in the Netherlands. For risk sites, such as swimmdrink-ing pools, hospitals, and residences for the elderly, a risk assessment and management plan (similar to Water Safety Plan) has to be drawn up and they are regularly monitored for the presence 15
ofLegionella. PCR methods, and currently also a new culture method (Veenendaal
and van der Kooij, 2007), allow for a distinction between pathogenicLegionella pneu-mophila and non-pathogenicLegionellaspecies, which form the majority ofLegionella
found in drinking water installations (Wullings and van der Kooij, 2006). This allows for aLegionellarisk management approach that is directed at pathogenic types rather 20
than allLegionella.
5.3.6 Verification of consumer satisfaction and confidence
Consumer trust in the Netherlands’ drinking water was surveyed in 2008 (VEWIN, 2008). Over 95% of the consumers fully trust the drinking water quality and its safety. The esthetic quality of drinking water was compared to that of bottled (mineral or spring) 25
pre-DWESD
1, 173–212, 2008The Dutch secret
P. W. M. H. Smeets et al.
Title Page
Abstract Introduction
Conclusions References
Tables Figures
◭ ◮
◭ ◮
Back Close
Full Screen / Esc
Printer-friendly Version
Interactive Discussion ferred by many consumers (Consumentenbond, 1997). The incidental use of chlorine
for disinfection after construction, maintenance or repair, however, does lead to an increase in complaints about water quality.
6 Discussion
The Dutch approach of distributing drinking water without a disinfectant residual has 5
been disputed many times. The following arguments in favor of disinfection are dis-cussed here:
– Provides an additional barrier in case treatment is ineffective;
– Provides a barrier in case of ingress in the distribution system;
– Prevents regrowth in the distribution system; 10
– Prevents outbreaks of disease due to chlorine residual.
6.1 Additional barrier
A disinfectant residual during distribution could mitigate the risks from inadequate drinking water treatment. Long contact times could result in significant CT values and thus in disinfection. Consumers living closer to the production site, however, would 15
receive water that was less safe. Furthermore, the disinfection process is poorly mon-itored and controlled when it takes place during distribution. Therefore, it makes more sense to properly treat the water at the production site. ComparingE. coli monitoring results between countries with and without secondary disinfection does not indicate a significantly lower number of detections when disinfection is applied. Data from the UK 20
DWESD
1, 173–212, 2008The Dutch secret
P. W. M. H. Smeets et al.
Title Page
Abstract Introduction
Conclusions References
Tables Figures
◭ ◮
◭ ◮
Back Close
Full Screen / Esc
Printer-friendly Version
Interactive Discussion Netherlands approximately 0.01 to 0.09% of treated water samples were positive in
the absence of disinfectant.
6.2 Barrier in case of ingress
In theory, residual chlorine could mitigate the effect of the ingress of contaminated water in the distribution system. However, it is likely that such water also contains 5
a significant amount of organic compounds that would rapidly consume all residual chlorine. Microorganisms in the contaminated water could be shielded from chlorine by attachment to particulate matter. Moreover, several pathogens can withstand ex-posure to chlorine (Cryptosporidium) and would not be inactivated. E. coli would be inactivated before most pathogens, thus a contaminated situation could exist for a pro-10
longed period of time without being detected. Therefore, the additional safety provided is very limited. E. coli monitoring data from the distribution network do not show a significantly lower number of detections in chlorinated systems. Data from the UK in-dicated 0.03 to 0.04% of the (chlorinated) drinking water samples from the distribution network were positive forE. coli, and in France 0.4 to 1.0% of the samples contained 15
coliforms (no data on thermotolerant coliforms orE. coli) (van Lieverloo et al., 2007a). In the Netherlands 0.1% of the samples from distribution systems without disinfection were positive forE. coli or thermotolerant coliforms. This basic comparison indicates that the absence of chlorination does not lead directly to higher numbers of indicator bacteria.
20
6.3 Prevent regrowth
A comparative study of drinking water distribution in the United Kingdom and the Netherlands showed that a chlorine residual can be effective to control regrowth in the distribution system. However, this does lead to the formation of DBPs and taste and odor complaints. By controlling the biostability of the water, the Dutch approach 25
DWESD
1, 173–212, 2008The Dutch secret
P. W. M. H. Smeets et al.
Title Page
Abstract Introduction
Conclusions References
Tables Figures
◭ ◮
◭ ◮
Back Close
Full Screen / Esc
Printer-friendly Version
Interactive Discussion Kooij et al., 2003b).
6.4 Outbreaks despite chlorination
The most direct verification of drinking water quality is by health surveillance. Severe contamination of drinking water can lead to a high number of ill consumers. When the number of ill people is high enough to be picked up by health surveillance, the 5
event is referred to as an outbreak. Risebro et al. (2007) analyzed 61 outbreaks in the European Union to determine their cause. Many outbreaks had several causes, and for 27 outbreaks an event in distribution contributed to the outbreak. Backflow and cross-connections were the most frequent causes. Chlorine residual was not sufficient to prevent the outbreaks for these cases, nor for other significant causes (e.g., repairs, 10
leakage and low pressure). Other causes of outbreaks could be assigned to events in treatment and source water. Also in these cases, disinfection during distribution was an insufficient barrier. In several cases the water supplier and inspectorate failed to recognize the need for adequate treatment like filtration (23 cases) or disinfection (12 cases). A water safety plan or QMRA would most likely have identified these needs. 15
Similarly, contamination of source water was not recognized in many cases, leading to insufficient treatment. Most outbreaks occurred in systems that applied a chlorine residual during distribution. The extremely low number of outbreaks in the Netherlands indicates the safety of the Dutch approach.
7 Conclusions
20
In the Netherlands water is distributed without a disinfectant residual. This was achieved by taking the following approach:
1. Use the best sources available, in order of preference:
DWESD
1, 173–212, 2008The Dutch secret
P. W. M. H. Smeets et al.
Title Page
Abstract Introduction
Conclusions References
Tables Figures
◭ ◮
◭ ◮
Back Close
Full Screen / Esc
Printer-friendly Version
Interactive Discussion
– surface water with soil passage such as artificial recharge or bank filtration,
– direct treatment of surface water in a multiple barrier treatment;
2. Treat using physical processes such as sedimentation, filtration and UV-disinfection. If it cannot be avoided also oxidation by means of ozone or peroxide can be used, but chlorine is not used;
5
3. Prevent ingress of contamination during distribution;
4. Prevent microbial growth in the distribution system by production and distribution of biologically stable water and the use of biostable materials;
5. Monitor for timely detection of any failure of the system to prevent significant health consequences.
10
The success of this approach was achieved by the joint effort of the Dutch water companies to constantly improve the water supply systems. Their joint research pro-gram allows efficient research with a close relationship to drinking water practice. In combination with well- trained and qualified staff, the improvements can be rapidly implemented in practice. Also, specific circumstances in the Netherlands, such as 15
population density, geography and economy, were favorable for these developments. As a consequence, outbreaks of disease through drinking water are extremely rare. The results are that over 95% of Dutch consumers drink water from the tap daily and consumer trust and satisfaction are very high.
References
20
DWESD
1, 173–212, 2008The Dutch secret
P. W. M. H. Smeets et al.
Title Page
Abstract Introduction
Conclusions References
Tables Figures
◭ ◮
◭ ◮
Back Close
Full Screen / Esc
Printer-friendly Version
Interactive Discussion
den Boer, J. W., Yzerman, E., Schellekens, J., Bruin, J. P., van Leeuwen, W., Mooijman, K., Veenendaal, H., Bergmans, A. M. C., van der Zee, A. N., van Ketel, R. J., Tijsen, H., and Conyn-van Spaendonck, M. A. E.: Onderzoek naar de bron van een epidemie van legionel-lose na de Westfriese Flora in Bovenkarspel (Research into the Legionellosis outbreak at Bovenkarspel), 83 pp., www.RIVM.nl2000.
5
de Roda Husman, A. M., and Medema, G.: Inspectierichtlijn, Analyse microbiologische vei-ligheid drinkwater, VROM-inspectie, 34 pp., www.vrom.nl, 2004.
DVGW: http://www.dvgw.de/presse/pressemitteilungen/dvgw-pressemitteilung/meldung/4021/ liste/418/,DVGW,Bonn,Germany, 2008.
European Commisssion: Council Directive 98/83/EC of 3 November 1998 on the quality of
10
water intended for human consumption, European Commisssion, 1998.
Gemeentewaterleidingen Amsterdam: Year report 1962 of the City of Amsterdam (in Dutch: Jaarverslag 1962), Gemeentewaterleidingen Amsterdam, Amsterdam, The Netherlands, 1962.
Hambsch, B., Bockle, K., and van Lieverloo, J. H. M.: Incidence of faecal contaminations in
15
chlorinated and non-chlorinated distribution systems of neighbouring European countries, J. Water Health, 5, 119–130, 2007.
Hijnen, W. A., Beerendonk, E. F., and Medema, G. J.: Inactivation credit of UV radiation for viruses, bacteria and protozoan (oo)cysts in water: a review, Water Res., 40(1), 3–22, 2006. Hijnen, W. A. M., Beerendonk, E., and Medema, G. J.: Elimination of microorganisms by
drink-20
ing water treatment processes, second edition, Kiwa NV, Nieuwegein, The Netherlands, 101 pp., 2005.
Hrudey, S. E. and Hrudey, E. J.: Safe drinking water – Lessons learned from recent outbreaks in affluent nations, IWA Publishing, London, 514 pp., 2004.
Huisman, J. and Nobel, P. J.: Some epidemiological data on the effects of the faecal
contamina-25
tion of drinking-water in the Scheepvaartkwartier residential area in Rotterdam in March 1981 (in Dutch: Enkele epidemiologische gegevens over de gevolgen van de faecale drinkwater-verontreiniging in het Scheepvaartkwartier te Rotterdam in maart 1981, H2O 14 (26), 642– 646, 1981.
Kamp, P. C., Kruithof, J. C., and Folmer, H. C.: UF/RO treatment plant Heemskerk: from
chal-30
lenge to full scale application, Desalination 131(1–3), 27–35, 2000.
DWESD
1, 173–212, 2008The Dutch secret
P. W. M. H. Smeets et al.
Title Page
Abstract Introduction
Conclusions References
Tables Figures
◭ ◮
◭ ◮
Back Close
Full Screen / Esc
Printer-friendly Version
Interactive Discussion
Leunk, I. and Lieverloo, J. H. M. v.: Hygi ¨ene bij winmiddelen: hygi ¨enecode drinkwater, p. 32, KIWA Water Research, Nieuwegein, The Netherlands, 32 pp., 2007.
Medema, G. J. and Stuyfzand, P.: Removal of micro-organisms upon basin recharge, deep well injection and river bank filtration in the Netherlands, in: Management of AquiferRecharge for Sustainability Proceedings of the Fourth International Symposium on Artificial Recharge,
5
edited by: Dillon, P. J., Balkama Press, Adelaide, Australia, 125–131, 2002.
Medema, G. J., Hoogenboezem, W., van der Veer, A. J., Ketelaars, H. A., Hijnen, W. A., and Nobel, P. J.: Quantitative risk assessment of Cryptosporidium in surface water treatment, Water Sci. Technol., 47(3), 241–247, 2003.
Nilsson, P., Roser, D., Thorwaldsdotter, R., Petterson, S., Davies, C., Signor, R., Bergstedt, O.,
10
and Ashbolt, N.: SCADA data and the quantification of hazardous events for QMRA, J. Water Health, 5, 99–105, 2007.
Orlandini, E., Kruithof, J. C., vanderHoek, J. P., Siebel, M. A., and Schippers, J. C.: Impact of ozonation on disinfection and formation of biodegradable organic matter and bromate, J. Water Supply Res. T., 46(1), 20–30, 1997.
15
Raad voor de Transportveiligheid: Contamination of Drinking-water in Leidsche Rijn (in Dutch: Verontreiniging drinkwater Leidsche Rijn), Raad voor de Transportveiligheid, The Hague, the Neterlands, 2003.
Risebro, H. L., Doria, M. F., Andersson, Y., Medema, G., Osborn, K., Schlosser, O., and Hunter, P. R.: Fault tree analysis of the causes of waterborne outbreaks, J. Water Health, 5, 1–18,
20
2007.
Rook, J. J.: Haloforms in drinking-water, J. Am. Water Works Ass., 68(3), 168–172, 1976. Schets, F.A., van Wijnen, J.H., Schijven, J. F., Schoon, A., and Husmant, A.: Monitoring of
waterborne pathogens in surface waters in Amsterdam, The Netherlands, and the potential health risk associated with exposure to Cryptosporidium and Giardia in these waters, Appl.
25
Environ. Microbiol., 74(7), 2069–2078, 2008.
Schijven, J. F., de Bruin, H. A. M., Hassanizadeh, S. M., and Husman, A. M. D.: Bacteriophages and clostridium spores as indicator organisms for removal of pathogens by passage through saturated dune sand, Water Res., 37(9), 2186–2194, 2003.
Schijven, J. F. and Hassanizadeh, S. M.: Virus removal by soil passage at field scale and
30
groundwater protection of sandy aquifers, Water Sci. Technol., 46(3), 123–129, 2002. Schijven, J. F., Hoogenboezem, W., Nobel, P. J., Medema, G. J., and Stakelbeek, A.: Reduction
DWESD
1, 173–212, 2008The Dutch secret
P. W. M. H. Smeets et al.
Title Page
Abstract Introduction
Conclusions References
Tables Figures
◭ ◮
◭ ◮
Back Close
Full Screen / Esc
Printer-friendly Version
Interactive Discussion
sticking efficiencies, Water Sci. Technol., 38(12), 127–131, 1998.
Smeets, P. W. M. H.: Stochastic modelling of drinking water treatment in quantitative microbial risk assessment, Delft University of Technology, Delft, the Nehterlands, 2008a.
Smeets, P. W. M. H., Dullemont, Y. J., van Gelder, P. H. A. J. M., van Dijk, J. C., and Medema, G.: Improved methods for modelling drinking water treatment in quantitative microbial risk
5
assessment; a case study of Campylobacter reduction by filtration and ozonation, J. Water Health, 6(3), 301–314, 2008b.
Staatsblad: Besluit van 9 januari 2001 tot wijziging van het waterleidingbesluit in verband met de richtlijn betreffende de kwaliteit van voor menselijke consumptie bestemd water (Adapta-tion of Dutch drinking water legisla(Adapta-tion), 1–53, Staatsblad van het Koninkrijk der
Nederlan-10
den, 2001.
Theunissen, J. J. H., Nobel, P. J., van de Heide, R., de Bruin, H. A. M., van Veenendaal, D., Lod-der, W. J., Schijven, J. F., Medema, G. J., and van der Kooij, D.: Enterovirusconcentraties bij innamepunten van oppervlaktewater voor de bereiding van drinkwater (Enterovirus concen-trations at collection sites of surface waters for drinking water production) RIVM, Bilthoven,
15
The Netherlands, 18 pp., Report no: 289202013, www.RIVM.nl, 1998.
USEPA: LT2ESWTR, Long Term Second Enhanced Surface Water Treatment Rule, United States Environmental Protection Agency, Washington D.C., USA, 2006
van der Helm, A. W.: Intergated modeling of ozonation for optimization of drinking water treat-ment, Delft university of Technology, Delft, The Netherlands, 2007.
20
van der Kooij, D., Veenendaal, H. and Scheffer, W. J. H.: Biofilm formation and multiplication ofLegionellain a model warm water system with pipes of copper, stainless steel and cross-linked polyethylene, Water Res., 39(13), 2789–2798, 2005.
van der Kooij, D., van Lieverloo, J. H. M., Gale, P., and Stanfield, G.: Distributing drinking water with a low or zero disinfectant residual, Operational and biological aspect, UKWIR (Ed.),
25
2003a.
van der Kooij, D.: Managing regrowth in drinking water distribution systems, in: Heterotrophic Plate Counts and Drinking-water Safety, edited by: Bartram, J., Cotruvo, J., Exner, M., Fricker, C., and Glasmacher, A., IWA Publishing, London, UK, 199–232, 2003b.
van der Kooij, D., van Lieverloo, J. H. M., Schellart, J., and Hiemstra, P. Maintaining quality
30
without a disinfectant residual, J. Am. Water Works Ass., 91(1), 55–64, 1999.
DWESD
1, 173–212, 2008The Dutch secret
P. W. M. H. Smeets et al.
Title Page
Abstract Introduction
Conclusions References
Tables Figures
◭ ◮
◭ ◮
Back Close
Full Screen / Esc
Printer-friendly Version
Interactive Discussion
in the Netherlands, Water Supply, 13(2), 13–23, 1995.
van der Kooij, D. and Veenendaal, H.: Assessment of the biofilm formation potential of synthetic materials in contact with drinking water during distribution, Miami, AWWA WQTC,7–11 Nov., 1993.
van der Veer, A. J.: Bijdrage aan het inzicht rond de verwijdering van indicatororganismen
5
en pathogenen door het zuiveringsproces. (Reduction of indicator organisms by treatment processes). Internal memo., Evides, Rotterdam, The Netherlands, 19 pp., 2008.
van der Wielen, P., Senden, W., and Medema, G.: Removal of Bacteriophages MS2 and Phi X174 during transport in a sandy anoxic aquifer. Environ. Sci. Technol., 42(12), 4589–4594, 2008.
10
van Lieverloo, J. H. M., Mesman, G. A. M., Bakker, G. L., Baggelaar, P. K., Hamed, A., and Medema, G.: Probability of detecting and quantifying faecal contaminations of drinking water by periodically sampling for E. coli: A simulation model study, Water Res., 41(19), 4299– 4308, 2007b.
van Lieverloo, J. H. M., Blokker, E. J. M. and Medema, G.: Quantitative microbial risk
assess-15
ment of distributed drinking water using faecal indicator incidence and concentrations, J, Water Health, 5, 131–149, 2007a.
van Lieverloo, J. H. M., Medema, G., and van der Kooij, D.: Risk assessment and risk manage-ment of faecal contamination in drinking water distributed without a disinfectant residual, J. Water Supply Res. T., 55(1), 25–31, 2006.
20
van Lieverloo, J. H. M., Mesman, G. A. M., Nobel, P. J., and Kroesbergen, J. Hygi ¨enecode drinkwater: Opslag, transport en distributie KIWA Water Research, Nieuwegein, 161 pp., The Netherlands, 2002.
Veenendaal, H. and van der Kooij, D.: Een specifieke kweekmethode voorLegionella pneu-mophila, pp. 36–38, 2007.
25
VEWIN: Water Supply Statistics 2004, VEWIN, Association of Dutch Water Companies, Ri-jswijk, The Netherlands, 2005.
VEWIN: http://www.kraanwater.nu., 2008
Vreeburg, J.: Discolouration in drinking water systems: a particular approach, Delft Univeruity of Technology, Delt, The Netherlands, 2007.
30
DWESD
1, 173–212, 2008The Dutch secret
P. W. M. H. Smeets et al.
Title Page
Abstract Introduction
Conclusions References
Tables Figures
◭ ◮
◭ ◮
Back Close
Full Screen / Esc
Printer-friendly Version
Interactive Discussion
WHO: Guidelines for Drinking Water Quality, third edition World health organization, Geneva, Switzerland, 2004.
Wullings, B. A. and van der Kooij, D.: Occurrence and genetic diversity of unculturedLegionella
spp. in drinking water treated at temperatures below 15 degrees C., Appl. Environ. Microbiol., 72(1), 157–166, 2006.
DWESD
1, 173–212, 2008The Dutch secret
P. W. M. H. Smeets et al.
Title Page
Abstract Introduction
Conclusions References
Tables Figures
◭ ◮
◭ ◮
Back Close
Full Screen / Esc
Printer-friendly Version
Interactive Discussion
Table 1.Typical numbers of pathogens in river water.
Minimum Maximum Reference
Enteric viruseses (PFU/l) 0.04 13 Theunissen et al. (1998)
Campylobacter (MPN/l) 10 10 000 Smeets et al. (2008b)
Giardia(cysts/l) 0.1 10 Schets et al. (2008)
DWESD
1, 173–212, 2008The Dutch secret
P. W. M. H. Smeets et al.
Title Page
Abstract Introduction
Conclusions References
Tables Figures
◭ ◮
◭ ◮
Back Close
Full Screen / Esc
Printer-friendly Version
Interactive Discussion
Table 2. Overview of required log reductions by drinking water treatment to comply to 10−4 infection risk level at 4 locations in the Netherlands.
Organism Location 1 Location 2 Location 3 Location 4
Cryptosporidium 6.4 5.6 5.1 6.5
Giardia 6.7 5.9 5.2 6.9
Campylobacter 8.4 8.5 8.6 6.9
DWESD
1, 173–212, 2008The Dutch secret
P. W. M. H. Smeets et al.
Title Page
Abstract Introduction
Conclusions References
Tables Figures
◭ ◮
◭ ◮
Back Close
Full Screen / Esc
Printer-friendly Version
Interactive Discussion
Table 3.Estimated mean infection risks per person per day when exposed to a mean concen-tration of thermotolerant coliforms of 1 CFU per 100 ml. For enteric viruses in soil or shallow groundwater, three selections of the available ratios were used. Culturable=only ratios of cul-turable enteric viruses to positive (>0) thermotolerant coliforms (coli44); positive data=ratios of positive enteric viruses (culturable and PCR) vs. coli44; all data=all ratios, including data points with one or both values below the detection limit (coli44 concentrations below detection limit were set to 50% of the detection limit) (van Lieverloo et al., 2007a).
Assuming P/Ea Assuming P/Ea Assuming P/Ea ratios from sewage ratios from surface water ratios from soil
and shallow groundwater
Cryptosporidium 5.6×10⁻⁷ 3.2×10⁻⁴ –
Giardia 2.2×10⁻⁷ 2.7×10⁻⁵ –
Campylobacter 4.0×10⁻³ 4.8×10⁻² –
Enteric viruses
– culturable 6.3×10⁻⁷ 2.2×10⁻⁵ 6.8×10⁻³
– positive data – – 3.6×10⁻²
– all data – – 0.24
a
P/E ratio: pathogen toE. colior thermotolerant coliform ratio
DWESD
1, 173–212, 2008The Dutch secret
P. W. M. H. Smeets et al.
Title Page
Abstract Introduction
Conclusions References
Tables Figures
◭ ◮
◭ ◮
Back Close
Full Screen / Esc
Printer-friendly Version
Interactive Discussion
Assemble team
Describe water supply
Conduct hazard analysis
Identify control measures
Define operational limits
Establish monitoring
Establish corrective actions and incidence response
Establish record keeping
Validation and verification System
Assessment
Operational Monitoring
Management& Communication
Figure 1 Water Safety Plan scheme (WHO 2004)
DWESD
1, 173–212, 2008The Dutch secret
P. W. M. H. Smeets et al.
Title Page
Abstract Introduction
Conclusions References
Tables Figures
◭ ◮
◭ ◮
Back Close
Full Screen / Esc
Printer-friendly Version
Interactive Discussion groundwater - phreatic / freatisch
riverbank water surface water - infiltration surface water - direct production
DWESD
1, 173–212, 2008The Dutch secret
P. W. M. H. Smeets et al.
Title Page
Abstract Introduction
Conclusions References
Tables Figures
◭ ◮
◭ ◮
Back Close
Full Screen / Esc
Printer-friendly Version
Interactive Discussion 0%
1% 10% 100%
0,1 1 10 100 1000 10000 100000
Clostridium PerfringensCFU/l
Pr
opor
tion of
sa
m
p
les
River Meuse water After passing through reservoirs
0% 1% 10% 100%
0,1 1 10 100 1000 10000 100000
Clostridium PerfringensCFU/l
Pr
opor
tion of
sa
m
p
les
River Meuse water After passing through reservoirs
DWESD
1, 173–212, 2008The Dutch secret
P. W. M. H. Smeets et al.
Title Page Abstract Introduction Conclusions References Tables Figures ◭ ◮ ◭ ◮ Back Close
Full Screen / Esc
Printer-friendly Version Interactive Discussion 0% 10% 20% 30% 40% 50% 60% B u lg a ria S lov en ia H un gar y Ir e la n d C z e c h R ep ubl ic Ro m a n ia Ita ly S lov ak ia Fr a n c e Sp a in Gr e a t B ri tt a in S w e den F inl and De n m a rk G er m any N e the rl a nds L e ak ag e
DWESD
1, 173–212, 2008The Dutch secret
P. W. M. H. Smeets et al.
Title Page
Abstract Introduction
Conclusions References
Tables Figures
◭ ◮
◭ ◮
Back Close
Full Screen / Esc
Printer-friendly Version
Interactive Discussion
{
U
DWESD
1, 173–212, 2008The Dutch secret
P. W. M. H. Smeets et al.
Title Page
Abstract Introduction
Conclusions References
Tables Figures
◭ ◮
◭ ◮
Back Close
Full Screen / Esc
Printer-friendly Version
Interactive Discussion 0
2 4 6 8 10 12 14
Ent. virus Camp. Giardia Crypto.
Log r
e
duc
ti
o
n UV
Filtr SSF Filtr Coa/sed Reservoir Required
DWESD
1, 173–212, 2008The Dutch secret
P. W. M. H. Smeets et al.
Title Page
Abstract Introduction
Conclusions References
Tables Figures
◭ ◮
◭ ◮
Back Close
Full Screen / Esc
Printer-friendly Version
Interactive Discussion
Giardia
0 2 4 6 8 10 12 14 16 18
1 2 3 4 5 6 7 8 9 10
System number
Lo
g r
e
duct
ion
Post disinf RO UF UV Filtr SSF Filtr GAC Ozone Filtr RSF Coa/sed Soil passage Reservoir Required