Update analysis on the international crisis
and its impact on the Mexican economy
JUAN CARLOS MORENO-BRID CARLOS ALBERTO FRAGA-CASTILLO*
The aim of this study is to analyze the current state of the Mexican economy in the face of the international crisis. Two questions are asked: Is the international crisis over? Is the Mexican economy strong and resilient enough to face the crisis in the eurozone? The irst of these questions is answered in the irst part. The answer to the second question is discussed in the second part of this study. Also examined are the large number of short, medium and long term problems that the Mexican economy will have to face in 2012 and perhaps 2013.
Keywords: international crisis; Mexican economy; eurozone; Emerging coun-tries; external restrictions to growth.
JELClassiication: 01.
INTERNATIONAL FINANCIAL CRISIS
In the 1970s the Mexican singer José José popularized the song “What is past is past.” The lyrics of the chorus are sung as follows “the past, now past no longer interests me.” In 2008, the year in which the international crisis began, it was pre-dicted that the recovery of the most affected countries, such as Spain, would begin in 2009. Negative factors, such as the high rates of unemployment would be a thing of the past. The recovery would confirm what José referred to: the past… is past. Recent fluctuations and the forthcoming recession in the eurozone countries in 2013 prompt the question: Has the past really past? The answer is simply: no.
* Respectively, Deputy Director of Economic Commission for Latin America and Caribbean (ECLAC) Regional Headquarters in Mexico. E-mail: [email protected]; Lecturer/Researcher of Escuela Superior de Economia Del Instituto Politécnico Nacional (IPN) in Mexico. E-mail: cfraga@ipn. mx. The opinions expressed in this article are not necessarily the view held by ECLAC and IPN, but are those of the authors. Submitted: 15/July/2013; Approved: 4/October/2013.
Negative aspects of the crisis, which began in 2008, are still with us. According to Figure 1, significant foreign debt and vast fiscal deficit remain unresolved problems in several of the eurozone countries. Fiscal revenues dropped owing to the reduced growth of GDP, however levels of public spending were maintained. Consequently, debt and fiscal deficit disappeared. According to the trend registered in Figure 1, the group of countries that most rapidly increased their debt as a share of GDP in 2008 and 2010 are Greece, followed by Ireland, then Portugal and Spain. The forecasts for these countries predict stability and no debt reduction until 2014. According to the deficit trend shown in Figure 1 from 2008 to the end of 2012, Ireland has the highest fiscal deficit in relation to GDP, followed by Greece, the United States, Spain and Portugal. According to the forecasts, these countries will not stabilize their fiscal balances or achieve a deficit of around -5% until 2014.
In contract to the international picture, Mexico has had stable levels of debt during this period and a fiscal deficit close to 0%. According to forecasts, similar levels will be registered in forthcoming years.
Figure 1 External Conditions
-35.0 -30.0 -25.0 -20.0 -15.0 -10.0 -5.0 0.0 5.0
2006 2007 2008 2009 2010 201
1
2012 2013* 2014* Select Countries
Fiscal Balance (% GDP)
0 20 40 60 80 100 120 140 160 180 200
2006 2007 2008 2009 2010 201
1
2012 2013* 2014* Select Countries
Public Debt (% GDP)
Germany Greece Italy Ireland
Portugal Spain USA Mexico
Germany Greece Italy Ireland
Portugal Spain USA Mexico
Source: prepared by the authors on Fiscal Monitor data of International Monetary Fund (IMF) *Projections
The crisis has not disappeared, in fact it has spread and it not only affecting developed countries, but also emerging countries. According to the trend for January 2006 to June 2013, the lead indicators shown in Figure 2 reveal that the crisis be-tween 2008 and 2009 in the United States, the eurozone and Japan had major reper-cussions for Brazil and the Russian Federation and less so for China and India.
Figure 2
Composing Leading Indicatores: Jan 2006 - Apr 2013
90 92 94 96 98 100 102 104
Jan-2006 Jun-2006 Dec-2006 Jun-2007 Dec-2007 Jun-2008 Dec-2008 Jun-2009 Dec-2009 Jun-2010 Dec-2010 Jun-20
11
Dec-201
1
Jun-2012 Dec-2012 Apr-2013
Developed Countries
Eurozone U.S.A. Japan
80 85 90 95 100 105 110
Jan-2006 Jun-2006 Dec-2006 Jun-2007 Dec-2007 Jun-2008 Dec-2008 Jun-2009 Dec-2009 Jun-2010 Dec-2010 Jun-201
1
Dec-201
1
Jun-2012 Dec-2012 Apr-2013
Emerging Countries
Brazil China India Russian Federation
Source: prepared by the authors on basis of Organization for Economic Cooperation and Development (OECD).
The indicators dropped again for the United States, Japanese and the eurozone economies from June 2011. The eurozone was worst affected by this new period of recession. Various analysts concur that these indicators continued to drop in 2012 and that the eurozone continued to be the most affected. Although the United States show a relative improvement from June 2012 to April 2013, its performance could be affected by the fall in the Eurozone, which in turn could adversely affect the Mexican economy. Consequently, the key issue for the Mexican economy in 2013 is the extent to which the eurozone might fall and the repercussions this could have for the U.S. economy.
Emerging economies have also felt the recent reduction in economic activity in developed countries. India, Brazil and Russian have suffered most from the ad-verse effects, while stagnation in China negatively influences manufacturing exports in Mexico.
Figure 3 shows that despite the negative situation facing the global economy, the U.S. economy is beginning to show signs of recovery. The unemployment rate begins to fall from February 2010 to October 2013, falling from 9.8% to 7.6% respectively. Unemployment is still higher than in 2007. This reflects the fact that recovery in the United States remains slow.
According to the Case-Shiller index applied to twenty U.S cities, housing pric-es have dropped considerably. However, since January 2010, this trend has leveled out (see Figure 3).
Figure 3
7 8 9 10 11 12 13 14
1980Q1 1982Q4 1985Q1 1986Q2 1992Q2 1996Q4 2000Q4 2004Q4 2007Q3 2009Q1 201
1Q1
2013Q1
USA Household Debt (% of Disposable Personal Income; a.e.)
0.0 2.0 4.0 6.0 8.0 10.0 12.0
Jan 00 Dec 00 Nov 01 Oct 02 Sep 03 Aug 04 Jul 05 Jun 06 May 07 Apr 08 Mar 09 Febr 10 Jan 1
1
Dec 12 May 13
USA Employment Rate
(% Economic Population; a.e.)
100 120 140 160 180 200 220
Jan-2000 Sep-2001 May-2003 Jan-2005 Jun-2006 May-2008 Jan-2010 Aug-20
1
1
May-2012 Oct-2012 Mar-2013
U.S.A. House Price Case Case Shiller 20 Cities (Index Jan 2000=100; a.e.)
Although there have been improvements in the United States, the eurozone’s economy is still weak, particularly in Greece, Portugal, Spain, Ireland and Italy. The perceived risk has risen considerably in these countries. According to the indicators that measure credit risk, Portugal, Spain and Italy are the countries that present the highest risk (BANXICO, 2013, p. 24). For Mexico, Spain’s credit risk is a worrying factor given that a good number of her banks belong to Spanish corporations.
MEXICO TODAY. STRONG AND RESILIENT?
Positive features
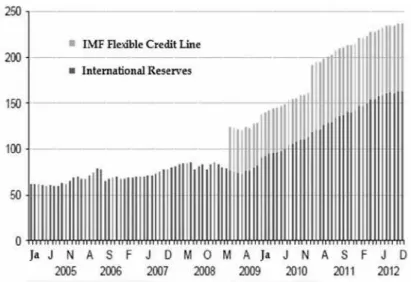
hovered at around 80,000 million dollars. The reserves and debt figure for 2012 is slightly above 240,000 million dollars. This represents a significant resource for fac-ing global adversity, particularly given that Mexican exports are expected to decline and imports to rise in 2013, and consequently the current account deficit to increase.
Figure 4: International Reserves
Source: Bank of Mexico and International Monetary Fund.
Rising international oil prices and a positive forecast for the future is another positive feature of the Mexican economy. From 2004 to 2008 the international price of oil rose steadily. During the 2008-2009 crisis, the international price of oil dropped 40 dollars a barrel, but it rose in December 2012 to more 90 dollars a barrel (see Figure 5).
Figure 5: Oil Prices
0 20 40 60 80 100 120 140 160
Jan-2002 May-200 Sep-200 Jan-2003 May-200 Sep-200 Jan-2004 May-200 Sep-200 Jan-2005 May-200 Sep-200 Jan-2006 May-200 Sep-200 Jan-2007 May-200 Sep-200 Jan-2008 May-200 Sep-200 Jan-2009 May-200 Sep-200 Jan-2010 May-201 Sep-201 Jan-20
11
May-201 Sep-201 Jan-2012 May-201 Sep-201 WTI
MMEX BRENT
84 86 88 90 92 94 96 98
Jan-13 Jan-14 Jan-15 Jan-16 Jan-17 Jan-18 Jan-19 Jan-20
11/20/12 3 months ago
6 months ago 1 year ago
Observed Futures of WTI
Forecasts indicate that prices for 2013 to 2020 will remain high (see Figure 5). Consequently, the share of fiscal revenue from oil will not be affected by an unfa-vorable international environment in 2013.
In contrast to the situation in 2011 and 2012 for the weaker economies of the Eurozone, a recession in 2013 will not severely affect federal government finances within the Mexican economy. The forecast of percentage fiscal deficit in 2013 is less than in 2012 (see Figure 1). A more precise figure, including Mexican Petroleum (PEMEX) investment is around -2.4%, whereas in 2011, the figure was -2.5% (ECLAC, 2012a, p. 75). Furthermore, the expenditure budget approved for 2013 remains conservative given the negative environment expected in 2013, when a deficit equivalent to 0.0% of GDP is forecasted (-2.0% if PEMEX investment is taken into account) (SHCP, 2013, p. 74). Furthermore, although the end of 2012 inflation rose to 4.3% is expected in the medium term it will be 3.6%.
Another positive feature of the Mexican economy is the exchange rate’s flex-ibility when faced with external shocks. In fact, Mexico, together with Brazil, Colombia and Chile reduced pressure on the exchange rate at the most difficult point of the crisis, quickly correcting the overvaluation of their currencies (Ocampo, 2009, p. 30). Variations in the exchange rate would enable accounts to be adjusted should an adverse situation affect the balance of payments, en-abling the Mexican economy to recover quickly from crisis, an advantage that weaker economies such as Spain do not have. A devaluation in Spain could make exports more competitive and reactivate the economy more quickly. However the way things currently stand for the Spanish economy, this is not possible. New government measures seek to influence production costs in the same way as a devaluation: by reducing internal production costs. We shall see if this is possible in forthcoming months.
Negative features
Figure 6
Evolution of Mexican Economy
100 105 110 115 120 125 130 135 140
2007/01 2007/06 2007/
11
2008/04 2008/09 2009/02 2009/06 2009/12 2009/12 2010/10 20
11
/03
20
11
/09
2012/05 2012/10 2013/02 2013/04
National Indexes of Economic Activity (2003=100) Total Industrial Services 7.4 7.5 7.6 7.7 7.8 7.9 8 8.1
2008Q2 2008Q3 2008Q4 2009Q1 2009Q2 2009Q3 2009Q4 2010Q1 2010Q2 2010Q3 2010Q4 201
1Q1 201 1Q2 201 1Q3 201 1Q4
2012Q1 2012Q2 2012Q3 2012Q4 2013Q1
Manufacturing Exports*
Other USA
Manufacturing exports to the United States and other countries have begun to decline. This has had repercussions on the Mexican manufacturing exports.
It is hoped that the real GDP growth rate for the first quarter of 2013 will be lower compared with the rates registered since the Mexican economy recovered from one of its worst crises in history (see Figure 7).
Figure 7
Growth of Real GDP in Mexico
-12 -10 -8 -6 -4 -2 0 2 4 6 8 10
2006/01 2006/02 2006/03 2006/04 2007/01 2007/02 2007/03 2007/04 2008/01 2008/02 2008/03 2008/04 2009/01 2009/02 2009/03 2009/04 2010/01 2010/02 2010/03 2010/04 20
11 /01 20 11 /02 20 11 /03 20 11 /04
2012/01 2012/02 2012/03 2012/04
2013/01p/
Source: Instituto de Estadística Geografía e Informática (INEGI).
p: preliminary data
Source: Instituto Nacional de Estadística Geografía e Informática (INEGI).
The second negative aspect is the existence of external restrictions to growth. For four decades, whenever there has been growth in the Mexican economy, the current account deficit has increased. This reduces or disappears if the growth rate reduces (see Figure 8).
Figure 8
External Restriction to Growth in Mexico
-1 0 1 2 3 4 5 6 7 8
-3 -2 -1 0 1 2 3 4 5 6 7
A
verege Growth of rate of GDP
Trade Balance (% GDP) 1970-81
1960-69
1982-87 1988-94
1995-2000
2001-12
Source: prepared by the authors on basis CEPALSTAT data from Economic Commission for Latin America and Caribbean (ECLAC).
The situation from 2001 to 2012, when there is an average growth rate of 2.3% with a trade deficit of more than -1.6% (see Figure 8) could be a bad sign for 2013 and the years to come. If the restrictions continue, the economy will slow down to eliminate the trade deficit.
Restrictions to growth have had an effect on the minimum growth of the Mexican economy over the last ten years. The low employment rates that growth has generated, compared to Brazil, Argentina and Venezuela are proof of this (see Figure 9). Added to this is the reduced capacity for employment generation com-pared to growth of the economically active population (AEP). This is a phenome-non that does not occur in the other countries shown in Figure 9, except for Colombia.
The lack of employment growth is linked to an increase in poverty, inequality and insecurity.
Coinciding with the lack of growth momentum is an increase in poverty. According to Chaves (2011) the number of people living below the breadline has
increased since 2008, representing 20% of the total population in 2010. The same can be said for patrimony poverty, which in 2010 represented 50% of the total population.
is significantly less, the Gini Index at market entry in 2008 was 0.45 and 0.34 after transfers and taxes (OECD/ECLAC, 2011, p. 17). The level of inequality has not changed much in 2011, compared with 2008. According to ECLAC, the Gini coef-ficient is around 0.48 (ECLAC, 2012b, p. 23).
In conclusion, the lack of economic momentum, restrictions to growth, the increase in poverty and high levels of inequality are problems that test the strength and resilience of the Mexican economy before the financial difficulties facing Europe and the global economy.
CONCLUSIONS
The international economic crisis appears to be on its way out, but is far from over. The Mexican Economy has room for maneuver in the short term, but there are challenges to face in the medium and long term. The federal government’s view is that the present state of the economy is without doubt capable of facing chal-lenges in 2013. However, researchers, business leaders and international organiza-tions have pointed out medium and long term obstacles. Many have indicated that real growth has been meager in the last thirty years (2.8%), and that for the last thirty years there has been heavy dependency on the fiscal revenue of oil exports. For nearly forty years now, fiscal reform has been needed to resolve the low level of revenue collected from taxation. The tax system is also regressive, gravitating more towards low and medium income, with special measures applicable to high incomes. Levels of public and private investment are insufficient. As a result, infra-structure has deteriorated and machinery and equipment needs modernizing. Monetary policy has succeeded in reducing interest rates. However, this has had a low impact on housing mortgage rates and on companies. The growth model ap-plied to exports has focused exports on a limited number of sectors and has had
Figure 9
Employment Growth, of AEP and Working-Age population
0 1 2 3 4 5 6
ALC AL-7 ARG BRA CHL COL MEX PER VEN
%
Annual Growth
Employment Growth (2000-2010)
AEP Growth (2000-2010)
Population Growth 15-64 (2000-2010)
little impact on other sectors. Finally, underemployment and unemployment is in-creasingly affecting the highly qualified among the population.
REFERENCES
BANXICO (Banco de México) (2013) Inlation Report January-March 2013.
ECLAC (Economic Commission for Latin America and Caribbean) (2012a) Preliminary Overview of the Economies of Latin America and the Caribbean 2012, (LC/G.2555-P), Santiago, Chile. Uni-ted Nations publication, Sales No: E.13.II.G.2.
ECLAC (Economic Commission for Latin America and Caribbean) (2012b) Social Panorama of Latin America 2012, (LC/G.2557-P), Santiago, Chile. United Nations publication, Sales No.: E.13.
II.G.6.
CHAVES, R. (2011) El Modelo Económico de México y Políticas Públicas para el Crecimiento, World Bank Latin America and Caribbean Region, Mexico. http://cefp.gob.mx/foro/2011/modelo_eco-nomico/bm.pdf
OCAMPO, J. A. (2009) “Impactos de las crisis mundial sobre América Latina”, Revista de la CEPAL, 73(Abril): 9-32.
OECD/ECLAC (2011), Perspectivas Económicas de América Latina 2012: Transformación del Estado para el Desarrollo, OECD Publishing, http://dx.doi.org/10.1787/leo-2012-es