www.scielo.br/rbg
IMPULSES OF THE GEOMAGNETIC SECULAR VARIATION (JERKS)
AT VASSOURAS MAGNETIC OBSERVATORY DETECTED BY WAVELET ANALYSIS
Katia J. Pinheiro and Jandyr M. Travassos
Recebido em 21 maio, 2009 / Aceito em 19 fevereiro, 2010 Received on May 21, 2009 / Accepted on February 19, 2010
ABSTRACT.Geomagnetic jerks are abrupt changes in the secular variation generated in the Earth’s core. Even the most basic characteristics of jerks as its origin and duration, are still a matter of debate in the scientific community. Data obtained by magnetic observatories and satellites are used in these studies. The main characteristic of jerks is that they are not simultaneous at the Earth’s surface, with a general pattern of a first arrival in the Northern hemisphere, with a later appearance in the South by about two years. The non-simultaneous behavior of jerks is important to constrain the electrical conductivity of the lower mantle and for a better understanding on how jerks are generated in the core. The main objective of this paper is to discuss methods of detection of jerks at Vassouras (VSS) observatory (Brazil). In addition, we want to highlight the relevance of detection of jerks in observatories in the Southern hemisphere by encouraging the improvement of the data quality and the discussion of the main geomagnetic jerks characteristics.
Keywords: geomagnetic jerks, Vassouras magnetic observatory, wavelet analysis.
RESUMO.Osjerkss˜ao mudanc¸as abruptas na variac¸˜ao secular geradas no n´ucleo terrestre. At´e as caracter´ısticas mais b´asicas dosjerks, como sua origem e durac¸˜ao, s˜ao ainda controversas. Dados obtidos em observat´orios magn´eticos e sat´elites s˜ao usados neste tipo de estudo. A principal caracter´ıstica dosjerks´e que eles n˜ao s˜ao simultˆaneos na superf´ıcie da Terra, com um padr˜ao geral de chegada mais cedo no hemisf´erio Norte e mais tarde no hemisf´erio Sul, com um intervalo da ordem de 2 anos. O padr˜ao n˜ao simultˆaneo dosjerks´e importante para estudos sobre a condutividade el´etrica do manto inferior e para um melhor entendimento de como osjerks
s˜ao gerados no n´ucleo. O principal objetivo deste artigo ´e discutir m´etodos de detecc¸˜ao dosjerksno observat´orio de Vassouras (VSS, Brasil). Ressaltamos a relevˆancia da identificac¸˜ao dosjerksem observat´orios no hemisf´erio Sul, estimulando a melhora da qualidade dos dados e a discuss˜ao das principais caracter´ısticas dosjerks.
Palavras-chave: impulsos da variac¸˜ao secular geomagn´etica (jerks), observat´orio magn´etico de Vassouras, an´alise de wavelet.
patterns can not be easily detected, therefore various techniques have been used to decrease the external magnetic field influence from the data and to identify jerks.
The occurrence date of jerks is a subject of intense debate which depends strongly on the method and dataset used. Some authors used annual means that contain less influence of the ex-ternal field, while others analyzed monthly means in order to have a better temporal resolution.
The most common method applied to detect jerks is the fitting of two straight lines to the secular variation, by least-squares. The wavelet analysis is another method that has been applied to iden-tify jerks. Alexandrescu et al. (1996) used the continuous wavelet transform and found five events characterized as worldwide jerks, occurred during the last century: 1901, 1913, 1925, 1969 and 1978 (Fig. 2). Some works point to more recent global jerks at 1991 (De Michelis et al., 1998, 2000) and at 1999 (Mandea et al., 2000).
The global or local extension of geomagnetic jerks is another widely discussed topic. For example, the 1932 jerk is local since it was mostly observed in the southern hemisphere and not seen in any European observatory. Another local jerk was detected in 1949, observed mainly in the Pacific area and in the American region (Alexandrescu et al., 1996). A more recent and local jerk occurring at 2003 was found by Olsen & Mandea (2007) by using satellite data.
However the best-studied jerks of global extension occur-red in 1969, 1978 and 1991. These three events show a non-simultaneous behavior. This means that the same event occurs in slightly different times at distinct observatories; usually these jerks appear at a later time in the southern hemisphere, with a time delay of about two years (Alexandrescu et al., 1996; De Michelis et al., 2000; Chambodut & Mandea, 2005).
Jerk occurrence times are an important issue in geomagne-tism since its non-simultaneous behavior has been used in stu-dies of constraints of the electrical conductivity of the lower man-tle that is poorly known (Alexandrescu, 1999; Nagao et al., 2003; Pinheiro & Jackson, 2008).
some cases the slopes are indistinguishable (e.g. Honolulu ob-servatory). These results showed that the jerk amplitude, defined as the difference of slope of the two straight line segments, also varies at the Earth’s surface.
In addition, even in data where jerks are clear, there is an un-certainty in determining the date when they happen as it is believed that they are not instantaneous, resulting in a SV curve changing sign over an approximate 2 year period.
An alternative approach that does not consider a priori infor-mation is presented in Whaler (1987). A linear-segment-finding algorithm is applied and the hypothesis that the points all lie on the same line is tested for all possible segments over the whole interval.
More recently, Alexandrescu et al. (1996) and De Michelis & Tozzi (2005) applied a wavelet analysis assuming sudden events of an unknown nature at undefined dates may have occurred in the geomagnetic field.
In this paper we applied the classical and the wavelet analysis in order to detect jerks and exemplify how the exact time depends on the method and dataset used.
WAVELET ANALYSIS
A wavelet is a waveform of limited duration that has an average value of zero and tends to be irregular and asymmetric. Its main property is the dilation, which is the variation of the wavelet scale: the larger the scale, the lower the frequency analyzed.
The advantage of using wavelets is that it is possible to in-vestigate both the global (low frequency) and the detail (high fre-quency) of the signal by stretching and squeezing the wavelet while sliding it along the signal. In contrast to Fourier analysis, it is possible to detect localized time features of the signal.
Figure 1– Simple schematic display of secular variation for a hypothetical component of the magnetic field. The first graph (A) shows the typical V-shape of jerks in the secular variation and B and C show sketched the secular acceleration and the third differences, respectively. In this case, we would have an impulse in the third differences at the time when the jerk occurred.
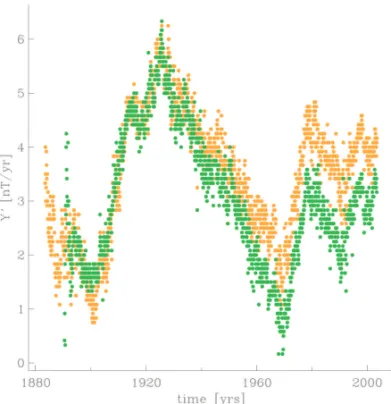
Figure 2– Secular variation of East component of Chambon la Forˆet observatory in France (yellow circles) and Niemegk observatory in Germany (green circles). The data shown are first differences of observatory monthly means that have been smoothed by a 12-month running average.
A problem with wavelet analysis is that the boundary effects are important and prevent detection of events close to the begin-ning and end of the time series. In this case it is necessary to apply a more classical method such as simply analyzing the trend of secular variation.
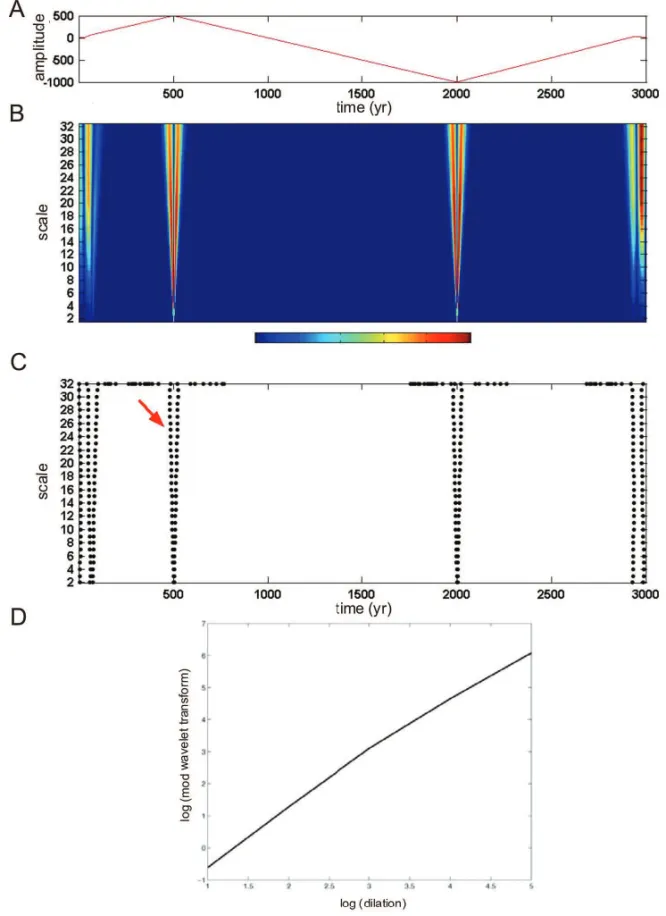
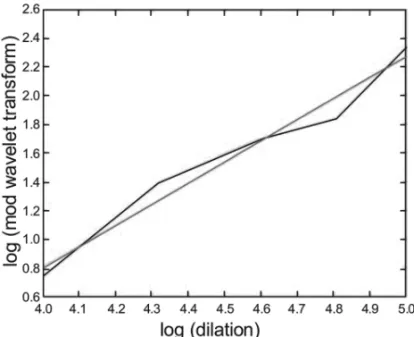
A synthetic example, to illustrate the ability of wavelets to de-tect jerks, is shown in Figure 3. We simulated two changes of slope which cause a convergence of the wavelet transform coef-ficients to the exact point of the discontinuity. The regularity of the discontinuity is an important characteristic of the jerk and it is
calculated by a log-log plot of the scalesversus modulus of the coefficients along the line of maxima.
VASSOURAS OBSERVATORY (VSS)
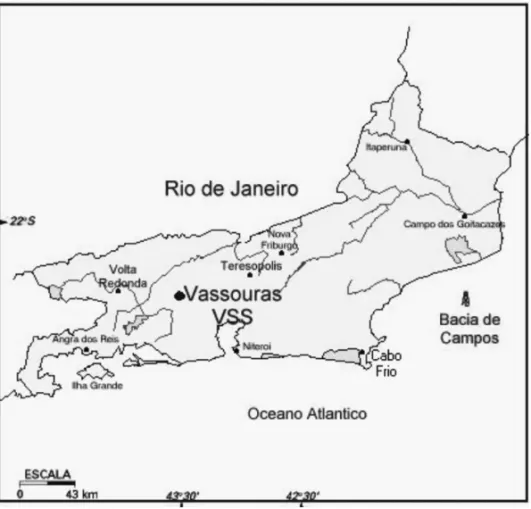
In this paper we analyze geomagnetic jerks at Vassouras observa-tory, in Rio de Janeiro (Brazil), as it is shown in Figure 4. Monthly and annual means of the X and Y components were analyzed.
In this work we recovered data from Vassouras observatory, but a gap from 1946 to 1947 still remained. That is the reason why the time series was divided in two parts: one from 1915 to 1946 and the second one from 1947 to 2001. Gaps in the dataset shorter than 6 months were accepted and in these cases a linear interpolation was applied.
RESULTS AND DISCUSSION
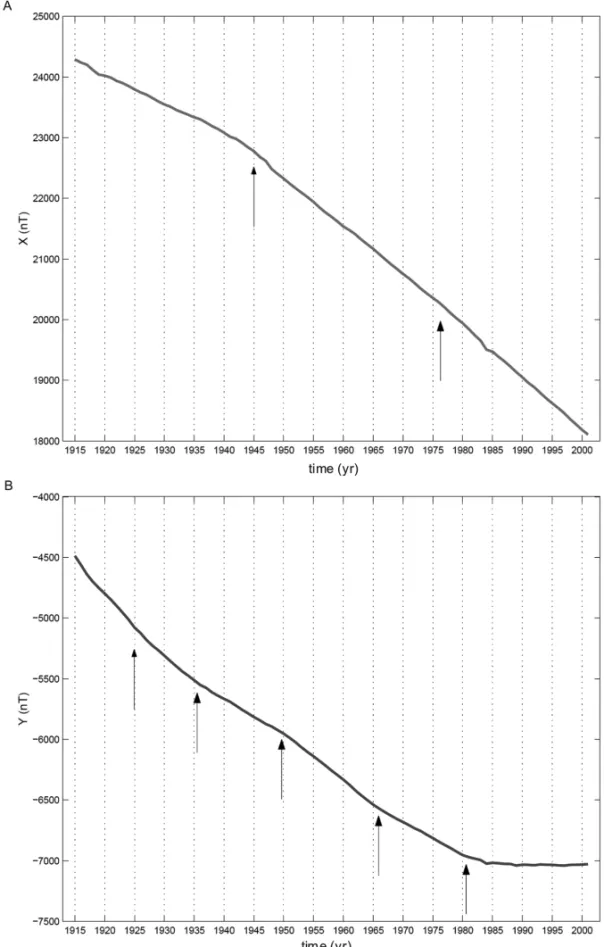
The monthly means of the X and Y components at Vassouras ob-servatory (Fig. 5) show variations of their slope that might be candidates to jerks. For example in Y component we can see some changes occurring for example at 1925 and around 1980. By following the usual procedure to detect jerks we calculated the first time derivative expecting to enhance these changes. How-ever, as shown in Figure 6, it was not possible to detect changes of trend probably due to a low signal-to-noise ratio at Vassouras and because the first derivative enhances signal and noise alike.
Figure 3– Synthetic signal simulating two jerks (A), continuous wavelet transform (B), lines of maxima coefficients of the wavelet transform (C) and scaleversusabsolute value of the maxima coefficients of the wavelet transform, in log-log scale.
Note that depending on how one fits the lines the dates will vary substantially.
One way to try to solve this limitation is using wavelet analy-sis. The wavelet transform was applied to the monthly means of
the X and Y component at Vassouras observatory to detect the geomagnetic jerks.
Figure 4– Localization of Vassouras observatory, Rio de Janeiro, Brazil.
lower and higher scales. The lines of maxima of the wavelet trans-form do not converge and are not straight, as in the synthetic example (Fig. 3).
We built the log-log plot of the coefficients along the ma-xima lines of the wavelet coefficients (Fig. 10) from 16 to 32. This range of scale was chosen because we expected jerks to be pre-sent in higher scales that correspond to changes in the low fre-quency content of the signal, below that scale range the data is noisy. We selected the ridge functions that have positive slopes that characterize the presence of jerks (Alexandrescu et al., 1995). Table 1 shows the occurrence dates for the jerks in Y component are 1922.5 (a=1.67), 1941 (a=1.47) and 1969 (a=1.37) and
in X component it is 1932.9 (a=2.03).
Because of the high content of noise in the plane time-scale we tried another solution to detect jerks (Fig. 11). We applied the wavelet filter to recover the lower frequency contents in the annual means by the approximation given by the wavelet in the higher scales. The application of wavelet filtering reveals that the noise in the smaller scales may be the main cause for the problems in the wavelet transform.
We achieved a reasonable separation of signal and noise. It allows the determination of the dates of occurrence in the filtered signal using linear regression (Fig. 11). There are other
approxi-mations that could be done, but the idea was to delineate variati-ons in a V-shape that would occur in this filtered data.
Table 1– Lines of maxima coefficients of the wavelet transform, the date that it happened and the regularities of geomagnetic jerks obtained from wavelet analysis.
Lines of
Date Regularity maxima coefficients
X7 1932.9 2.03 Y4 1922.5 1.67 Y10 1941.0 1.47 Y15a 1969.0 1.37
CONCLUSION
The signal to noise ratio at Vassouras observatory is low, this cau-ses the time derivatives to be noisy and more difficult to detect the jerk occurrence times.
Figure 5– Monthly means of the X (A) and Y (B) components of the Vassouras observatory.
Not all events at Vassouras appeared in both X and Y com-ponents at the same time. Some of them are only detectable in one of the components, as is showed in Table 1. In most of the cases the impulses are more conspicuous in the Y component.
Figure 6– Secular variation of X (A,B) and Y (C,D) components obtained by monthly means at the Vassouras observatory.
Figure 8– In A, the secular variation of the Y component of the Vassouras observatory, from 1915 to 1946, in B the continuous wavelet transform and in C the lines of maxima coefficients of the wavelet transform.
Table 2– Detected occurrence dates of geomagnetic jerks in the X and Y components of the magnetic field at Vassouras observatory. This table shows results using (1) raw data, (2) 12-month running average, (3) wavelet transform and (4) wavelet filter.
Raw Running Wavelet Wavelet data average transform filtering 1922 Y X and Y 1925 Y Y X and Y
1932 X X
1941 X X and Y Y Y 1949 X X
1960 Y Y
1969 Y Y Y
1978 Y Y Y
We concluded that the wavelet transform is not an effective method to detect jerk in all observatories. When the signal-to-noise ratio is low, as in Vassouras observatory, the wavelet
trans-form coefficients panel is cluttered with discontinuity-like noise features. Moreover the resultant ridge functions are too noisy to allow the estimation of regularity.
The best results were obtained using the wavelet transform to filter the geomagnetic data in which we decreased the influence of spikes and other high-frequency noise. The signal-to-noise ratio was substantially improved by recovering the long-period contents of the signal and the lines are better fitted to the filte-red data. We believe that there is not a unique way to detect the geomagnetic jerks in any observatory around the world. Each observatory should have unique characteristics and limitations to the best methodology to be employed.
REFERENCES
Figure 9– In A, the secular variation of the Y component of the Vassouras observatory, from 1948 to 2001, in B the continuous wavelet transform and in C the lines of maxima coefficients of the wavelet transform.
Figure 11– Wavelet filtering of the annual means secular variation of the X (A) and Y (B) components of the magnetic field at Vassouras observatory, from 1915 to 2001. The solid lines were fitted visually in order to determine the date of occurrence of the jerks.
ALEXANDRESCU M, GIBERT D, HULOT G, LE MOU¨EL J-L & SARACCO G. 1996. Worldwide wavelet analysis of geomagnetic jerks. J. Geophys. Res., 101(B10): 21975–21994.
ALEXANDRESCU M, GIBERT D, LE MOU¨EL J-L, HULOT G & SARACCO G. 1999. An estimate of average lower mantle conductivity by wavelet analysis of geomagnetic jerks. J. Geophys. Res., 104(B8): 17,735– 17,745.
CHAMBODUT A & MANDEA M. 2005. Evidence for geomagnetic jerks in comprehensive models. Earth Planets Space, 57: 139–149.
COURTILLOT V & LE MOU¨EL J-L. 1984. Geomagnetic secular variation impulses. Nature, Review article, 311: 709–716.
DE MICHELIS P & TOZZI R. 2005. A Local Intermittency Measure (LIM) approach to the detection of geomagnetic jerks. Earth Planet. Sci. Lett., 235: 261–272.
DE MICHELIS P, CAFARELLA L & MELONI A. 1998. Worldwide character of the 1991 geomagnetic jerk. Earth Planet. Sci. Lett., 25(3): 377–380.
DE MICHELIS P, CAFARELLA L & MELONI A. 2000. A global analysis of the 1991 geomagnetic jerk. Geophys. J. Int., 143: 545–556.
LE HUY M, ALEXANDRESCU M, HULOT G & LE MOU¨EL J-L. 1998. On the characteristics of successive geomagnetic jerks. Earth Planets Space, 50: 723–732.
LE MOU¨EL J-L, DUCRUIX J & DUYEN CH. 1982. The worldwide cha-racter of the 1969-1970 impulse of the secular acceleration rate. Phys. Earth Planet. Int., 28: 337–350.
MANDEA M, BELLANGER E & LE MOU¨EL J-L. 2000. A geomagnetic jerk for the end of the 20thcentury? Earth Planet. Sci. Lett., 183: 369–373.
NAGAO H, IYEMORI T, HIGUCHI T & ARAKI T. 2003. Lower mantle con-ductivity anomalies estimated from geomagnetic jerks. J. Geophys. Res., 108(B5): 2254.
OLSEN N & MANDEA M. 2007. Investigation of a secular variation im-pulse using satellite data: The 2003 geomagnetic jerk. Earth Planet. Sci. Lett., 255: 94–105.
PINHEIRO K & JACKSON A. 2008. Can a 1D mantle electrical conducti-vity model generate magnetic jerk differential time delays? Geophys. J. Int., 173(3): 781–792.
WHALER KA. 1987. A new method for analysing geomagnetic impulses. Phys. Earth Planet. Int., 48: 221–240.
NOTES ABOUT THE AUTHORS
Katia Jasbinschek dos Reis Pinheiro.Graduac¸˜ao em Oceanografia pela Universidade do Estado do Rio de Janeiro (2001), mestrado em Geof´ısica pelo Observat´orio Nacional (2003) e doutorado no ETH Zurique (Su´ıc¸a) em geomagnetismo. Trabalhou como contratada na Petrobras na ´area de geof´ısica ambiental (2002-2004). Tem experiˆencia na ´area de Geociˆencias, com ˆenfase em geomagnetismo, atuando principalmente nos seguintes temas: variac¸˜ao secular geomagn´etica e condutividade el´etrica do manto. Trabalha como pesquisadora de geomagnetismo no Observat´orio Nacional (MCT).