FAMILY PLANNING SERVICES IN THE UNITED STATES1
Leo Morris, M.P.H.2
The United States has made real progress in recent years toward the goal of providing family planning services for those in need. This article charts that progress, in terms of the estimated requirements of various groups and the estimated numbers served.
Introduction
Excellent progress has been made in the past five years toward achieving the Presidential goal, set in 1969, of providing family planning services for all who want but cannot afford them. Compared with less than 700,000 women served by organized family planning programs in mid-1967, 2.4 million were served during 1972, and a total of 3.2 million were served in 1973 through a network of over 4,000 report- ing clinics (I). Of these 3.2 million women, 2.5 million were active contraceptive users at the end of the year, as compared with 2.0 million at the end of 1972. As of November 1974,3.0 million active contraceptive users were enrolled (-a
The increased number of persons served is largely attributable to increased federal funding as a result of the 1967 amendments to. the Social Security Act and the Economic Opportu- nity Act, and the adoption in 1970 of the Family Planning Services and Population Re- search Act (3). U. S. Federal Government expenditures on organized family planning ser- vices rose from some US$ll million in fiscal year 1967 to about $144 million in fiscal year 1973 (4). Over four-fifths of all these federal
lRevised version of a paper presented at the Thirty-Third Annual Meeting of the United States- Mexico Border Public Health Association held at Los Angeles, California, on 7-10 April 1975. Also appear- ing in Spanish in the Boletin de .!a Oficina Sanitaria Panamericana, Volume LXXLX, 1975.
2Family Planning Evaluation Division, Bureau of Epidemiology, Center for Disease Control, Public Health Service, U. S. Department of Health, Education and Welfare, Atlanta, Georgia.
dollars spent on organized family planning services have been in the form of direct grants to family planning projects, and less than one-fifth have consisted of indirect payments authorized under the Social Security Act in the form of reimbursements. It is also estimated that another $35 million was spent in fiscal 1973 on organized programs sponsored by state and local governments and private agencies.
Unwanted Marital Fertility in the United States
When the so-called postwar “baby boom” reached its peak in the 1950’s, the crude birth rate in the United States was 24.0 per 1,000 population, the highest level recorded since the early 1920’s. After 1957 the crude birth rate declined, and in 1973 it reached the record low of 14.9 per 1,000, which was nearly 5 per cent below the rate of 15.6 registered in 1972 (see Figure 1) (5). However, provisional data for
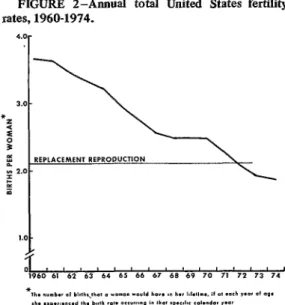
1974 show a registered birth rate of 15 .O births per 1,000, indicating no further decline (6). Since 1972, fertility rates have fallen to a level slightly below replacement reproduction, the recorded total fertility rates being 2.0 births per woman in 1972 and 1.9 births per woman in 1973, as compared with 2.3 in 1971 (see Figure 2).
Still, the problem of unwanted births has not necessarily been overcome. While the crude birth rate in the United States was only 18 per 1,000 in 1970, the National Fertility Study of that year revealed that 15 per cent of the births to married women between 1966 and 1970 were unwanted, and that 27 per cent of all
Morris . FAMILY PLANNING IN THE UNITED STATES I25
FIGURE 1 -Annual crude United States birth rates, 1960-1974.
9
births to low-income women were unwanted at the time of conception, as compared to 12 per cent of all births to higher-income women (7). Thus, even with very low fertility, unwanted childbearing does occur and can be a significant problem to population groups without access to family planning services.
The same study revealed that U.S. married couples wanted fewer children and were inore successful in limiting offspring to the number they wanted than were similar couples inter- viewed in 1965. Moreover, from the fust half of the 1960’s to the second, the rate of unwanted fertility among married women (defined as unwanted births per thousand woman-years of exposure to the risk of unwanted births) was reduced by more than one-third, from 55 to 35.
Estimates of Program Coverage
One of the major objectives of the Family Planning Services and Population Research Act enacted in 1970 was to help make comprehen- sive family planning services readily available to all persons desiring such services, priority being given to furnishing these services to persons from low-income families (8). The aim of doing this was toprevent unwanted pregnancies, there- by enabling individuals to have the number of children they want, when and if they want them.
How do family planning figures relate to the number of low-income women at risk of un- wanted pregnancy? A procedure for estimating the number of low-income women at risk of unwanted pregnancy, known as the “Dryfoos
FIGURE 2-Annual total United
FIGURE 2-Annual total United States fertility rates, 1960-1974.
rates, 1960-1974. 4.0r
formula,” has been developed by Joy Dryfoos of the Center for Family Planning Program Development (9). The estimates are worked out on the basis of findings by the 1965 and 1970 National Fertility Studies, the Current Popula-
tion Surveys of 1970 and 1972, and the Johns Hopkins Study of Adolescent Sexuality, Con- traception, and Pregnancy. These sources pro- vide estimates of fecundity, sexual activity, fertility expectations, and time occupied by pregnancy or the attempt to conceive for all women of childbearing age-in terms of each woman’s particular age group, marital status, and economic situation.
To determine the number of women needing family planning services, the total number of women of childbearing age (1544) is reduced by the number not exposed to a risk of unwanted pregnancy. This means subtracting the number of those presumed sterile, sexually inactive, or wishing to become pregnant. That is, those needing family planning services-
defined as contraception, sterilization, and in- fertility services, with appropriate support and informational activities-include all fecund women of childbearing age who are sexually active and who are not pregnant or seeking pregnancy.
126 PAHO BULLETIN . Vol. IX, No. 2, 1975
cates that an estimated 58 per cent of the women of reproductive age from low-income families (at or below 150 per cent of the Federal Poverty Index) need subsidized year- round family planning services. This would mean that during 1973 about 5.7 million low-income women needed these services. A study by Corey (I) estimates that 2.3 million of the 3.2 million women served by organized family planning programs that year were in this low-income group, That would represent 40 per cent of the estimated 5.7 million women in this socioeconomic group who were at risk of unwanted pregnancy in 1973. In addition, it is estimated that 1.3 million low-income women were served by private physicians (10). Thus, 3.6 million women, almost two-thirds of all low-income women at risk of unwanted preg- nancy, were receiving family planning services that year.
What were the demographic characteristics of this group? Data available for 2.1 million female patients, including 1 .O million new patients, served by public family planning clinics in calendar year 1973 show that 76 per cent of all new contraceptive acceptors chose oral contraceptives and 10 per cent selected the intrauterine device as their method of choice (4). Prior to enrollment in the program, 47 per cent of these women were not using contracep- tion or were using less effective methods. Forty-three per cent of them were 15 to 19 years old and 47 per cent were 20 to 29 years old, the periods of highest fertility. Women with no living children or only one child accounted for 75 per cent of those receiving services, while women with five children or more accounted for less than 4 per cent. Overall, 50 per cent of the women served had never been married, and fully 80 per cent of the teenagers had never been married.
Teenage Coverage
This profile of youth and low parity shows that as total fertility in the United States decreases, certain issues of teenage female fertility are coming more sharply into focus.
For example, out-of-wedlock birth rates among teenage females, which have been increasing over the past five decades, rose from 15.3 per 1,000 in 1960 to 22.4 per 1,000 in 1970 (II). In 1973, 13 per cent of all live births and 35 per cent of all births to girls 19 or younger occurred out-of-wedlock (5). Furthermore, studies have shown that between 42 and 60 per cent of the infants born to married mothers in this age group were premaritally conceived (12-13). Also, 30 per cent of the legal abortions reported for 1972 were performed on women 15 to 19 years of age (14). Medical problems related to teenage pregnancies, including greater risk of premature birth and fetal and infant mortality, have been well-documented (15-l 7).
The Johns Hopkins Study of Adolescent Sexuality, Contraception, and Pregnancy pro- vides the only nationwide data on unwanted
fertility among never-married women (18). These data indicate that only 20 per cent of premarital first pregnancies were intended by women in the 15-19 age group who were not married at the time of pregnancy outcome. For those women in the same group who were married at the time of pregnancy outcome, almost one-half of the premarital first pregnan- cies were intended. For both groups, it is important to note that approximately 85 per cent of the women did not use contraception at the time of their unwanted conception (19). With fertility since 1972 below replacement reproduction, it is becoming increasingly appar- ent that a large amount of unwanted fertility in the United States may be attributable to unwed teenagers.
Mom’s . FAMILY PLANNING IN THE UNITED STATES 127
it appears that between 41 and 69 per cent of the unwed teenage need was met in 1973.
Conclusions
The National Fertility Study of 1970 found that the three most effective means of contra- ception (oral contraceptives, intrauterine de- vices, and sterilization) accounted for 58 per cent of the contraception practiced in the United States in 1970, as compared to only 37 per cent in 1965. The study also showed that by 1970 low-income couples had almost reached the level of contraceptive protection enjoyed by higher-income couples. Westoff (12) has cited this “modernization of contraceptive practice” as a major factor in the fertility decline in the United States, as well as a factor contributing to the decrease in unwanted fertili- ty among low-income groups that is attributed in large measure to the efforts of public and private family planning programs. This study showed that between 1966 and 1970 there was a 36 per cent decrease in ail unwanted pregnan- cies and a substantial 55 per cent decrease among low-income couples. We now await the results of the 1973 National Survey of Family
Growth to see if the significant growth in public family planning services of the early 1970’s has prompted a further decline in unwanted pregnancies.
Jaffe has prepared preliminary estimates of short-term benefit/cost ratios associated with the federal family plating program in the United States (3). His study shows that for every hundred dollars the Federal Government invested in family planning from 1967 through 1971, between $180 and $250 in Government expenditure was saved during the following year alone. These savings reflected only the short-term costs of maternity and pediatric care which would have been -required for the un- wanted births averted by the program and the costs of public assistance associated with such births. This is regarded as a conservative mini- mum estimate, since there were also long-term savings-including the major personal health and social benefits resulting from prevention of unwanted births. It is noteworthy that four- fifths of the monetary savings cited were associated with medical care costs and only one-fifth with public assistance costs. In princi- ple, of course, these medical savings could be used to help finance other urgent health and social programs.
SUMMARY
In recent years the United States has made at the time.
considerable progress in providing family plan- Many programs are also seeking to meet the ring services for those in need. This does not teenage need demonstrated by very high rates mean, however, that the problems posed by of out-of-wedlock births, premarital concep- unwanted pregnancies and unwanted births tions, obstetric problems, and legal abortion have been completely overcome. demands of women 15 to 19 years of age. As of
Estimates of the number of low-income 1973, it appeared that between 1.3 and 2.2 women needing and receiving family planning million never-married teenagers were in need of services indicate that roughly 3.6 million organized family planning services, and that of women at risk of an unwanted pregnancy were
receiving family planning services in 1973. This these, services were being received by between 25 and 42 per cent. represented almost two-thirds of those in need
REFERENCES
128 PAHO BULLETIN . Vol. IX, No. 2, I975
(3) Jaffe, F. S. Short-term costs and benefits of the U.S. family planning program. Studies in Family Planning 5 (3): 98-105, 1974. (4) Shultz, C. S., and M. L. Martin. Direct and
indirect financing of family planning pro- grams: Project grants and reimbursement mechanisms. Fam Plann Perspect 5 (4): 202-208, 1973.
(5) U.S. National Center for Health Statistics. Final natality statistics, 1973. Monthly Vital Statis- tics Report 23 (11): Supplement, 1975. (6) U.S. National Center for Health Statistics. Births,
marriages, divorces, and deaths for 1974.
Monthly Vital Statistics Report 23 (12): 1975.
(7) Westoff, C.F., and N.G. Ryder. Wanted and unwanted fertility in the U.S. In: Demo- graphic and Social Aspects of Population Growth, Volume I, edited by C.F. Westoff and R. Parke, p. 467. U.S. Government Printing Office, Washington, D.C., 1972.
(8) U.S. Public Law 91-572, S. 2108, 24 December 1970.
(9) Dryfoos, J.G. A formula for the 1970’s: Esti- mating need for subsidized family planning services in the United States. Fam Plann Perspect 5 (3): 145-174,1973.
(10) Okada, L. M., and G. Sparer. Need for publicly financed family planning services as measured by 7 area surveys. Fam Plann Perspect 6 (1): 44-50, 1974.
(II) Cutright, P. Illegitimacy in the United States, 1920-1968. In: Demographic and Social As- pects of Population Growth, Volume I, edited by C. F. Westoff and R. Parke, pp. 375438. U.S. Government Printing Office, Washington, D.C., 1972.
(12) U.S. National Center for Health Statistics. Inter- val between first marriage and legitimate first births, U.S., 1964-66. Monthly Vital Statistics
Report 18 (12): Supplement, March 1970. (13) Whelan, E.M. Illegitimate and premaritally con-
ceived first births in Massachusetts, 1966-68.
Sot Biol 19: 9-28, 1972.
(I#) United States Center for Disease Control. Abor- tion Surveillance, 1973. Atlanta, Georgia, May 1975.
(15) Wright, N. H. Adolescent Pregnancy: Health and Social Implications. Paper presented at the annual meeting of the American Public Health Association held in Atlantic City, New Jersey, in November 1972.
(16) Wallace, H. M., H. Goldstein, V. Eisner, and A. C. Oglesby. Patterns of infant and early childhood mortality in the California project of a collaborative Inter-American study. BUN Pan Am Health Org 9 (1): 32-38, 1975. (17) Menken, J. A. Teenage childbearing: Its medical
aspects and implications for the U.S. popula- tion. In: Demographic and Social Aspects of Population Growth, Volume I, edited by C. F. Westoff and R. Parke, pp. 333-353. U.S. Government Printing Office, Washington, D.C., 1972.
(1%) Zelnik, M., and J. F. Kantner. Sexuality, contra- ception, and pregnancy among young unwed females in the United States. In: Demographic and Social Aspects of Population Growth,
Volume I, edited by C. F. Westoff and R. Parke, p. 355. U.S. Government Printing Office, Washington, D.C., 1972.
(19) Zelnik, M., and J. F. Kantner. The resolution of teenage fist pregnancies. Fam Plann Perspect 6 (2): 74-80, 1974.
(20) Morris, L. Estimating the need for family plan- ning services among young unwed females.
Fam Plann Perspect 6 (2): 91-97, 1974. (21) Westoff, C. F. The modernization of U.S. contra-
ceptive practice. Fam Plann Perspect 4 (3):