1DTP Laboratorios, Buenos Aires, Argentina. E-mail: [email protected], [email protected], [email protected],
2Instituto de Geocronología y Geología Isotópica Universidad de Buenos Aires, Buenos Aires, Argentina. E-mail: [email protected] 3CAPSA, Vicente Lopez. Buenos Aires, Argentina. E-mail: [email protected]
*Corresponding author.
Manuscript ID: 20150001. Received: 05/29/2015. Approved: 03/03/2016. ABSTRACT:In order to enhance the knowledge of shale objectives from Vaca Muerta and Los Molles Formations in the Neuquén Basin, Argentina, chemostratigraphic and mud gas carbon isotope analyses were performed in two wells from Agua del Cajón and Salitral oilields (ADC-1016 and NqSa-1148). Geochemical data show restricted levels in both cases to perforate and produce. In ADC-1016 well, Lower Los Molles Formation looks like the most suitable play to be produced. At El Salitral oilield (NqSa-1148), the best remarkable Vaca Muerta-Quintuco objectives are associated with authigenic elements, in limited horizons. Enhancement of the Quintuco reser-voir by deep circulating luids (thermobaric reserreser-voir) is suggested. Carbon isotope analysis reveals complex processes that afected the gas composition. Addition of microbial methane, biodegradation of ethane-propane and mixing of gases has been recognized. Isoto-pe reversals and presumed water reforming of hydrocarbons have been registered associated with overpressure for Lower Los Molles Formation in the ADC-1016 well, which is pointed out as the most promising shale play in the area. Vaca Muerta gases at Agua del Cajon ADC- 1016 well are associated with the homonymous source. El Salitral 1148 well shows that primary isotope composition in gases from Vaca Muerta shale play and Quintuco reservoir could be asso-ciated with a Lower Los Molles source, an aloctonous charge related with the main structures of the area.
KEYWORDS: Neuquén Basin; Carbon isotopes; Reversal; Natural gas.
RESUMO: A im de aumentar o conhecimento dos objetivos do shale gas das Formações Vaca Muerta e Los Molles, na Bacia Neuquén, Argentina, foram realizadas análise quimioestratigráicas e dos isótopos do carbono em mud gas correspondentes a dois poços dos campos petrolíferos Agua del Cajón e Salitral (ADC-1016 e NqSa-1148). Os dados geoquímicos mostraram níveis restritos em ambos os casos para perfurar e produzir. No poço ADC-1016, a Formação Los Molles inferior aparece como a mais adequada a ser produzida. No campo petrolífero El Salitral (NqSa-1148), os objetivos mais notáveis nas Formações Vaca Muerta-Quin-tuco estão associados a elementos autigênicos, em horizontes limitados. É sugerida a melhora do reservatório Quintuco por luidos da origem profunda (reservatório termobárico). A análise dos isótopos do carbono revela processos complexos que afetaram a composição do gás. A adição de metano microbiano, biodegradação de etano-propano e mistura de gases foi reconhecida. As reversões dos isótopos e suposta reforma dos hi-drocarburos por água foram registradas em associação à sobrepressão para a Formação Los Molles inferior no poço ADC-1016, o que é assinalada como a locação do objetivo mais promissor da área. Os gases da Formação Vaca Muerta em Agua del Cajón estão associados com a fonte homônima. O poço El Salitral 1148 mostra que a composição isotópica primária em gases da Formação Vaca Muerta e o reservatório Quintuco podem ser associados com a fonte da Formação Los Molles inferior, uma carga alóctona relacionada com as principais estruturas da área.
PALAVRAS-CHAVE: Bacia Neuquén; Isótopos de carbono; Inversão; Gás natural.
Shale gas plays, Neuquén Basin,
Argentina: chemostratigraphy and mud gas
carbon isotopes insights
Análise quimioestratigráica e dos isótopos do carbono em mud gas
aplicados à exploração do shale gas, Bacia Neuquén, Argentina
Héctor Adolfo Ostera1,2*, Roberto García3, Daniel Malizia1,
Pablo Kokot1, Leonel Wainstein1, Marcelo Ricciutti1
INTRODUCTION
Natural gas demand has pushed the exploitation of shale gas accumulations in Argentina, where the most promising sources are in the Neuquén Basin. Knowledge of sources and operating processes are critical in order to understand and evaluate the resources. Inorganic geochemistry and molecular–isotopic characterization of gases on source rocks are key tools for a better comprehension, focusing on exploration objectives and evaluation of their poten-tial for gas generation.
In order to characterize and identify sources of gas in deep and shallow wells looking for shale plays at the Huincul Dorsal, a pilot project to analyze the geo-chemistry of cutting and mud gas isotope compositions was carried out in two wells from Agua del Cajón and El Salitral oilfields. Samples from different levels and objectives were processed to identify the most promis-ing horizons in a deep well (ADC-1016, Agua del Cajón oilfield, Los Molles shale objective) and in a shallow well (NqSa-1148, El Salitral oilfield, Vaca Muerta-Quintuco shale objective).
GEOLOGICAL SETTING
The Neuquén basin is located in west-central Argentina, on the eastern side of the Andes. It extends along Neuquén, southern Mendoza, southwest La Pampa and northern Río Negro provinces. It is a triangular shaped
basin of approximately 125,000 km2, bounded on the
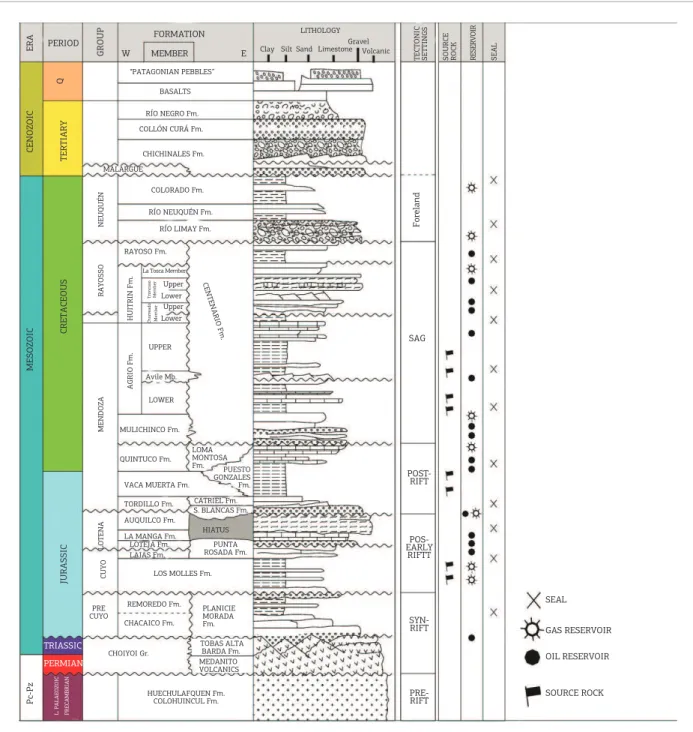
west by the Andean folded belt and partially controlled on the south by a major east-west trending wrench fault (Huincul Dorsal, Fig. 1). The generalized stratigraphic column is shown in Figure 2. Numerous references can be cited, and we select a few of them, which summarizes the main geological features. Early contributions were: Bodenbender (1889), Keidel (1913), Windhausen (1914), Keidel (1925), Groeber (1929, 1938) and Weaver (1931). Many others deserve a citation, but we select Stipanicic (1969), Rolleri (1978), Digregorio (1979), Ploskiewicz
et al. (1984), Legarreta & Gulisano (1989), Uliana & Legarreta (1993), Gulisano & Gutierrez Plemling (1994), Ramos (1978), Urien & Zambrano (1994), Vergani
et al. (1995), Veiga et al. (2005), Ramos et al. (2011),
Mosquera et al. (2011).
SCALE 100
66° 67°
35°
36°
37°
38°
39°
40°
68° 69°
70° 71°
REFERENCES SURFACE STRUCTURE DEPOSITIONAL HIGH DEPOSITIONAL TROUGH STRUCTURAL HIGH REVERSE FAULT BASIN LIMIT OIL FIELDS FOLD & THRUST BELT WELL LOCATION
SUB
SURF
A
CE
0 25 50
N
Piedra del Aguila
Nequen Basin location, main structures
and oilfields
Sedimentation in the basin started during Late Triassic and it was strongly controlled by the extensional rift-ing. In Late Jurassic-Early Cretaceous, the basin went through a period of back-arc subsidence associated with the evolution of a magmatic arc along the western margin of Gondwana. Clastic deposits include alluvial, fluvial, shallow-marine, deltaic and lacustrine sediments while the transition to more regional subsidence during Early Jurassic times resulted in shallow-marine facies (Veiga
et al. 2005).
During Late Cretaceous, the Neuquén region was a ret-ro-arcforeland basin, thick units of post-orogenic red beds were deposited and towards the end of the Cretaceous conti-nental sedimentation was widespread. he sedimentary sec-tion was subsequently covered by discontinuous Cenozoic sediments, which were afected by the Andean deformation. he tectonic movements of Jurassic and Paleogene age cre-ated many structural traps, which, with the presence of very important stratigraphic traps, have controlled the commer-cial accumulations of oil and gas in the basin.
E R A CE N O ZO IC M E SO ZO IC P c-Pz PERIOD Q TE R TI A R Y CR E TA CE O U S JU R A SS IC TRIASSIC PERMIAN L. P A LA EO ZO IC PR E CA M B R IA N G R O U P MALARGÜE N E U Q U É N R A Y O SS O M E N D O ZA CENTENARIO F m. LO TE N A CU Y O PRE CUYO TOBAS ALTA BARDA Fm. MEDANITO VOLCANICS FORMATION MEMBER “PATAGONIAN PEBBLES” BASALTS
RÍO NEGRO Fm.
COLLÓN CURÁ Fm.
CHICHINALES Fm.
COLORADO Fm.
RÍO NEUQUÉN Fm.
RÍO LIMAY Fm.
RAYOSO Fm. H U IT R IN Fm
. La Tosca Member
Tr on co so M em be r Lower Ch or re ad o M em be r A G R IO F m . UPPER Avile Mb. LOWER MULICHINCO Fm. LOMA MONTOSA Fm. PUESTO GONZALES Fm. CATRIEL Fm. S. BLANCAS Fm.
HIATUS PUNTA ROSADA Fm. LAJAS Fm.
LOS MOLLES Fm.
REMOREDO Fm. PLANICIE MORADA Fm. HUECHULAFQUEN Fm. COLOHUINCUL Fm. LITHOLOGY Volcanic TE CTO N IC SE TTI N G S Fo re la n d SAG POST-RIFT POS-EARLY RIFTT SYN-RIFT PRE-RIFT SO U R CE R O CK RE SE RV O IR SE A L SEAL GAS RESERVOIR OIL RESERVOIR SOURCE ROCK W E Upper Lower Upper QUINTUCO Fm.
VACA MUERTA Fm.
TORDILLO Fm.
AUQUILCO Fm.
LA MANGA Fm. LOTEJA Fm.
CHOIYOI Gr. CHACAICO Fm.
Clay Silt Sand LimestoneGravel
he sedimentary ill of the Neuquén Basin encompasses marine and no-marine siliciclastic, carbonates and evaporites.
he Jurassic sandstones of the Lotena, Punta Rosada, Tordillo and Sierras Blancas Formations, together with the Late Jurassic-Early Cretaceous limestones in the Quintuco and Loma Montosa Formations, are the main reservoirs with commercial value.
he black shales of Los Molles, Vaca Muerta and Agrio Formations are very proliic source rocks for oil,
conden-sate and gas throughout the basin (Cruz et al. 1999, 2002,
Villar et al. 2005).
Average depth of reservoirs is between 2,000 and 2,900 m below the surface. Average oil gravity varies between 29.5 and 33.2º API.
he black shales of Los Molles Formation (which could reach thickness of over 1,000 m) were deposited during the Early Jurassic marine transgression. he total organic cabon (TOC) of these shales varies between 1 and 6%. he kero-gen type is II and III. he petrographic analysis of kerokero-gen suggest that it is a mixture of marine and terrestrial organic matter, gas/oil prone. he thermal maturity of this formation varies according to its position in the basin. In general, for an intermediate position in the basin, its lower part could be over mature, while its upper part could still be within the oil window.
Vaca Muerta Formation consists of basinal marine black shales, shelf marine sandstones, marls and limestones with a bituminous section in its lower part. TOC varies from 3 to 8%, vitrinite relectance (%) from 0.8 to 2, hydrogen Index 400 – 800 mg HC/g TOC; the kerogen type is I-II and IIS in marginal areas (Legarreta & Villar 2011). From the values found in diferent parts of the basin, the thermal maturity of this formation is located within the oil window, except near the depocenter of the basin.
he Mulichinco Formation is stratigraphically above Vaca Muerta Formation and consists of distal shelf black shales, limestones and sandstones. TOC values vary between 1.3 and 2.4%, and the kerogen is Type II. hermal matu-rity varies, depending on its position in the basin, between immature and over mature.
The Agrio Formation is divided in two members. he Lower Member has two intervals with black shales. he lower one is associated with the Vaca Muerta-Mulichinco hydrocarbon system, while the upper one would form an independent hydrocarbon system, associated with the Avilé Member as reservoir. he black shales of the Lower Member of the Agrio Formation are characterized as very good source rocks. he kerogen is Type II, of marine bacterial-algae ori-gin, deposited in an anoxic environment, with minor terres-trial organic matter supply. he TOC values vary between 1 and 3.5%. Average values of HI and OI are 200 mg HC/g
TOC and 20 mg CO2/g TOC. hermal maturity varies,
changing with the location in the basin, from immature to mature (late oil stage).
he Upper Member of the Agrio Formation is a poten-tial source rock. It is formed of bituminous black shales and minor limestones of marine shelf environment. TOC values vary between 1 and 2%, with peaks up to 3.5%. he organic matter is amorphous, sapropelic, of algae origin, with minor terrestrial inluence (kerogen type II to II-III). HI and OI
values are 100 – 300 mg HC/g TOC and 27 mg CO2/g
TOC. hermal maturity varies from mature to immature (0.6 – 0.8 % Ro).
Numerous shale intervals, in almost all levels of the Jurassic, Cretaceous and Tertiary sedimentary section, are eicient seals, together with the evaporitic levels of the upper part of the Tábanos, Auquilco, Huitrin and Rayoso megasequences.
In several ields, the unconformities at the base of some of the megasequences also act as seals. Some seals can be normal, and reverse faults generated during Middle and Upper Tertiary times. On the other hand, in other ields, the seal is provided by variations in the permeability within the same formation.
A large variety of traps occur in the Neuquén basin: struc-tural, stratigraphic and a combination of both. Over 50% of the commercial oil discovered in the basin was trapped in stratigraphic or combined traps. Presently, it can be said that most of the structures have already been drilled. Some of the largest ields, like Loma La Lata, are stratigraphic traps, and there are other localities that could potentially be favorable for this type of traps, like the area at the south of the Colorado River, and south and north of the Huincul
Dorsal. (Pangaro et al. 2002, 2006). Magmatism has played
a sometimes disregarded key role in the basin evolution and oil generation, but for the studied wells the inluence of vol-canic activity is not considered relevant.
METHODOLOGY
analyzed for molecular composition at DTP Laboratories by Gas chromatography – Flame ionization detector (GC-FID). Carbon isotopes were measured by Geoisochem Laboratories using GC-IRMS standard techniques. Carbon isotopic com-positions of molecular organic compounds are reported relative to Vienna - Peedee Belemnite (V-PDB) standard. Precision for individual components in the molecular analysis
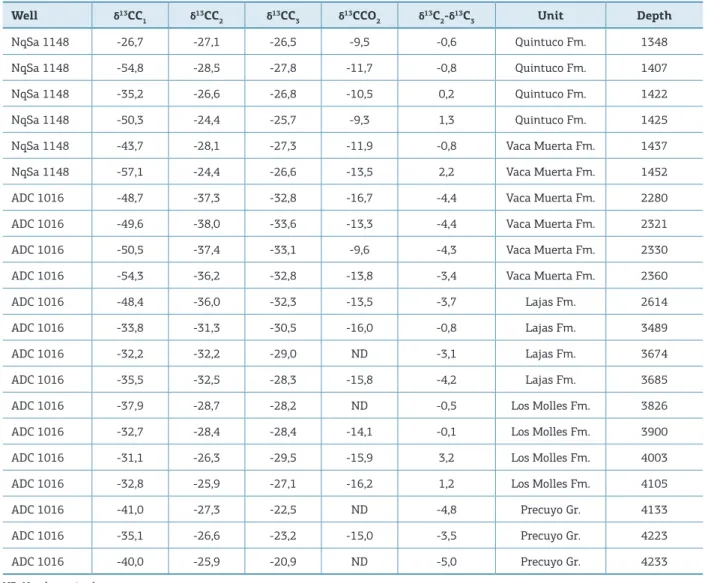
are ±2% and ±0.1‰ for δ13C. Results are shown in Table 1
and Table 2 for both molecular – isotope analysis. XRF data can be requested to the authors, due to the sampling inter-val and number of analysis involved (>400).
DISCUSSION
Inorganic geochemistry
In the last decades, inorganic geochemical data have been shown that bulk rock geochemical data can provide
chemostratigraphic correlation and can be linked with other parameters like total organic cabon, brittleness, redox conditions and 3D modeling of petrophysical parameters, which are critical to constrain reservoir characteristics (i.e.:
Ratclife et al. 2006, Pearce et al. 1999, 2010, Hildred et al.
2011). he ability to identify the most promising and rich-est (perforating) zones within the shale is derived from the geochemical data to mineralogy, and it is possible for shale objectives to estimate real reserves on a more conident and correlatable basis.
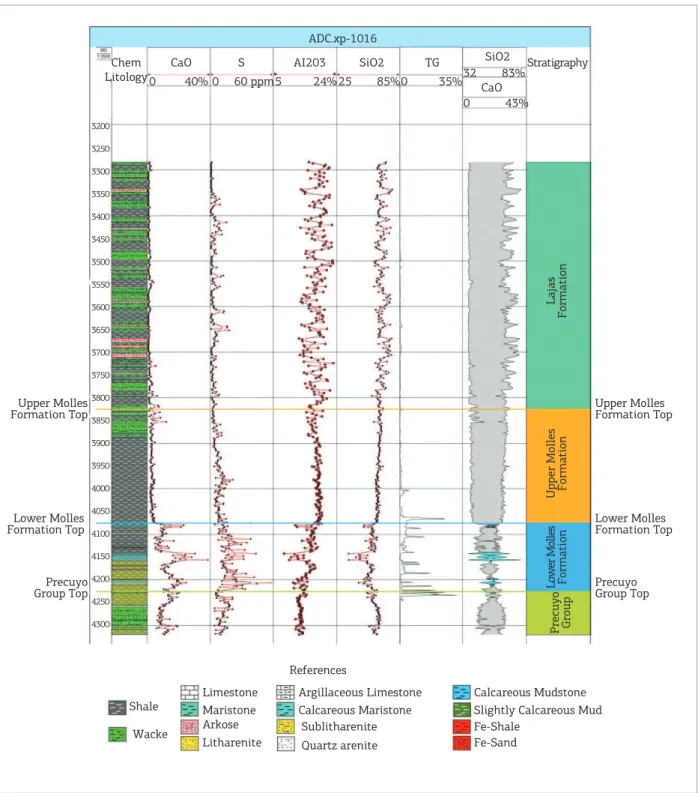
Agua del Cajon oilfield – ADC-1016 Well
In this site, the interval Precuyo-Lajas Formation was sampled, with emphasis in the source rock. We will sum-marize the obtained information, focusing in the objec-tives of the pilot test. he section, represented in Figure 3,
shows the variation of SiO2, Al2O3 and CaO. Lithology is
deduced from chemical analysis, after Herron (1988) and
Spalletti et al. (2014).
Table 1. Isotope analysis.
Well δ13CC
1 δ
13CC
2 δ
13CC
3 δ
13CCO
2 δ
13C
2-δ
13C
3 Unit Depth
NqSa 1148 -26,7 -27,1 -26,5 -9,5 -0,6 Quintuco Fm. 1348
NqSa 1148 -54,8 -28,5 -27,8 -11,7 -0,8 Quintuco Fm. 1407
NqSa 1148 -35,2 -26,6 -26,8 -10,5 0,2 Quintuco Fm. 1422
NqSa 1148 -50,3 -24,4 -25,7 -9,3 1,3 Quintuco Fm. 1425
NqSa 1148 -43,7 -28,1 -27,3 -11,9 -0,8 Vaca Muerta Fm. 1437
NqSa 1148 -57,1 -24,4 -26,6 -13,5 2,2 Vaca Muerta Fm. 1452
ADC 1016 -48,7 -37,3 -32,8 -16,7 -4,4 Vaca Muerta Fm. 2280
ADC 1016 -49,6 -38,0 -33,6 -13,3 -4,4 Vaca Muerta Fm. 2321
ADC 1016 -50,5 -37,4 -33,1 -9,6 -4,3 Vaca Muerta Fm. 2330
ADC 1016 -54,3 -36,2 -32,8 -13,8 -3,4 Vaca Muerta Fm. 2360
ADC 1016 -48,4 -36,0 -32,3 -13,5 -3,7 Lajas Fm. 2614
ADC 1016 -33,8 -31,3 -30,5 -16,0 -0,8 Lajas Fm. 3489
ADC 1016 -32,2 -32,2 -29,0 ND -3,1 Lajas Fm. 3674
ADC 1016 -35,5 -32,5 -28,3 -15,8 -4,2 Lajas Fm. 3685
ADC 1016 -37,9 -28,7 -28,2 ND -0,5 Los Molles Fm. 3826
ADC 1016 -32,7 -28,4 -28,4 -14,1 -0,1 Los Molles Fm. 3900
ADC 1016 -31,1 -26,3 -29,5 -15,9 3,2 Los Molles Fm. 4003
ADC 1016 -32,8 -25,9 -27,1 -16,2 1,2 Los Molles Fm. 4105
ADC 1016 -41,0 -27,3 -22,5 ND -4,8 Precuyo Gr. 4133
ADC 1016 -35,1 -26,6 -23,2 -15,0 -3,5 Precuyo Gr. 4223
ADC 1016 -40,0 -25,9 -20,9 ND -5,0 Precuyo Gr. 4233
Table 2. Molecular analysis (GC-FID).
Well C1% C2% C3% iC4% nC4% iC5% nC5%
NqSa 1148 64,0 8,5 8,8 2,7 6,9 3,5 5,6 100,00
NqSa 1148 66,2 7,3 9,2 2,2 7,7 2,7 4,7 100,00
NqSa 1148 72,7 6,0 6,9 1,9 6,2 2,4 4,0 100,00
NqSa 1148 74,6 7,6 6,1 1,6 4,6 2,1 3,4 100,00
NqSa 1148 47,4 11,4 14,4 3,6 13,7 3,1 6,4 100,00
NqSa 1148 73,7 6,5 6,6 1,9 5,3 2,5 3,7 100,00
ADC 1016 74,2 12,0 7,8 1,0 3,2 0,7 1,2 100,00
ADC 1016 72,7 12,8 8,3 1,0 3,4 0,6 1,2 100,00
ADC 1016 69,9 13,5 9,4 1,2 3,9 0,8 1,4 100,00
ADC 1016 71,6 12,7 8,4 1,1 3,8 0,8 1,5 100,00
ADC 1016 79,4 12,2 6,0 0,7 1,4 0,2 0,2 100,00
ADC 1016 58,3 21,5 12,9 2,8 4,5 <q.l. <q.l. 100,00
ADC 1016 96,4 2,7 0,5 0,2 0,1 <q.l. <q.l. 100,00
ADC 1016 53,3 18,5 17,0 2,9 8,2 <q.l. <q.l. 100,00
ADC 1016 97,2 2,2 0,3 0,2 0,1 <q.l. <q.l. 100,00
ADC 1016 96,2 3,0 0,5 0,2 0,1 <q.l. <q.l. 100,00
ADC 1016 97,6 2,0 0,3 0,1 0,1 <q.l. <q.l. 100,00
ADC 1016 73,5 23,6 2,0 0,3 0,7 <q.l. <q.l. 100,00
ADC 1016 97,7 1,9 0,2 0,1 0,0 <q.l. <q.l. 100,00
ADC 1016 98,1 1,6 0,2 0,1 0,0 <q.l. <q.l. 100,00
ADC 1016 98,6 1,2 0,1 0,0 0,0 <q.l. <q.l. 100,00
Well C1/C2 C1/C2+C3 C2/C3 i/nC4 i/nC5 C2/iC4 Unit Depth (m)
NqSa 1148 7,53 3,70 0,97 0,40 0,63 3,10 Quintuco Fm. 1348
NqSa 1148 9,05 4,01 0,80 0,28 0,58 3,35 Quintuco Fm. 1407
NqSa 1148 12,10 5,66 0,88 0,31 0,60 3,17 Quintuco Fm. 1422
NqSa 1148 9,85 5,44 1,23 0,35 0,61 4,75 Quintuco Fm. 1425
NqSa 1148 4,17 1,84 0,79 0,26 0,48 3,18 Vaca Muerta Fm. 1437
NqSa 1148 11,39 5,65 0,99 0,35 0,67 3,47 Vaca Muerta Fm. 1452
ADC 1016 6,21 3,76 1,54 0,32 0,57 11,81 Vaca Muerta Fm. 2280
ADC 1016 5,69 3,44 1,53 0,28 0,55 13,20 Vaca Muerta Fm. 2321
ADC 1016 5,17 3,05 1,44 0,30 0,55 11,70 Vaca Muerta Fm. 2330
ADC 1016 5,64 3,39 1,51 0,28 0,51 11,96 Vaca Muerta Fm. 2360
ADC 1016 6,53 4,38 2,03 0,49 0,86 18,37 Lajas Fm. 2614
ADC 1016 2,71 1,69 1,66 0,62 N/D 7,67 Lajas Fm. 3489
ADC 1016 35,35 29,65 5,20 2,00 N/D 13,00 Lajas Fm. 3674
ADC 1016 2,88 1,50 1,09 0,35 N/D 6,34 Lajas Fm. 3685
ADC 1016 45,18 38,93 6,22 1,67 N/D 11,20 Los Molles Fm. 3826
ADC 1016 31,96 27,62 6,36 1,42 N/D 15,96 Los Molles Fm. 3900
ADC 1016 49,71 43,65 7,21 1,37 N/D 20,15 Los Molles Fm. 4003
ADC 1016 3,11 2,87 12,03 0,40 N/D 88,18 Los Molles Fm. 4105
ADC 1016 50,93 45,39 8,19 3,14 N/D 19,73 Precuyo Gr. 4133
ADC 1016 62,02 56,06 9,41 1,15 N/D 28,61 Precuyo Gr. 4223
ADC.xp-1016
Chem
Litology CaO
CaO
S AI203 SiO2 TG SiO2 Stratigraphy
40%
0 0 60 ppm 24% 85% 35% 83%
43%
Lajas
Form
at
io
n
Upper Molles Formation Top
3200
3250
3300
3350
3400
3450
3500
3550
3600
3650
3700
3750
3800
3850
3900
3950
4000
4050
4100
4150
4200
4250
4300
U
pper
M
olle
s
Form
at
ion
Lower Molles Formation Top
Lo
w
er
M
ol
le
s
Form
at
ion
Prec
uy
o
Group
Precuyo Group Top
Upper Molles Formation Top
Lower Molles Formation Top
Precuyo Group Top
Shale
Wacke
Limestone Argillaceous Limestone
Calcareous Maristone Maristone
Calcareous Mudstone Slightly Calcareous Mud
Arkose Sublitharenite Fe-Shale
Litharenite Quartz arenite Fe-Sand
5 25 0 32
0
References
Figure 3. Well ADC-1016. Chemostratigraphic logs (major elements), Total mud gas and formations. Chemostratigraphic analysis relects a clear contrast
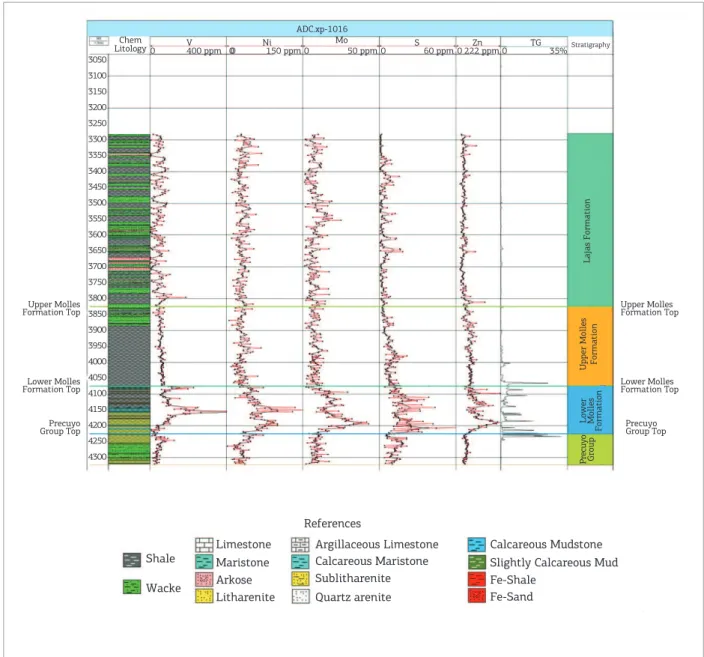
between the Precuyo Unit and Los Molles Formation. he contrast can be determined by main inlexions not only in major elements as Si and Al but also in Mo, Zn, V and Ni (Fig. 4). In Los Molles Formation, two chemostratigraphic units are clearly distinguished: Lower Los Molles Formation (LLM) and Upper Los Molles Formation (ULM, Fig. 4). Change in the content in authigenic elements like Mo,
and overpressure is detected in LLM. Figure 4 shows the enrichment in authigenic elements like Mo and Zn, asso-ciated with total gas peaks. In our criteria, it is a irst order correlation at least for Lower Molles and shows the most promising producing levels. Precuyo units (PC) and ULM also show gas peaks, but they are no associated with geo-chemical anomalies.
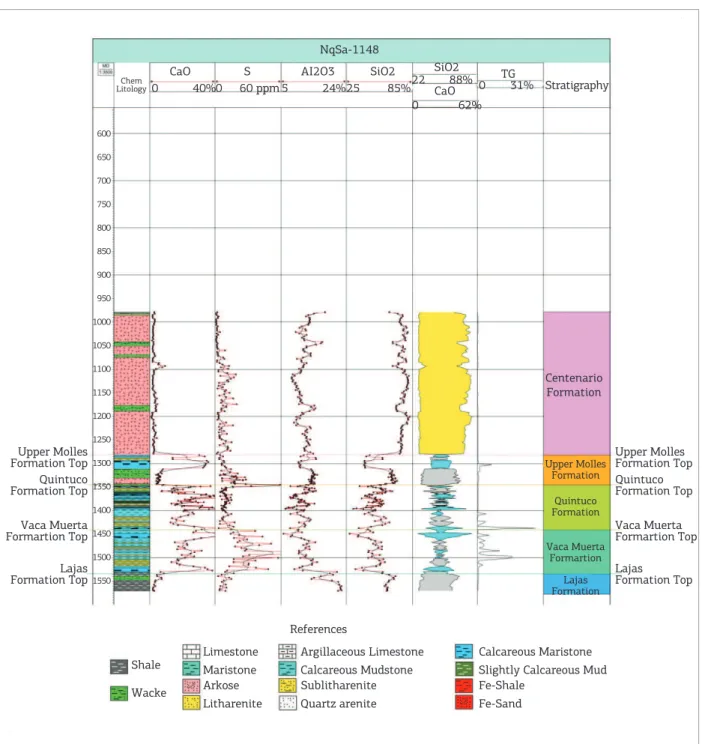
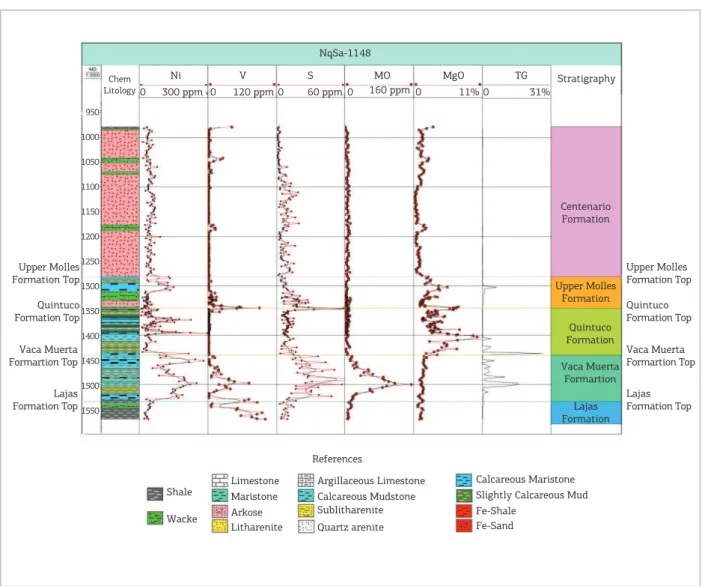
El Salitral oilfield –NqSa-1148
NqSa-1148 is a shallow well, and, in this case, the geochemical and isotope analysis were focused in the pre-sumed source rock (Vaca Muerta Formation) and reser-voir (Quintuco Formation.). Additional geochemical data from lower (Lajas Formation.) and upper units (Centenario Formation) were also considered.
For Vaca Muerta Formation, chemolithology suggests the alternance of shales and calcareous mudstones, relect-ing the transgressive character of the unit. The section showed in Figures 5 and 6 relects increasing anomalies in authigenic elements like Mo, associated with euxinic lev-els. Accompanying anomalies in Ni, V and S relect the transition between anoxic-oxic conditions in a timescale
detectable by the data (Tribovillard et al. 2006). Quintuco
Formation, limited by an inlexion in S and V values, shows the higher contents of calcium, with remarkable positive magnesium anomalies in the middle of the section assigned to dolomite replacement. Maximum total gas contents are associated with Mo maximum for Vaca Muerta Formation and Mg maximum in the case of Quintuco Fm. We suggest that the latter case could be related with deep luids ascent,
ADC.xp-1016 Chem
Litology0 V400 ppm 00 Ni150 ppm0 Mo50 ppm0 S60 ppm0222 ppmZn 0 TG 35%Stratigraphy
Lajas
F
orm
at
io
n
Upper Molles Formation Top
U
pper
M
olle
s
Form
at
ion
Lower Molles Formation Top
Low
er
M
olles
Form
at
ion
Pr
ec
uy
o
Group
Precuyo Group Top Upper Molles
Formation Top
Lower Molles Formation Top
Precuyo Group Top
Shale
Wacke
Limestone Argillaceous Limestone
Calcareous Maristone Maristone
Calcareous Mudstone Slightly Calcareous Mud
Arkose Sublitharenite Fe-Shale
Litharenite Quartz arenite Fe-Sand
3050 3100 3150 3200 3250 3300 3350 3400 3450 3500 3550 3600 3650 3700 3750 3800 3850 3900 3950 4000 4050 4100 4150 4200 4250 4300
References
replacement and circulation (thermobaric reservoir?), due to the evidences of limited reservoir enhancement observed in near wells. Centenario Fm. displays a marked increment in siliciclastic components, with higher values of Si and Al, except for a short Ca-rich interval at the base.
Carbon isotopes
During the late XX century, the geochemistry of natural gas has received attention from diferent empirical and theo-retical points of view and has supported important advances
(Stahl 1973, Schoell 1980, 1983, James 1983, Chung et al.
1988, Clayton 1991, Behar et al. 1992, Berner et al. 1995,
Tang & Schaufer 1994, Whiticar 1994, Tang & Jenden
1995, Rooney et al. 1995, Price & Schoell 1995, Lorant
et al. 1998, Tang et al. 2000, Prinzhofer et al. 2000, Zhang 2013). Most data relect a sequence of decreasing carbon
isotopic compositions from methane δ13Cto butane δ13C.
However, since many years ago, isotope reversals were detected
in deep wells (Jenden et al. 1993, Laughrey & Baldassare
1998, Wavrek et al. 1999, Hechem et al. 2003, Burruss &
Ryder 2003), and diferent explanations have been suggested to be theoretically possible, including gas mixing, abiotic
600
650
700
750
800
850
900
950
1000
1050
1100
1150
1200
1250
1300
1350
1400
1450
1500
1550
NqSa-1148
Chem Litology
CaO
CaO
S AI2O3 SiO2 SiO2 TG
Stratigraphy
0 40%0 60 ppm 5 24%25 85%22 88%
0 62%
0 31%
Centenario Formation
Upper Molles
Formation Top Upper Molles
Formation Quintuco
Formation Top
Quintuco Formation
Vaca Muerta Formartion Vaca Muerta
Formartion Top
Lajas Formation Lajas
Formation Top
Upper Molles Formation Top Quintuco Formation Top
Vaca Muerta Formartion Top
Lajas Formation Top
Shale
Wacke
Limestone Argillaceous Limestone Calcareous Maristone
Maristone Calcareous Mudstone Slightly Calcareous Mud
Arkose Sublitharenite Fe-Shale
Litharenite Quartz arenite Fe-Sand
References
sources, diferent levels of maturity, Rayleigh fractionation, late stage generation of methane and a combination of all or part of these processes (James & Burns 1984, Krouse 1988,
Chung et al. 1988, Jarvie et al. 2007, Prinzhofer 2008, Behar
et al. 2010, Burrus & Laughrey 2010, Schoell 2011, Tilley & Muehlenbachs 2013). hese data have contributed to evaluate new and not well known resources.
Carbon isotopes were interpreted on the basis of well-known graphic plots. In the Schoell plot (Fig. 7) it is visi-ble that all gases can be classiied as thermogenic gases with variable degrees of maturity, mixing with biogenic gases and secondary processes like bacterial oxidation. Bernard plot (Fig. 8) identiies those gases associated with Vaca Muerta and Los Molles sources in both wells. Some anomalies on
heavy isotopes (δ13CC
1) in gases from Lajas Formation,
Quintuco Formation and Los Molles Formation shown in the Bernard Diagram could be explained as product of oxi-dation. Vaca Muerta and Los Molles source rocks gener-ate gas that must be classiied as wet, and Los Molles gases
950
1000
1050
1100
1150
1200
1250
1300
1350
1400
1450
1500
1550
NqSa-1148
Chem Litology
Ni V S MO MgO TG Stratigraphy
0 300 ppm 0 120 ppm 0 60 ppm 0 160 ppm 0 11% 0 31%
Centenario Formation
Upper Molles
Formation Top Upper Molles
Formation Quintuco
Formation Top
Quintuco Formation
Vaca Muerta Formartion Vaca Muerta
Formartion Top
Lajas Formation Lajas
Formation Top
Upper Molles Formation Top
Quintuco Formation Top
Vaca Muerta Formartion Top
Lajas Formation Top
Shale
Wacke
Limestone Argillaceous Limestone Calcareous Maristone
Maristone Calcareous Mudstone Slightly Calcareous Mud
Arkose Sublitharenite Fe-Shale
Litharenite Quartz arenite Fe-Sand
References
are drier than the Vaca Muerta ones. Precuyo gases in the Bernard Diagram are close to LM gases, associated with a kerogen Type II trend.
he normal trend in the Whiticar diagram (Fig. 9) is deined by the solid line that can also be related for vitrinite relectance equivalence; also is useful to determine the reason
for the diferent anomalies. In the δ13CC
1 –δ 13CC
2 diagram,
it can be recognized the bacterial methane contribution for gases from Quintuco Formation, Vaca Muerta Formation (NqSa-1148, ADC-1016), Lajas Formation (NqSa-1148) and Precuyo (ADC-1016), and the existence of methane oxidation for most samples of Lajas Formation, Los Molles Formation and Precuyo (ADC-1016). Only one sample of Quintuco Formation is in the methane oxidation ield for Nq-SA 1148 ield.
he δ13CC
2 – δ 13CC
3 diagram (Fig. 10), less sensitive
to the bacterial contribution, relects the existence of bio-degradation for PC samples and thermogenic gas mixing in the case of ADC-1016 well (Los Molles) and Sa 1148 well
(Vaca Muerta and Quintuco Formations). he samples dis-play evidence of mixing of either thermogenic or microbial gas. In spite of microbial addition of methane, microbial
consumption of C2 and C3 and mixing of gases, as a irst
approach, the Whiticar line can give us an idea of thermal maturity shown as vitrinite relectance. he data is in agree-ment with the presumed thermal history for the diferent units at the Huincul Dorsal.
It is necessary to make a distinction between gas erated from primary cracking of kerogen from those gen-erated by the secondary cracking of crude oil or secondary
gas cracking (in situ reservoir process). he premise of the
Lorant et al. (1998) plot is that the ethane/propane ratio
remains constant during primary cracking, whereas it increases rapidly during secondary cracking. Ethane minus propane carbon isotopes tend towards zero with increasing
C2% 0 -75 -65 -55 -45 -35 -25 5 10 1452 1407
1425 2280 2330 2321 2314 1437 4133 3825 4223
4223 1422 3685 3489 4105 3900
3674
2360
15 20 25 30
Biogenic
Mixed gas
Non-associated gas from
sapropelic O.M
Gas associated with oil
Gas associated with condensate
Non-associated gas from humic O.M
VM 1148 δ 13CC 1 VM 1016 Lajas 1016 Molles 1016 PC 1016 Q 1148
Figure 7. Schoell plot. Key: VM: Vaca Muerta Fm.; Lajas: Lajas Fm.; Molles: Los Molles Fm.; PC: Precuyo Group; Q: Quintuco. 1016: ADC-1016 well; 1148: El Salitral 1148 well. Numbers: MD.
δ13CC
2
-40 -38 -36 -34 -32 -30
3674 3489 3685 3900 4003 1348 4105 4223 1422 3826 1437 4133 4233 1425 1452 1407 2614 2280 0.7 0.9 1.1 1.3 1.5 1.8 2.0 2.5 3.0 2330 2321 2360 Bacterial methane Gas mixing or methane oxidation
-28 -26 -24 -22 -20
-20 -30 -35 -40 -45 -50 -55 -60 δ 13 CC 1 %Ro Whiticar Q 1148 VM 1148 VM 1016 Lajas 1016 Molles 1016 PC 1016
Bacterial field C1/C2+C3
Migration
Oxidati on
%Ro
Type I I ker
ogen
Thermogenic Field
Type I II k
erogen
Mixing
δ13CC 4
Q 1148
VM 1148B VM 1016Molles 1016 PC 1016Lajas 1016
10000
1000
100
10
1 -100 -90 -80 -70 -60 -50
1452 1407
1425
2360 233023212280 2614 1437 1422 1348 4105 3489 3685 3900 3674 4003 4223 3826 4233 4133
-40 -30 -20
d13CC1
Figure 8. Bernard plot. Key: VM: Vaca Muerta Fm.; Lajas: Lajas Fm.; Molles: Los Molles Fm.; PC: Precuyo Group; Q: Quintuco. 1016: ADC-1016 well; 1148: El Salitral 1148 well. Numbers: MD.
Figure 9. Whiticar plot. Key: VM: Vaca Muerta Fm.; Lajas: Lajas Fm.; Molles: Los Molles Fm.; PC: Precuyo Group; Q: Quintuco. 1016: ADC-1016 well; 1148: El Salitral 1148 well. Numbers: MD.
δ13CC
2 -20 -22 -24 -26 -28 -30 -32 -34 -36 -38 4233 2.5 2.0 1.8 1.5 1.3 3685 3674 3489 2614 2280 2330 2321 2360 4003 3900 1348 1422 4105 1437 1407 3826 1452 1425 1.1 0.9 0.7 4133 4223 -40 -10 -15 -20 -25 -30 -35 -40 δ13 CC 3 Thermogenic gas mixing Bacterial gas mixing
Biodegradation Ro % Whiticar Q 1148 VM 1148 VM 1016 Lajas 1016 Molles 1016 PC 1016
maturity in primary cracking, but it is not the case for sec-ondary cracking of oil. Figure 11 relects that most samples from de Sa 1148 well (VM and Q) can be associated with a primary cracking, together with VM gases of ADC-1016. Los Molles gases are located far from a normal trend, sug-gesting the existence of oil cracking and residual oil as source. Precuyo gases show evidences of secondary cracking of gas, and all samples are close together.
he pattern of C1-C3 carbon isotopes (Natural gas plot
or Chung Plot) for gas analysis on samples from ADC-1016 well, corresponding to LLM, ULM, PC, LF and Vaca Muerta (VM) units is shown in Figure 12. All the groups can be identiied and characterized. Precuyo Group gases show the
most enriched values on δ13CC
2 and δ
13CC
3, with variable
contributions of biogenic methane. he intersections with the Y-axis indicate anomalous high values, and this can be related with the origin of PC gases. Deeper and over pres-surized part of Los Molles Formation shows isotope rever-sals in 4003 – 4118 depths. his is the irst time (at least, published) that these reversals are found in the Huincul Dorsal, associated with an over pressurized section. his fact has been detected in other shale prospects from Northern Hemisphere and also recognized in Vaca Muerta shale wells
(DTP Labs, unpub.). Usually, these anomalies accompany
the most productive wells, and this is a case that conirms the rule. Overpressure and associated increase in tempera-ture are linked to secondary cracking and isotope reversal
0.00 10.00
4233 4223 4133 3674
3826 4.00
-1.00
-6.00
-11.00
-16.00
3900
4105 4003
1452 1425 1422
1348 1407
1437 3489 2360 2614 3685
233022802321 Primary cracking
Primary cracking of NOS
Secondary cracking of oil
Secondary cracking of gas
Inc reas
ing V Req
C
d13CC2-d13CC3
2/C3
Q 1148 VM 1148
VM 1016 Molles 1016
PC 1016 Lajas 1016
Figure 11. Lorant et al. plot, 1998. Key: VM: Vaca
Muerta Fm.; Lajas: Lajas Fm.; Molles: Los Molles Fm.; PC: Precuyo Group; Q: Quintuco. 1016: ADC-1016 well; 1148: El Salitral 1148 well. Numbers: MD.
δ13CC 3
{
{
{{
δ13CC
2 δ13CC1
-20
-25
-25
-30
-35
-40
-45
-50
-55
-60 Precuyo
group
Los Molles Fm.
Vaca Muerta Fm.
Increasing depth
ADC - 1016 2280 ADC - 1016 2321 ADC - 1016 2330 ADC - 1016 2360 ADC - 1016 2614 ADC - 1016 3489 ADC - 1016 3674 ADC - 1016 3685 ADC - 1016 3826 ADC - 1016 3900 ADC - 1016 4003 ADC - 1016 4105 ADC - 1016 4133 ADC - 1016 4223 ADC - 1016 4233
Figure 12. Natural gas plot (Chung Plot) for ADC-1016 well, with potential sources.
(Zumberge et al. 2009, 2012), process that results in the
presence of a “reservoir” illed with dry gas (Chatellier et al.
2011). Water-reforming of high-mature organic matter cou-pled with Fischer-Tropsch process is a possible mechanism for shale gas generation, as suggested by Tang & Xia (2010a,b). his is also consistent with the isotope reversal detected.
he existence of processes like hydrocarbon reforming and water participation suggested by Tang & Xia (óp.cit.)
and Zumberge et al. (2012) can explain the δ13C
enrich-ment trend associated with C2% diminution that can be seen
in Figure 13. he δ13CCO
2 become heavier until 7.6% C2
and then reverses to more negative values. his observation
δ
13CC
2
Quintuco Fm. 1148 Vaca Muerta Fm. 1148 Vaca Muerta Fm. 1016 Lajas Fm. 1016 Los Molles Fm. 1016 Precuyo Gr. 1016 Curve Fit 0
-2
-4
-6
-8
-10
-12
-14
-16
-18
0 5 10 15
C2%
20 25
Figure 13. Correlation between δ13CCO
2 – C2%. Sample
could be linked with Tang & Xia (óp.cit.) two stage reaction
scheme, involving H2 and CO2 by water reforming in the
irst step. Data on isotope composition of co-produced shale water and maturity in the Neuquén basin show a variation trend compatible with this process (Ostera, unpub. data).
ULM presents less enriched carbon isotope
compo-sitions, although reach almost equal values for C2 and
C3. Lajas Formation presents a less evolved trend. As a
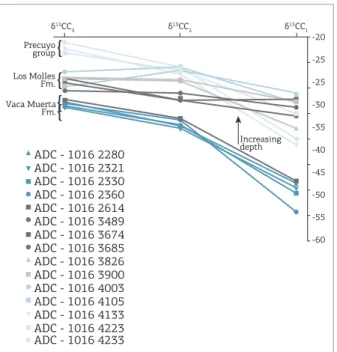
whole, LMF and LF present similar compositions, indicating Los Molles source for the sampled interval 3489 – 4105 md. However, a sample belonging from 2614 md shows a clear contribution from VM source, which has been sampled at interval 2280 – 2360 md. In this case, the com-position relects a contribution of biogenic methane and an evolution in accordance with the registered thermal matu-rity for VM in the area and the probable characteristics of the source rock.
From the same well, Isotope composition of Los Molles Formation is, as it could be expected, very diferent from Vaca Muerta source. Gas analysis from levels 2280 – 2360 md relect that Vaca Muerta gases show lower matu-rity compared with Los Molles Fm. In both cases, isotope analysis adjust to theoretical calculated evolution by iso-tope modeling, although with limitation for Los Molles gases, which in our opinion relect the process complexity (oil cracking) and supply and mixing of more mature gases added to Lower Los Molles from deeper sources (Fig. 14). Extreme values are shown in Precuyo Unit. In such case,
we propose the possibility of an evolved source rock, with associate gas cracking.
For Sa-1148 well, data on carbon isotopes for Vaca Muerta and Quintuco Formations relect a marked increase
on C2-C3 isotope ratios compared with the ADC-1016 well
data, and a relevant biogenic contribution (Fig. 12). Shale gas
Figure 14. Theoretical isotope evolution and gas analysis for Vaca Muerta Kerogen and Los Molles Kerogen in the
Huincul Dorsal at well location δ13CC
2- δ
13CC
3. Modelled using GOR-Isotopes™ sotware, accumulated gas.
δ
13CC
2
δ13CC 3
-20 -22 -24 -26 -28 -30 -32 -34 -36 -38 -40 -42 -44 -46 -48 -50
-43 -43 -41 -40 -39 -38 -37 -36 -35 -34 -33 -32 -31 -30 -29 -28
0.2 0.8 1.3 1.9 2.5 3.0 3.6 %RO
-27 -26 -25 -24 -23
ADC - 1016 - Precuyo Group ADC - 1016 - Vaca Muerta Formation ADC - 1016 - Lajas Formation ADC - 1016 - Los Molles Formation Nq.SA - 1148 - Vaca Muerta Formation
Los Molles Kerogen
Vaca Muerta Kerogen
δ13CC 3
{
{
{
{
δ13CC
2 δ13CC1
-20
-25
-25
-30
-35
-40
-45
-50
-55
-60 Precuyo
Group ADC-1016 Quintuco Vaca Muerta Fm. NqSa-1148 Los Molles Fm. ADC-1016 Vaca Muerta Fm ADC-1016
NqSa -1148 1407 NqSa -1148 1422 NqSa -1148 1425 NqSa -1148 1437 NqSa -1148 1452 ADC -1016 2321 ADC -1016 2330 ADC -1016 3826 ADC -1016 3900 ADC -1016 4223 ADC -1016 4233
plays use to have heavier compositions, due to the diferen-tial adsorption of isotopes on organic matter. Shale gas from Vaca Muerta (DTP unpub. data) typically is enriched in
13C and many times shows isotope reversals. However, this
efect alone is not considered responsible of isotope compo-sitions. he pattern of isotope evolution can be linked with another source rock (Los Molles Fm.), recharging the reser-voirs and overwhelming and overprinting the gas content of Vaca Muerta Formation, due the overlapping of values shown in Figure 15. Although other interpretation could be possible, in this case, we think that gas coming from Los Molles Formation through main structures related with the Huincul Dorsal could be the ultimate source for this gas. Such source agrees with the theoretical evolution shown in Figure 14. his assumption is in accordance with struc-tural, geophysical and geological evidences, which relect the existence of deep structures in the Huincul Dorsal with the ability to act as migration pathways for gases coming from more evolved source rocks. Detected vertical migration pathways, which represent expulsion of primary gas from Los Molles source rock, have been identiied by shallow gas clouds. his gas migrates through the relatively low matu-rity Vaca Muerta oil prone source, causing expulsion of oil from Vaca Muerta (Conolly & Garcia 2010) and giving this particular isotopic ingerprint.
CONCLUSIONS
Geochemical study of ADC-1016 and Sa-1148 at the Huincul Dorsal led to the recognition of the main
formational units and revealed that shale objectives have restricted levels in order to perforate and produce. In the case of Los Molles shale play (well ADC-1016), only Lower Los Molles Formation seems to have appropriate condi-tions to be produced. At El Salitral oilield (Sa-1148 well), the most interesting Vaca Muerta - Quintuco objectives are associated with authigenic elements. hey have also delimited horizons at the shale objective and reservoir. Enhancement of the Quintuco reservoir by deep circu-lating luids suggests the possibility of a thermobaric res-ervoir. Carbon isotope analysis on wells of the Huincul Dorsal (Agua del Cajon and Salitral oilields) reveals com-plex processes that afected the gas composition of shale and conventional plays. Addition of microbial methane, biodegradation of ethane-propane and mixing of gases has been recognized. Although there are evidences for deeper objectives, like Precuyo Group at Agua del Cajón oilield, the data reveal overmature conditions and gas cracking for this source on the basis of isotope compositions. Isotope reversals have been registered associated with overpres-sure for Lower Los Molles Formation in the ADC-1016 well, and water reforming is proposed on the basis of the presented evidence. his suggests that Lower Los Molles Formation could be the most promising shale play in the area. At Agua del Cajon ADC-1016 well, Vaca Muerta gases are well correlated with the accepted homonymous source. El Salitral 1148 well shows that primary isotope composition in this shale play and associated reservoirs is overwhelmed by an aloctonous charge, related with the main structures of the area and associated with a probable Lower Los Molles source.
Behar F., Kressmann S., Rudkiewicz J.L., Vandenbroucke M. 1992. Experimentalsimulation in a conined system and kinetic modelling
of kerogen and oilcracking. Organic Geochemistry, 19:173-189.
Behar F., Jarvie D., Mazeas L., Roy S., Haeseler F. 2010. Estimation of Gas Volumes in Shales Gas: Kinetic and Isotope Modeling for
Methane and Ethane Generation. AAPG Hedberg Conference,
December 5-10, 2010, Austin, Texas.
Berner U., Faber E., Scheeder G., Panten D. 1995. Primary cracking of algal and landplant kerogens: kinetic models of isotope variations
in methane, ethane and propane. Chemical Geology, (126):233-245.
Bodenbender. 1889. Expedición al Neuquén. Instituto Geográico
Argentino. Boletín nº 10:311-323. Buenos Aires.
Burruss R, Laughrey C.D. 2010.Carbon and hydrogen isotopic reversals in deep basin gas: Evidence for limits to the stability of
hydrocarbons. Organic Geochemistry, 41(12):1285-1296.
Burruss R.C., Ryder R.T. 2003. Composition of crude oil and natural gas produced from 14 wells in the Lower Silurian ‘‘Clinton” sandstone and Medina Group,northeastern Ohio and northwestern
Pennsylvania, US Geological Survey OpenFile Report, 03-409, 64 p.
Chatellier J.Y., Ferworn K., Lazreg Larsen N., Ko S., Flek. P., Molgat M., Anderson I. 2011. Overpressure in Shale Gas – When Geochemistry
and Engineering Data Meet and Agree. AAPG Hedberg Conference,
December 5-10, 2010, Austin, Texas.
Chung H.M., Gormly J.R., Squires R.M. 1988. Origin of gaseous hydrocarbons in subsurface environments: theoretical considerations of carbon isotope distribution. In: Schoell M.
(Guest-Editor). Origins of Methane in the Earth. Chemical Geology, (71
):97-103 (special issue).
Clayton C. 1991. Carbon isotope fractionation during natural gas
generation from kerogen,Marine and Petroleum Geology, 8:232-240.
Conolly D.& García R. 2010. Tracking hydrocarbon seepage in
Argentina’s Neuquén basin. World Oil:101-105.
Cruz C., Boll A., Gómez Omil R., Martínez E., Arregui C., Gulisano C., Laffitte G., Villar H. 2002. Hábitat de hidrocarburos y sistemas de carga Los Molles y Vaca Muerta en el sector central
de la cuenca neuquina. Argentina. V Congreso de Exploración y
Desarrollo de Hidrocarburos, Mar del Plata, Nov. 2002. 20 pp. IAPG. CD-ROM.
Cruz C.E., Robles F., Sylwan C., Villar H.J. 1999. Los sistemas petroleros jurásicos de la Dorsal de Huincul. Cuenca Neuquina, Argentina. IV
Congreso Exploración y Desarrollo de Hidrocarburos, Actas I:
177-195. Mar del Plata.
Digregorio J.H. & Uliana M. 1979. Cuenca Neuquina. In: Geología
Regional Argentina, Academia Nacional de Ciencias, 2:985-1032. Córdoba.
Groeber P. 1929. Lineas fundamentales de la geología del Neuquén,
sur de Mendoza y regiones adyacente. Dirección Nacional Geología y
Minería. Publicación 58:1-59. Buenos Aires, Argentina.
Groeber P. 1938. Mapa Geológico de la Gobernación del Neuquén,
Escala 1:1.000.000. Territorio Nacional del Neuquén. In: Aguas
minerales de la República Argentina. Ministerio del Interior.
Comisión Nacional de Climatología y Agricultura 12:17-31. Buenos
Aires.
Gulisano C. & Gutiérrez Pleimling A. 1994. The Jurassic of Neuquén
Basin. a) Neuquén Province. Field Guide. Secretaría de Minería de la Nación y Asociación Geológica Argentina, Serie E, Nº 2. Buenos Aires.
Hechem J., Wavrek D., Fernández M., Pángaro F., Verzi H. 2003. Gas Systems in the Central Region of Neuquén Basin, Argentina. 2003 Abstracts, AAPG Annual Meeting, Salt Lake City, Utah.
Herron M.M. 1988, Geochemical classiication oterrigenous sands
and shales from core or log data. Journal of Sedimentary Petrology,
58(5):820-829.
Hildred G., Ratclife K., Schmidt K.T. 2011. Application of Inorganic Whole-Rock Geochemistry to Shale Resource Plays: an Example
from the Eagle Ford Shale,Texas. Houston Geological Society Bulletin,
p. 31-38.
James A.T. 1983. Correlation of natural gas by use of carbon
isotopic distribution between hydrocarbon components. American
Association of Petroleum Geologists Bulletin, 67:1176-1191.
James A.T. & Burns B.J. 1984. Microbial alteration of subsurface
natural gas accumulations. American Association of Petroleum
Geologists Bulletin, 68:957-960.
Jarvie D., Hill R., Ruble T., Pollastro R. 2007. Unconventional shale-gas systems: The Mississippian Barnett Shale of north-central Texas
as one model for thermogenic shale-gas assessment. American
Association of Petroleum Geologists Bulletin, 91(4):475-499.
Jenden P.D., Drazan D.J., Kaplan I.R. 1993. Mixing of thermogenic
natural gases in northern Appalachian Basin. AAPG Bulletin, 77, pp.
980–998
Keidel J. 1913. Informe Geológico sobre el Yacimiento Petrolífero
de Challacó (Territorio del Neuquén). Dirección General de Minas, Geología e Hidrogeología.
Keidel J. 1925. Sobre la estructura geológica de las capas petrolíferas
en el oriente del Territorio del Neuquén. Dirección General de Minas,
Geología e Hidrogeología. Publicación 8:1-67. Buenos Aires.
Krouse H.R., Viau C.A., Eliuk A.L.S., Ueda S., Halas S. 1988. Chemical and isotopic evidence of thermochemical sulfate reduction by
light hydrocarbon gases in deep carbonate reservoirs, Nature,
333:415-419.
Laughrey C.D. & Baldassare F.J. 1998. Geochemistry and origin of some natural gases in the Plateau province of the central
Appalachian basin, Pennsylvania and Ohio. American Association of
Petroleum Geologists Bulletin, 82:317-335.
Legarreta L. & Gulisano C. 1989. Análisis estratigráico secuencial de la Cuenca Neuquina (Triásico Superior – Terciario Inferior). En
Chebli y Spalletti (Eds.) Cuencas Sedimentarias Argentinas. Simposio
X Congreso Geológico Argentino, 221-243. Tucumán.
Legarreta L. & Villar H. 2011. Geological and Geochemical Keys
of the Potential Shale Resources, Argentina Basins. Search and
Discovery Article #80196.
Lorant F., Prinzhofer A., Behar F., Huc A.Y. 1998. Carbon isotopic and molecular constraints on the formation and the expulsion of
thermogenic hydrocarbon gases: Chemical Geology, 147:249-264.
Mosquera A., Silvestro J., Ramos V.A., Alarcón M., Zubiri M. La estructura de la Dorsal de Huincul. In: Leanza H., Arregui C., Carbone
O., Danieli J.C., Vallés J.M. (eds). Relatorio del XVIII Congreso Geológico
Argentino. Geología y Recursos Naturales del Neuquén, 385-398.
Pángaro F., Corbera R., Carbone O., Hinterwimmer G. 2002. Los reservorios del Precuyano. In: Rocas Reservorio – Schiuma M.,
Hinterwimmer G., Vergani G., (eds). V Congreso de exploración y
desarrollo de hidrocarburos, Actas, 229-254. Mar del Plata.
Pángaro F., Melli A.T., Malone P., Cevallos M., Soraci A., Mosquera A, Kim H. 2006. Modelos de entrampamiento de la dorsal de Huincul,
Cuenca Neuquina, Argentina. Petrotecnia, abril de 2006, p. 48-88.
Pearce T.J., Besly B.M., Wray D., Wright D.K. 1999. Chemostratigraphy: a method to improve interwell correlation in barren sequences – a case study using Duckmantian/Stephanian sequences (West
Midlands, U.K.). Sedimentary Geology, 124:97-220.
Pearce T.J., Martin J.H., Cooper D., Wray D.S. 2010. Chemostratigraphy of Upper Carboniferous (Pennsylvanian). Sequences from the Southern North Sea (United Kingdom). En Application of Modern
Stratigraphic Techniques: Theory and Case Histories, SEPM Special
Publication,94:109-127.
Ploszkiewicz J.V., Orchuela I.A., Vaillard J.C., Viñes R.F. 1984. Compresión y desplazamiento lateral en la zona de la Falla Huincul: estructuras asociadas, provincia del Neuquén. 9º Congreso Geológico
Argentino, Actas,2:163:169. Buenos Aires.
Price L.C. & Schoell M. 1995. Constraints on the origins of hydrocarbon gas
from compositions of gases at their site of origin, Nature, 378: 368-371.
Prinzhofer A., Mello M.R., Takaki T. 2000. Geochemical Characterization of Natural Gas: a Physical Multivariable Approach
and its Applications in Maturity and Migration Estimates. American
Association of Petroleum Geologists Bulletin, 84(8):1152-1172.
Ramos V.A. 1978. Estructura. In: Rolleri, E.O. Geología y Recursos Naturales
del Neuquén. 7º Congreso Gelógico Argentino, Relatorio, p. 99-118.
Ramos V.A., Folguera A., García Morabito E. 2011. Las provincias geológicas del Neuquén. In: Leanza H., Arregui C., Carbone O.,
Danieli J.C., Vallés J.M. (eds) . Relatorio del XVIII Congreso Geológico
Argentino. Geología y Recursos Naturales del Neuquén. 317:326. Ratclife K.T., Hughes A.D., Lawton D.E., Wray D.S., Bessa F., Pearce T.J., Martin J. 2006. A regional chemostratigraphically deined correlation framework for the late Triassic TAG-I in Blocks 402 and
405a, Algeria. Petroleum Geoscience, 12:3-12.
Ratclife K.T., Wright A.M., Hallsworth C., Morton C., Zaitlin B.A., Potocki D., Wray D.S. 2004. Alternative correlation techniquesin the petroleum industry: an example from the (Lower Cretaceous)
Basal Quartz, Southern Alberta, American Association of Petroleum
Geologists Bulletin, 88:1419-1432.
Rolleri E.O. (ed.) 1978. Geología y Recursos Naturales del Neuquén.
7º Congreso Gelógico Argentino (Neuquén). Relatorio. Buenos Aires.
Rooney M.A., Claypool G.E., Chung H.M. 1995. Modeling thermogenic gas generation using carbon isotope ratios of natural gas
hydrocarbons, Chemical Geology, 126(3-4):219-232.
Schoell M. 2011. Carbon and Hydrogen Isotope Systematics in Thermogenic Natural Gases from the USA and China: West meets East. AAPG Hedberg Conference Natural Gas Geochemistry, Beijing,
Schoell M. 1980. The hydrogen and carbon isotopic composition
of methane from natural gases of various origins. Geochimica
Cosmochimica Acta, 44:649-661.
Schoell M. 1983. Genetic characterization of natural gases. American
Association of Petroleum Geologists Bulletin, 67(12):2225-2238.
Spalletti L.A., Schwarz E.; Veiga G.D. 2014. Geoquímica inorgánica como indicador de procedencia yambiente sedimentario en sucesiones de lutitas negras:los depósitos transgresivos titonianos
(Formación Vaca Muerta)de la Cuenca Neuquina, Argentina. Andean
Geology, 41(2):401-435.
Stahl J.W. 1973. Carbon isotope ratios of German natural gases in comparison with isotopic data of gaseous hydrocarbons from other
parts of the world. In: Tissot B. & Bienner F. (eds). Advances in
Organic Geochemistry, 453-462.
Stipanicic P.N. 1969. El avance en los conocimiento del Jurásico
argentino a partir del esquema de Groeber. Revista de la Asociación
Geológica Argentina, 24(4):367-388.
Tang Y & Xia X. 2010a. Predicting Original Gas in Place and Optimizing Productivity by Isotope Geochemistry of Shale Gas. AAPG Hedberg Conference, December 5-10, 2010, Austin, Texas.
Tang Y. & Xia X. 2010b. Kinetics and Mechanism of Shale Gas Formation: A Quantitative Interpretation of Gas Isotope “Rollover”
for Shale Gas Formation. AAPG Hedberg Conference, December 5-10,
2010, Austin, Texas.
Tang Y.C. & Jenden P.D. 1995. Theoretical Modeling of Carbon and Hydrogen Isotope Fractionation in Natural Gas. In: Grimalt J.O.
& Dorronsoro C. (eds). Organic Geochemistry, Developments and
Applications to Energy, Climate and Human History.), European Association of Organic Geochemists,: 1067–1069, A.I.G.O.A.
Tang Y.C., Perry J.K., Jenden P.D., Schoell M. 2000. Mathematical Modeling of Stable Carbon Isotope Ratios in Natural Gases. Geochimica et Cosmochimica Acta, 64(15):2673-2687.
Tang Y.C. & Staufer M. 1994. Compositional Modeling of Hydrocarbon
Generation. Advances in Organic Geochemistry, 22:863.
Tilley B. & Muehlenbachs K. 2013. Isotope reversals and universal stages and trends of gas maturation in sealed, self-contained
petroleum systems. Chemical Geology, 339(15):194-204.
Tribovillard, N., Algeo, T.J., Lyons, T.& Riboulleau, A. 2006 Trace metals as paleoredox and paleoproductivity proxies: An update. Chem. Geol. 232, 12-32.
Uliana M.A. & Legarreta L. 1993. Hydrocarbons habitat in a Triassic
to Cretaceous sub-Andean setting: Nequen Basin, Argentina. Journal
of Petroleum Geologists, 16(4):397-420.
Urien C.M. & Zambrano J.J. 1994. Petroleum systems in the Neuquén Basin, Argentina. In: Maggoon L. & Dow W. (eds.) The Petroleum
System – from source to trap. American Association of Petroleum
Geologists Memoir, 60:513-534. Tulsa.
Veiga G.D., Spalletti L., Howell J.A., Schwartz E. 2005. The Neuquén Basin: a case study in sequence stratigraphy and basin dynamics. The Geological Society Special Publication, 252:1-336. London.
Vergani G.D., Tankard A.J., Belotti H.J., Welsink H.J. 1995. Tectonic evolution and paleogeography of the Neuquén Basin, Argentina. In:
Tankard A.J., Suarez Soruco R., Welsink H.J. (eds). Petroleum Basins
of South America. American Association of Petroleum Geologists,
Memoir, 62:383-402.
Villar H.J., Legarreta L., Cruz C., Laitte G., Vergani G. 2005. Los cinco sistemas petroleros coexistentes en el sector sudeste de la Cuenca Neuquina: deinición geoquímica y comparación a lo largo de una
transecta de 150 km. VI Congreso de Exploración y Desarrollo de
Hidrocarburos, Mar del Plata, Noviembre 2005, IAPG. CD-ROM, 17 pp. Wavrek D.A., Lara M.E., Laitte G.A. 1999. Gas systems of the Loma
La Lata region, Neuquén basin, Argentina. AAPG Hedberg Conference
on Natural Gas Formation, Migration, and Occurrence, Durango, CO.
Weaver Ch. 1931. Paleontology of the Jurassic and Cretaceous of West
Central Argentina. Memoir University of Washington,1:1-469. Seattle.
Whiticar M.J. 1994. Correlation of Natural gases with their sources.
In: Magoon J. & Dow W.G. (eds.). The petroleum system- from source
to trap. American Association of Petroleum Geologists, Memoir,
60:261-283.
Windhausen A. 1914. Contribución al conocimiento geológico de
los territorios de Rio Negro y Neuquén, con un estudio de la región petrolífera de la parte central del Neuquén. (Cerro Lotena y Covunco). Ministerio de Agricultura. Sección Geología, Minería y Mineralogía.
Anales, 10(1):1-60. Buenos Aires.
Zhang Y. 2013. Natural Gas Exploration Using Carbon Isotopic Fractionation Efect: A Case Study of Shanxi Formation, Upper
Palaeozoic Group in the Center of Ordos Basin, China. International
Journal of Chemical Engineering and Applications, 4:18-20.
Zumberge J.E., Ferworn K.A., Curtis J.B. 2009. Gas character
anomalies found in highly productive shale gas wells, Geochimica et
Cosmochimica Acta, 73:A1539.
Zumberge J.E., Ferworn K, Brown S. 2012. Isotopic reversal (‘rollover’) in shale gases produced from the MississippianBarnett and
Fayetteville formations, Marine and Petroleum Geology, 31:43:52.