756 Brazilian Journal of Physics, vol. 34, no. 3A, September, 2004
Improvement of a Gaseous Position Sensitive Detector for
use in Thermal Neutron Tomographic Systems
Marcelo J. Gonc¸alves, Ricardo T. Lopes,
Universidade Federal do Rio de Janeiro, COPPECentro de Tecnologia, Bloco 6, 21945-970, Rio de Janeiro,RJ, Brazil
Maria Ines Silvani, Gevaldo L. de Almeida, and Rosanne C. A. A. Furieri
Instituto de Engenharia Nuclear, CNENC.P. 68550, Ilha do Fund˜ao, 21945-970, Rio de Janeiro, RJ, Brazil
Received on 9 September, 2003
The utilization of a position sensitive detector in tomographic systems is an attractive possibility because it is capable of furnishing the position where the ionizing event occurs. This feature can reduce significantly the image acquiring time, since a sample translation is no longer required. In this work the performance of a gaseous position sensitive detector equipping a thermal neutron tomographic system has been improved by a stepwise increase of the filling-gas (3He-enriched helium) pressure from 3 to 6 atm. Important quantitative detector parameters such as resolution, linearity and homogeneity have been measured for that pressure range, and compared with the tomographic images of test-samples. Several test-samples have been studied, all of them constituted by an aluminum cylinder containing inserts of different materials. Besides that, the modula-tion transfer funcmodula-tion-MTF for the system has been experimentally obtained and compared with the expected theoretical curve. An improvement of both detector efficiency and resolution has been observed, as theoretically expected from an increase of the filling-gas pressure.
1
Introduction
The computer assisted tomography (CAT) is based on a quantitative mapping of the absorption coefficient of a single or multiple cross-sections of an object. The map is obtained by measuring the attenuation of a radiation beam passing through the object. Assigning colors to the obtained values, 2D or 3D images are obtained, depending whether a single or several cross-sections are inspected. A tomographic sys-tem is basically constituted by a set source-detector.
The system described in this work uses the Arg-onauta reactor at the Instituto de Engenharia
Nuclear-CNEN as source of thermal neutrons, which yields a flux
of 4.5x10⁵
n.cm−2.s–1, while the radiation detection is car-ried out by a gaseous position sensitive detector operating at the proportional region. This detector has been filled up with3
He-enriched helium, for this gas exhibits several ad-vantages in the detection of thermal neutrons, such as: low conversion efficiency forγ-rays [1], large cross-section and stopping power for charged particles even for low pressures.
The interaction of thermal neutrons with3
He causes the nuclear reaction3
He (n,p)3
H. Due to the low neutron en-ergy (about 0.025 eV) the reaction products are isotropically emitted into opposite directions, with proton and tritium car-rying 573 and 191 keV respectively.
The efficiency of a gaseous detector depends on the number of ions pairs produced by each incident neutron hit-ting the detector active volume. In the formerly mentioned reaction, the proton has a range of 7.9 mm, while the
tri-tium has approximately a half of this value, for a 10 atm-pressure of3He [2]. The detector used in this work, filled up with 99%3
He-enriched helium under 3atm-pressure, has a gap of 3mm between its window and the and anode wire. Therefore, the charged particles produced in the gas would hardly loose all their energy inside the detector. The solu-tion adopted in this work to overcome this handicap was to increase the filling-gas pressure, for this would produce a higher density of ions pairs, improving hence the detection efficiency.
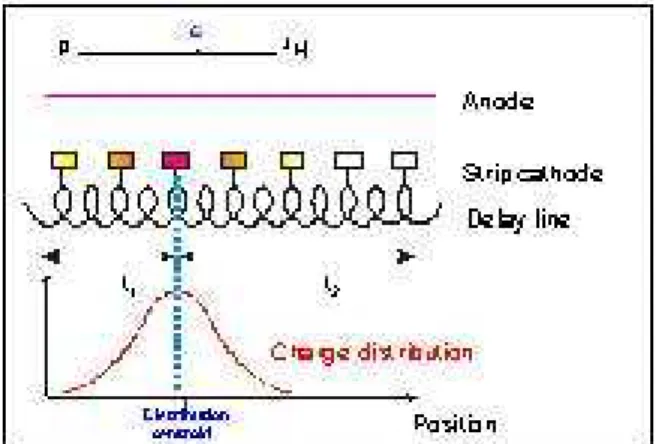
Each one of the particles arising from the nuclear re-action generates an ionization track which centroid is dis-placed from the position where the reaction actually oc-curred due to their different ranges. This displacement, e as shown in Fig. 1, degrades the detector resolution. An in-crease of the filling-gas pressure, would cause a dein-crease in the range of those particles, reducing that displacement.
To evaluate the performance of the detection system, as well as that of the detector itself, some parameters such as resolution (RES), linearity and homogeneity [3] have been measured.
Marcelo J. Gonc¸alveset al. 757
Figure 1. Resolution degradation caused by the displacement of the charge distribution centroid.
RES=pF W HM2
−∆2
where∆is the width of the incident radiation beam. The linearity expresses the deviation from a straight line of the curve relating the position where the incident radia-tion hits the detector causing the first ionizing events, and the position furnished by it.
The homogeneity evaluates the detector behavior when submitted to different counting statistics, by comparing the efficiency of its individual virtual cells.
Regarding the tomographic system, a measurable pa-rameter used to evaluate quantitatively the spatial resolution is the modulation transfer function (MTF). This curve can be obtained from the discrete Fourier Transform of the line
spread function (LSF) [4]. In other words, the MTF can
be figured out as the result of a modulation imposed to an input signal by the tomographic system, due to its variable response to different spatial frequencies [5].
Figure 2. Impact of the spatial resolution on the final response of a tomographic system.
This modulation affects the response of the detector with a direct impact on the spatial resolution of a tomographic system. This is shown in Fig. 2, where an opaque test-body provided with three apertures is exposed to a radiation field. The expected response for a real detector placed behind the test-body is a convolution of Gaussian functions represent-ing its LSF. One can observe a loss of contrast between the absorbing and non-absorbing regions. This loss depends on
the spatial frequency of the test-body and on the capability of the system to deal with it [6].
The modulation is defined as the ratio of the amplitude to the average value. It is usually agreed that a modulation be-low 10% would not produce images of an acceptable quality [4].
2
Experimental
Within the frame of this work, addressing an improvement of the image quality and a reduction of its acquiring time, the gas pressure has been increased, to improve both resolu-tion and efficiency. For this purpose, the original structure of the detector has been modified to withstand pressures in excess of 10 atm. One of these modifications included the replacement of the detector front flange containing its win-dow, by a single aluminum piece provided with a 1.7mm thick window cast on it. This new flange should assure that no deformation would take place after a pressure increase.
The parameters characterizing the tomographic system, as well as its detector, have been obtained through a proper collimation of the neutron beam using gadolinium masks fit-ted to the detector window. To assess the impact of those parameters on the quality of the final images, some tomo-graphic images of different test-bodies have been acquired.
3
Results and Discussion
After the changes in the detector filling-gas pressure, a fair improvement of its performance can be observed, as shown in Table I.
TABLE I. Detector performance under different filling-gas pressures, as experimentally measured.
Pressure Resolution Linearity Homogeneity 3
He (mm) (%) (%)
3 atm 1.70 0.9 9
4 atm 1.32 0.7 6
6 atm 1.1 0.6 6
Regarding the tomographic system, the appropriate characterization is given by the MTF curve which has been obtained by a Fourier transform of a Gaussian function taken as a LSF of the detector. The results for the system using de-tectors under different pressures are shown in Table II. TABLE II. Results inferred from a theoretical MTF obtained after a Fourier transform of the detector LSF.
Gas 3 atm 4 atm 6 atm
Pressure
758 Brazilian Journal of Physics, vol. 34, no. 3A, September, 2004
4
Tomographic images
The tomographic images taken as examples to evaluate the impact of the gas pressure on the detector resolution are shown in Fig. 3. They refer to a 22mm-diameter teflon cylin-der containing seven orifices filled up with Gd2O3. The ori-fice diameters are within the range 1-4 mm.
Figure 3. Tomographic images taken with detectors under 4 atm (left) and 6 atm (right) gas pressures.
Figure 4. Tomographic images taken with systems equipped with
3
He-filled PSD under 4 atm (left) and 6 atm (right).
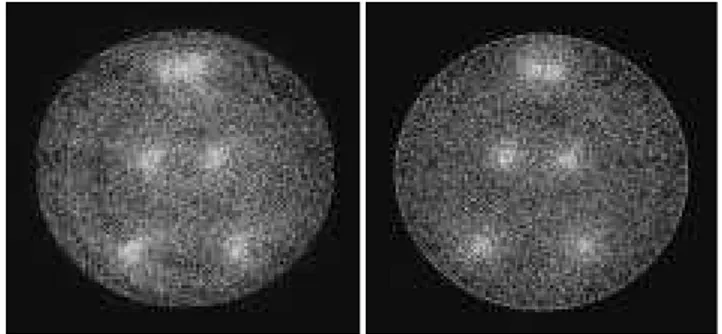
Figure 4 shows tomographic images of a 22mm-diameter aluminum cylinder provided with 3 pairs of orifices containing 1mm-diameter cadmium wires.
The gaps between the orifices for each pair are 2, 6 and 10 mm. By observing the images taken with the 4 and 6 atm systems, under a statistics of 4,000 counts/channel, one can recognize a better resolution and contrast of that acquired with a 6 atm detector.
As far as efficiency is concerned, both systems exhibit an improvement with the gas pressure, as theoretically ex-pected. Table III shows the spent time required to acquire the above mentioned images, for 90 projections and a 4,000 counts/channel statistics.
TABLE 3. Spent time demanded to achieve 4000 counts/channel using the studied systems.
Pressure 3 atm 4 atm 6 atm
Time (min) 90 70 60
5
Applications
Neutron and x-rays tomography are intrinsically comple-mentary techniques. Therefore, one can hardly replace the other, for the basic parameter which commands their po-tential and capabilities - the attenuation coefficient of the involved materials - is dictated by nature. One example where the use of x-rays tomography would fail, or at least would not present good results, while the neutron tomogra-phy would work very well, is presented in Fig. 5. The image refers to an aluminum cylinder containing orifices filled up with plastic or hydrogen-bearing materials, which thanks to their high cross-section for thermal neutrons are easily de-tected, and thus, clearly visualized in the tomographic im-age.
Figure 5. Tomographic image of an aluminum cylinder containing rods of plastic materials.
6
Conclusions
The utilization of thermal neutrons in tomographic systems produces satisfactory results, making feasible the using of this approach as a complementary technique to the non-destructive assay utilizing x-rays or gamma radiation. Fur-thermore, the incorporation of a position sensitive detec-tor to the tomographic system is an attractive and advan-tageous option because a sample or source-detector transla-tion would no longer be necessary, reducing therefore the image acquisition time. A consequent disadvantage associ-ated with the PSD, is a limitation on the maximal size of the object being analyzed, which cannot obviously exceed the detector length. In this work, this limit was 8 cm.
Marcelo J. Gonc¸alveset al. 759
References
[1] M. I. Silvani, Computer Tomography with Thermal Neutrons
and Position Sensitive Detector DSc. Thesis, COPPE/UFRJ,
Rio de Janeiro, RJ, Brazil. (2001) In Portuguese.
[2] J. Alberi, et al. Physics Research B 127, 507 (1975).
[3] A. F. Barbosa, CBPF-NF068/94, Rio de Janeiro, Brazil (1994).
[4] ASTM E 1441-95 and 1570-95a, Non-Destructive Testing,
Ra-diation Methods, Computed Tomography. Guide for Imaging
and Practice for Examination, ISO/TC 135/SC 5, N 118, USA (1996).
[5] G. L. de Almeida, M. I. Silvani, and R. T. Lopes, August 2002,
A Hybrid Technique to Evaluate the Line Spread Function. VI ENAN, E10-142, Rio de Janeiro, Brazil, (2002).
[6] M. J. Gonc¸alves, Optimization of a gaseous position
sensi-tive detector for use in a thermal neutron tomographic sys-tem. M.Sc. Thesis, COPPE / UFRJ, Rio de Janeiro, RJ, Brazil