728 Brazilian Journal of Physics, vol. 34, no. 3A, September, 2004
The Use of Gamma Ray Computed Tomography to Investigate Soil
Compaction Due to Core Sampling Devices
Luiz F. Pires, Robson C. J. Arthur, Vladia Correchel, Osny O. S. Bacchi, Klaus Reichardt,
Center for Nuclear Energy in Agriculture – CENA/USP, C.P. 96, 13.400-970, Piracicaba, SP, Braziland Rene P. Camponez do Brasil
Departament of Rural Engineering – ESALQ/USP, C.P. 9, 13.418-970, Piracicaba, SP, Brazil
Received on 8 September, 2003
Compaction processes can influence soil physical properties such as soil density, porosity, pore size distribu-tion, and processes like soil water and nutrient movements, root system distribudistribu-tion, and others. Soil porosity modification has important consequences like alterations in results of soil water retention curves. These alter-ations may cause differences in soil water storage calculalter-ations and matric potential values, which are utilized in irrigation management systems. Because of this, soil-sampling techniques should avoid alterations of sample structure. In this work soil sample compaction caused by core sampling devices was investigated using the gamma ray computed tomography technique. A first generation tomograph with fixed source-detector arrange-ment and translation/rotational movearrange-ments of the sample was utilized to obtain the images. The radioactive source is241Am, with an activity of 3.7 GBq, and the detector consists of a 3 in. x 3in. NaI(Tl) scintillation
crystal coupled to a photomultiplier tube. Soil samples were taken from an experimental field utilizing cylinders 4.0 cm high and 2.6 cm in diameter. Based on image analyses it was possible to detect compacted regions in all samples next to the cylinder wall due to the sampling system. Tomographic unit profiles of the sample permitted to identify higher values of soil density for deeper regions of the sample, and it was possible to determine the average densities and thickness of these layers. Tomographic analyses showed to be a very useful tool for soil compaction characterization and presented many advantages in relation to traditional methods.
1
Introduction
Godfrey Hounsfield in 1971 developed the first computed tomograph (CT) for clinical purposes in nuclear medicine [1] and several advances have occurred in the last decades in this scientific field. The rapid growth in all forms of CT can be attributed mainly to more sophisticated computers capa-ble to acquire and store large amounts of data, and provide a simple and straightforward means of analysis of these data. Since Hounsfield’s work, CT can be found in several areas of knowledge like chemical and petroleum engineering, soil science and others. In soil physics CT can be used for soil water movement [2, 3], soil density [4], soil structure [5, 6] and soil compaction [7, 8, 9] studies.
Soil compaction is an important parameter to identify possible modifications in the structure of soils due to an-thropogenic and natural actions [10, 11]. Soil compaction occurs when a compression process induces a decrease of the pore volume, with a consequent increase of soil density [8], causing strong modifications in soil structure and pore distribution. Compaction processes influence soil physical properties such as soil density, porosity, pore size distribu-tion, therefore affecting soil water and nutrient movements, root system distribution, heat transfer, etc. Soil porosity modification has important consequences like alterations in soil water potential and, consequently, in the soil water
re-tention curve. These alterations influence soil water storage calculations and matric potential values, which are utilized in irrigation management.
Camponez do Brasil [12], using five different soil-sampling techniques showed that these techniques disturb the soil sample structure to some extend, and his results demonstrate the occurrence of a probable soil compaction due to the sampling process. He was, however, not able to identify and quantify the regions where this compaction oc-curs in the inner part of the soil sample since he did not count with a non-destructive technique suitable to investigate the problem. Having this in mind, this work was carried out in order to try the gamma ray CT technique as a tool to eval-uate possible changes in soil structure caused by soil core sampling and to analyze the variations of soil bulk density within the soil sample volume.
2
Computed Tomography
Luiz F. Pireset al. 729
define a function f(x, y), called density function, which rep-resents the cross-sectional distribution of the physical prop-erty of interest. The main objective of the CT is to reproduce as accurately as possible this function f(x, y). For gamma ray CT f(x, y) represents the linear attenuation coefficientµ
(cm−1)of material. The line integral of the function along (r,φ)is called the sum ray or projection ray P(r,φ), given by:
P(r, φ) = Z
r,φ
f(x, y)ds (1)
whereφis the rotation angle of the (x, y) axes. This rotation of the axes can be obtained rotating the object in front of the radiation detector in fixed integer units ofφ. The term r is the object translation movement in front of the detector and radiation source.
Through the application of the Beer-Lambert law it is possible to obtain:
ln µ I0 I ¶ = Z r,φ
µ(x, y)ds (2)
where I0and I are, respectively, the rates of the incident and the emerging photon beams, µ(x, y) the linear attenuation coefficient at position (x, y), and ds a length element along the ray r. When f(x, y) is equal toµ(x, y) it is possible to obtain, through the equations (1) and (2), a complete set of sum rays for a defined angleφ, called projection. Acquiring a great number of sets of projections for different values of
φand through a computer analysis, it is possible to deter-mine and to reconstruct the function f(x, y) that provides a 2-D image of the object being submitted to the CT method [13].
3
Material and Methods
Soil samples were taken from a profile characterized as a red-yellow Latossol according to the Brazilian Soil Science Society classification, collected in an experimental field of the Department of Plant Production of ESALQ/USP, in Piracicaba, SP, Brazil (22 ˚ 4’S; 47 ˚ 38’W; 580m above sea level).
CT analysis was performed on 5 undisturbed soil sam-ples collected at soil surface using steel cylinders 4.0 cm high and 2.6 cm external diameter. The soil sampler device consists of an inox steel structure 4.2 cm high and 2.7 cm internal diameter, which permits the introduction of the alu-minum cylinder in its inner space. Through of a rubber mass falling from different heights it is possible to introduce the steel cylinder into the soil. After the removal of the excess of soil around the steel cylinder the soil sample can be used for density evaluation. In this process it is important to be care-ful with the impacts of the rubber mass to minimize effects on the structure of the soil sample.
The CT equipment consists of a first generation sys-tem with a fixed source-detector arrangement, with trans-lation/rotational movements of the sample. The radioactive gamma ray source is 241
Am with an activity of 3.7 GBq
emitting monoenergetic photons of 59.54 keV. The detec-tor is a 3 in x 3 in NaI(Tl) scintillation crystal coupled to a photomultiplier tube. Circular lead collimators of 1 mm were adjusted to both source and detector. Angular steps ofφwere 2.25 ˚ until completing a scan of 180 ˚ , with lin-ear steps r of 0.14 cm. Acquired data were stored in a PC and a reconstruction algorithm called Microvis [14] devel-oped by Embrapa Agricultural Instrumentation (CNPDIA) was used to obtain CT images. The calibration of the CT system was obtained through linear correlation between lin-ear attenuation coefficients and tomographic units (TU) of different materials [15, 16]. The tomographic images of the soil samples were taken for vertical planes crossing the cen-ter of the cylindrical sample. TU values were converted to soil density values through equation (3):
ρs=
T U
α.h³µsρs´+³µwρw´.Ui
(3)
where α represents the slope of CT calibration curve, (µs/ρs)and (µw/ρw)(cm2.g−1)are the mass attenuation co-efficients of the soil and water, respectively, and U (g.g−1) the gravimetric soil water content.
4
Results and Discussion
The value of α was 0.9233 cm and the linear re-gression coefficient of the calibration curve was 0.996. The mass attenuation coefficients for the soil and wa-ter were 0.24429±0.00250 cm2
.g−1and 0.18890±0.00018 cm2
.g−1, respectively, for the 59.54 keV photons, which are in accordance to values found in the literature.
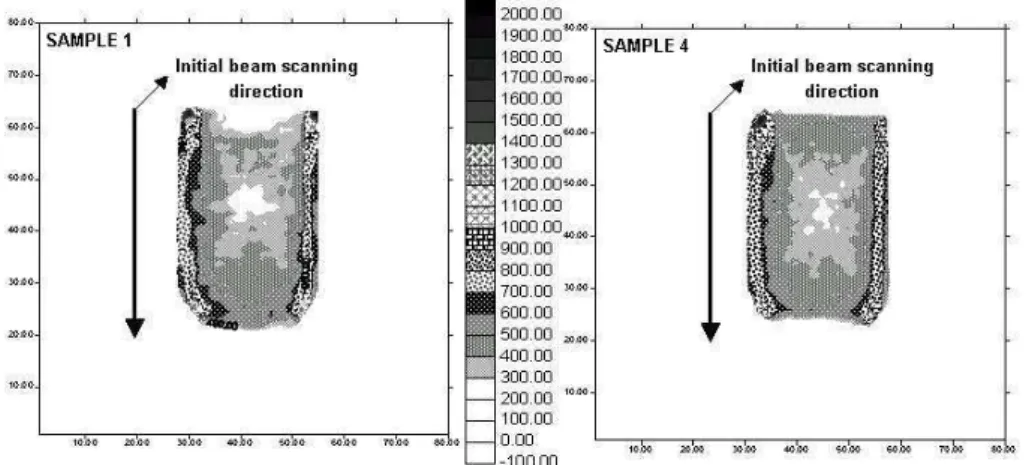
Two images of soil samples obtained by CT are shown on Fig. 1. These images represent soil samples with the same soil water content, which were collected using the de-scribed soil core sampler. The planes of image acquisition were vertical and the available data permitted a continuous analysis of the density distribution along the soil sample, in 2-D.
It can be observed through image analysis that the soil sampler induces a soil compaction next to the cylinder wall and at the bottom region of the soil sample. This can be observed by the contrast between the center, the border and the bottom of the sample indicating an increase of soil bulk density from the center to the border and bottom.
The observed compaction in the border and in the bot-tom of the soil sample can cause problems during soil wa-ter retention curve dewa-terminations if samples are used for this purpose. This compaction causes modifications in soil porosity and consequently in soil water retention character-istics. The water retention curve determined using such al-tered soil samples would not be reliable and not representa-tive of the natural soil profile in the field. A poor soil water retention curve can lead to important practical problems of water management of irrigated crops.
730 Brazilian Journal of Physics, vol. 34, no. 3A, September, 2004
Figure 1. Tomographic images of soil samples obtained through the software “Microvis” developed by EMBRAPA/CNPDIA.
Figure 2. Analysis by transect for samples 1 and 4. (A and C) Represent transects obtained along the width of soil samples 1 and 4 and (B and D) Represent transects obtained along the depth, for the same samples.
The results shown in figure 2 refer to samples 1 and 4, however the same behavior was also observed for the other samples. The analysis of transects is only possible by CT. In depth it permits to confirm the occurrence of a compaction in the bottom of the samples, which is the case of samples 1 and 4 as a consequence of soil sampling process. Hori-zontal transects confirm the occurrence of more compacted zones next to the cylinder wall due to sampling, in contrast to the natural soil bulk density found in the center zone of the sample. These differences in soil bulk density along the hor-izontal transects indicate variations in soil porosity which, consequently can lead to differences in soil water retention. A probable cause of this compaction is the small diameter of the sampling cylinders. Block diagrams of samples 1 and 4 (Fig. 3) confirm the data obtained by the horizontal transect analysis. Tomographic unit results shown in these diagrams represent TU average values of thin vertical layers of the order of 3 mm.
Figure 3. Histogram of average tomographic unit values obtained for samples 1 and 4. Areas in abscissa axis represent average TU values of thin layers of the order of 3 mm.
Soil densities obtained for sample 1 were 1.79±0.12 g.cm−3(left border), 1.89±0.11 g.cm−3(right border) and 1.43±0.06 g.cm−3 (center of soil sample). For sample 4 the values were 1.95±0.05 g.cm−3(left border), 1.96±0.06 g.cm−3(right border) and 1.59±0.06 g.cm−3(center of soil sample). In relation to compaction at the bottom of soil sam-ple the values of soil density obtained for samsam-ples 1 and 4 were 2.01±0.04 g.cm−3 and 2.07±0.05 g.cm−3. These densities are larger than those determined in not compacted regions by CT for samples 1 and 4, 1.53±0.01 g.cm−3and 1.60±0.10 g.cm−3, confirming compaction in the inferior surface of soil sample.
Acknowledgements
To FAPESP (grants no. 02/05066-5) for financial sup-port.
References
[1] G.N. Hounsfield, Br. J. Radiol.46, 1016 (1972).
[2] S. Crestana, S. Mascarenhas, and R.S. Pozzi-Mucelli, Soil Sci.140, 326 (1985).
Luiz F. Pireset al. 731
[4] A.M. Petrovic, J.E. Siebert, and P.E. Rieke, Soil Sci. Soc. Am. J.46, 445 (1982).
[5] S. Crestana, C.M.P. Vaz, Soil Till. Res.47, 19 (1998). [6] L. Farber, G. Tardos, and J.N. Michaels, Powder Techn.132,
57 (2003).
[7] R.T. Lopes, A.P. Bessa, D. Braz, and E.F.O. Jesus, Appl. Rad. Isot.50, 451 (1999).
[8] L. Fante Junior, J.C.M. Oliveira, L.H. Bassoi, C.M.P. Vaz, A. Macedo, O.O.S. Bacchi, K. Reichardt, A.C. Cavalcanti, and F.H.B.B. Silva, R. Bras. Ci. Solo.26, 835 (2002).
[9] L.F. Pires, J.R. Macedo, M.D. Souza, O.O.S. Bacchi, and K. Reichardt, Appl. Rad. Isot.59, 17 (2003).
[10] M. Pagliai, S. Rousseva, N. Vignozzi, C. Piovanelli, S. Pelle-grini, and N. Miclaus, Ital. J. Agron.2, 11 (1998).
[11] A. Marsili, P. Servadio, M. Pagliai, N. Vignozzi, Soil Till. Res.49, 185 (1998).
[12] R.P. Camponez do Brasil, “Influˆencia das t´ecnicas de co-leta de amostras na determinac¸˜ao das propriedades f´ısicas do solo”, MSc. Thesis, ESALQ/USP-Brazil 2000.
[13] G.T. Herman, 1980,Image Reconstruction from Projections, ed. 1, London, Academic Press.
[14] EMBRAPA/CNPDIA, 2000, “Microvis – Programa de Reconstruc¸˜ao e Visualizac¸˜ao de Imagens Tomogr´aficas, Guia do Usu´ario”.
[15] F.A.M. C´assaro, “Tomografia de dupla energia simultˆanea para caracterizac¸˜ao f´ısica de um meio poroso deform´avel”, MSc. Thesis, IF/USP-Brazil 1994.