ARTIGOS ARTÍCULOS ARTICLES
DIVIDEND CLIENTELE, NEW INSIGHTS, AND NEW QUESTIONS: THE BRAZILIAN CASE
CLIENTELA EM DIVIDENDOS, NOVOS ELEMENTOS E NOVAS QUESTÕES: O CASO BRASILEIRO
CLIENTELA EN DIVIDENDOS, NUEVOS ELEMENTOS Y NUEVAS CUESTIONAMIENTOS: EL CASO BRASILEIRO
Jairo Laser Procianoy
Professor da Escola de Administração, Universidade Federal do Rio Grande do Sul – RS, Brasil [email protected]
Rodrigo S. Verdi
Professor da MIT Sloan School of Management – MA, Estados Unidos [email protected]
Recebido em 27.03.2008. Aprovado em 11.08.2008. Disponibilizado em 04.03.2009 Avaliado pelo sistema double blind review
Editores Científicos: Alexandre Di Miceli da Silveira, André Luiz Carvalhal da Silva, Paulo Renato Soares Terra e Richard Saito
RAE-eletrônica, v. 8, n. 1, Art. 1, jan./jun. 2009.
http://www.rae.com.br/eletronica/index.cfm?FuseAction=Artigo&ID=5439&Secao=ARTIGOS&Volu me=8&Numero=1&Ano=2009
ABSTRACT
This paper analyzes the dividend clientele effect and the signaling hypothesis in the Brazilian stock
market between 1996 and 2000. During this period, the dividend tax was zero and the capital gains tax
varied between zero and 10%. Brazilian firms face two information regimes, which allow us to test the
signaling hypothesis. From a sample of 394 observations studied, 39% show a first ex-dividend day
stock price higher than the price on the last cum-dividend day. The market price is higher for
unanticipated dividends but, even with pre-announced dividends, stock prices are higher than the
expected level, which is inconsistent with the clientele hypothesis. We also find evidence of a positive
abnormal volume around the unanticipated dividend date, which is consistent with the signaling
hypothesis, but no abnormal trading volume around pre-announced dividend dates. Our findings are
inconsistent with the clientele hypothesis but provide support for the signaling hypothesis
KEYWORDSDividends, taxes, clientele, signaling, capital markets.
RESUMO
Este artigo analisa o efeito de clientela em dividendos e a hipótese de sinalização no mercado brasileiro
de ações entre 1996 e 2000. Neste período, a tributação sobre dividendos era nula e sobre ganhos de
capital variou entre zero e dez por cento. As firmas brasileiras enfrentam dois regimes de informação, o
que nos permite testar a hipótese de sinalização. De uma amostra com 394 observações, 39% possuem
um preço de ação maior no primeiro dia ex-dividend do que no último dia de cum-dividend. O preço de
mercado é maior para dividendos não antecipados, mas mesmo para dividendos pré-anunciados, os
preços das ações são maiores do que o esperado, o que não é coerente com a hipótese de clientela.
Também encontramos evidências de um volume de contratos positivamente anormal por volta da data
não antecipada de dividendo, o que é coerente com a hipótese de sinalização, mas não se verificou
nenhum volume de negociações anormal por volta das datas pré-anunciadas de dividendos. Nossos
resultados são inconsistentes com a hipótese de clientela, mas suportam a hipótese de sinalização.
© RAE- eletrônica - v. 8, n. 1, Art. 1, jan./jun. 2009 www.fgv.br/raeeletronica INTRODUCTION
This paper analyzes the dividend clientele effect and the signaling hypothesis in the Brazilian stock
market between 1996 and 2000. From a sample of 394 observations studied, 39% show a first
ex-dividend day stock price higher than the price on the last cum-ex-dividend day. The market price is higher
for unanticipated dividends but, even among pre-announced dividends, stock prices are higher than the
expected level, which is inconsistent with the clientele hypothesis. We also find evidence of a positive
abnormal volume around the unanticipated dividend, which is consistent with the signaling hypothesis,
but no abnormal trading volume around pre-announced dividend. Overall, our findings are inconsistent
with the clientele hypothesis but provide support for the signaling hypothesis.
Elton and Gruber (1970) were the first to test Miller and Modigliani’s hypothesis of the
existence of a clientele effect in the U.S. market. Since then several papers have studied the clientele
effect. However, very few studies on dividend clientele effects are tested in a setting with well-defined
taxation policy to test the clientele hypothesis and the varying information announcements required to
test the signaling hypothesis. Specifically, from a taxation standpoint, during the sample period we
studied, dividends were tax-exempt and capital gains were taxed at 10% – a unique setting worldwide.
From a signaling standpoint, dividends paid by Brazilian firms can be either pre-announced in a
Shareholders General Meeting (SGM), or unanticipated and decided in a Board of Directors Meeting
(BDM). Our study takes advantage of this unique institutional aspect of the Brazilian regulatory system
to provide new insights into the literature on the market reaction to dividends.
Our study has important implications for investors trading in emerging economies. Brazil has
attracted increased attention as one of the BRIC countries (Brazil, Russia, India and China). Emerging
markets have become a new frontier for international investors looking to obtain better gains.
Dividends are an important source of cash flow for long-term investors and clientele is one of the
unsolved questions on this market. Therefore, to the extent that managers and investment managers are
concerned about dividends, our study provides evidence of an inefficient price adjustment around
dividends paid by Brazilian companies.
Using an event study methodology we find that, similarly to Procianoy and Verdi (2003), stock
prices increase subsequent to the last cum-dividend day and remain at a new price level for a few days.
This demonstrates that the eventual correction is not immediate. In addition, we find evidence about a
signaling hypothesis, but we do not find abnormal trading volume around the ex-dividend date for
dividends previously announced via the SGM. Our findings remain constant throughout our entire
sample period and raises the question as to why arbitrageurs do not take advantage of this scenario and
make this mispricing disappear over time.
The next section presents the theory background. Section II presents the methodology used in
this paper. Section III describes our sample, and results are presented in section IV. The last section
presents
THEORY BACKGROUND
Dividend policy has been a topic of extensive investigation in financial economics. Miller and
Modigliani (1961) study the effect of dividend policy on company value and find that under certain
assumptions - specifically perfect capital markets, rational behavior and perfect certainty – a
company’s dividend policy should have no effect on its value. However, Miller and Modigliani (1961)
also argue that in imperfect markets, the existence of a systematic preference for stocks paying high
dividends as opposed to earning capital gains (say for tax reasons) could lead to a clientele effect in
which investors would self-select to stock of their respective preferences. In the US, due to different
taxation regimes, investors self-select into companies that provide them with the highest after-tax
cash-flow generating different clienteles for different companies.
Elton and Gruber (1970) were the first to test Miller and Modigliani’s hypothesis of the
existence of a clientele effect in the U.S. market. The clientele effect predicts that since investors are
taxed in different individual brackets, the difference between dividend taxes and capital gains taxes
would lead to clientele preference. This hypothesis states that investors who pay relatively high taxes
on dividends would prefer to acquire low dividend yielding stocks, whereas investors who pay
relatively low taxes on dividends would be interested in acquiring high dividend yielding stocks. Elton
and Gruber (1970) predict that ex-dividend stock price behavior is related to the tax rate of marginal
shareholders. In this case, in a rational market, the fall in price on the ex-dividend day reflects the value
of the dividend vis-à-vis capital gains to the marginal stockholder. From this hypothesis, they develop a
model that infers marginal stockholder tax brackets from observing the ex-dividend behavior of stock
prices. They find a positive and statistically significant relation between dividend yield and the stock
© RAE- eletrônica - v. 8, n. 1, Art. 1, jan./jun. 2009 www.fgv.br/raeeletronica
Since Elton and Gruber (1970), several papers have tested the EG model with mixed evidence
on the clientele effect (Michaely and Murgia (1995), Amihud and Murgia (1997), Frank and
Jagannathan (1998), Romon (2000), Milonas and Travlos (2001), Milonas, Travlos, Xiao and Tan
(2002), Lasfer and Zenomos (2003), Daunfeldt (2002)). More recently, Elton, Gruber and Blake (2002)
tested ex-dividend effects on a different sample aiming to “put to bed the argument about the
significance of taxes in determining the ex-dividend behavior of common stocks.”
Procianoy and Verdi (2003) contribute to this literature by studying the clientele effect for a
sample of Brazilian companies during the sample period 1989 to 1993 during which Brazilian
corporations faced a unique taxation regime in which dividends were tax-exempt whereas capital gains
were taxed (in contrast to most countries in which dividend taxes are higher than capital gains taxes).
Contrary to the clientele hypothesis, they find evidence of a price increase on the first ex-dividend day
and conclude that the clientele hypothesis is not supported by Brazilian data. The findings in Procianoy
and Verdi (2003), although interesting, are puzzling because they suggest that investors were paying
more for a stock without dividend than they were for the same stock with the right to receive the
dividend.
We investigate the clientele effect for the sample period of 1996 to 2000 in order to extend the
research in Procianoy and Verdi (2003) in several important ways. First, the sample period of 1996 to
2000 provides an out-of-sample test of the results in Procianoy and Verdi (2003) by selecting a period
in which dividends were also tax-exempt whereas capital gains were taxed. Most importantly, the
results in Procianoy and Verdi (2003) might be confounded by the information relating to dividends.
That is, given the peculiar way of announcing dividends in Brazil (described in more detail below), the
positive market reaction on the first ex-dividend day could be due to a positive signal being
communicated to the market due to the dividend announcement (see Bhattacharya (1979), John and
Williams (1985), and Miller and Rock (1985) for a description of the signaling theory of dividends).
We test this hypothesis by identifying this confounding factor and exploring the dividend
announcement to test the signaling hypothesis of dividends. Finally, we extend Procianoy and Verdi
(2003) by studying the abnormal volume around the ex-dividend date (in order to study the information
content of the dividend announcement) and by estimating a multiple regression that studies the
simultaneous factors driving the market price adjustment on the ex-dividend date.
Brazilian companies are allowed to pay dividends using two processes: a Shareholders General
Meeting (SGM) and a Board of Directors Meeting (BDM). All SGMs are called at least 8 days in
day or in the following day, the company issues a press release announcing the dividend decision. With
BDM dividends, on the other hand, there is no previous summons as prior public disclosure of the
dividend decision is not required, and any information anticipating the meeting’s decisions is limited to
insider information that is unavailable to the market. Therefore, on the last cum-dividend date, SGM
dividends are already expected whereas BDM dividends are unexpected dividends to investors. The
latter may contain a positive signal to the market (Easterbrook (1984) and Jensen (1986)). We obtain
data on the form of the dividend announcement (BDM or SGM) and test the clientele effect in the
Brazilian market after isolating the information component of the dividend. These two different
dividend announcement procedures will generate two different answers from market investors as a
result of different signaling effects.
Using a sample of 394 dividend distributions from 119 different companies that are
representative of large corporations operating in the Brazilian economy between 1996 and 2000 we
find, in line with Procianoy and Verdi (2003), that on the first ex-dividend day the actual stock price is
on average 1.8% higher than the price expected by the dividend clientele model and results in an
abnormal return of 1.5%, significant at the 1% level. Using multiple regressions, we observe a positive
and statistically significant effect of YIELD, suggesting that the shares of companies paying high
dividend yields trade at higher prices on the ex-dividend day. In addition, we also observe that
unexpected dividends have a positive effect on stock prices since dividends announced via a BDM are
priced 0.9% higher than dividends announced through an SGM (significant at the 5% level). However,
even in the case where dividends are previously announced via an SGM the stock prices are higher than
the expected level. This suggests that the findings in Procianoy and Verdi (2003) are not purely driven
by the information content of the dividends announced via a BDM.
METHODOLOGY
Clientele Model
Elton and Gruber (1970) predict that the stock price on the ex-dividend day varies as a function of the
dividend paid and the tax rates on dividends and capital gains. They argue that the fall in price on the
ex-dividend day reflects the value of the dividend vis-à-vis capital gains to the marginal stockholder.
© RAE- eletrônica - v. 8, n. 1, Art. 1, jan./jun. 2009 www.fgv.br/raeeletronica
P1 = P0 – D * (1 - Idiv) / (1 - Icapg) (1)
where P1 is the first ex-dividend stock price; P0 is the last cum-dividend stock price; D is the
dividend paid on each stock; Idiv is the dividend tax; and Icapg is the capital gains tax.
In the period under study, there were no taxes on dividends whereas capital gains were taxed at
0% for pension funds and 10% for all other investors. Therefore, stocks on their first ex-dividend day
should vary between two extreme values. The maximum theoretical price for pension fund investments
that were exempt from taxes on dividends and on capital gains should be:
P1Tmax = P0 – D (2)
For remaining investors, dividends were not taxed and capital gains were taxed at 10%. In this
case, the minimum theoretical price would be:
P1Tmin = P0 – D / 0.9 (3)
If no signal is sent to the market, then the stock price on the first ex-dividend day is expected to
remain within the following interval:
P1Tmin ≤ P1≤ P1Tmax (4)
We measure the percentage price difference between the actual stock price and the predicted
stock price. The price difference between P1 and P1Tmin is defined as follows:
PD1 = P1 / P1Tmin – 1 (5)
Similarly, the price difference between P1 and P1Tmax is defined as follows:
PD2 = P1 / P1Tmax – 1 (6)
Therefore, if ex-dividend prices are adjusted according to the clientele model, we expect
mean values to more accurately represent the average market adjustment on the ex-dividend date. In
order to avoid stock market influence in our results, we adjust stock prices on the first ex-dividend day
according to the following formula:
P1a = (Ibov0/Ibov1) * P1 (7)
where P1a is the adjusted stock price on the first ex-dividend day; Ibov0 and Ibov1 are São Paulo
Stock Exchange Indices - IBOVESPA - for the last cum-dividend day and the first ex-dividend day,
respectively; and P1 is the stock price on the first ex-dividend day. The market adjustment is consistent
with the market-adjusted-return model that we use to compute abnormal returns. This model is
equivalent to the market model with the restriction that estimated intercepts are zero and that slope
coefficients (beta) are equal to one for all companies (Campbell, Lo and MacKinlay (1997)). Brown
and Warner (1985) show that this model, although parsimonious, performs reasonably well as a
benchmark portfolio for event studies using short windows.
Price differences adjusted to the market on the first ex-dividend day, PD1a and PD2a, are
computed according to equations 5 and 6 but replacing P1 for P1a.
Multiple Regressions
Procianoy and Verdi (2003) study the determinants of the market reaction around the ex-dividend date
using univariate statistics. We extend this analysis by estimating multiple regressions of Price
Differences (PD1a and PD2a) as explanatory variables.
As described above, Brazilian companies may decide to pay dividends via the shareholders
general meeting (SGM) or a board of directors meeting (BDM). Due to this Brazilian characteristic, we
code the INFO variable as ‘1’ for BDM dividends and ‘0’ for SGM dividends to test any signaling
differences on the first ex-dividend day. Dividends paid via a BDM are considered unexpected to the
market and may contain a signal about the company’s future profitability. On the other hand, dividends
paid via the SGM are announced at least eight days in advance, with publication of the summons to the
meeting, so there should be no information passed to the market by the ex-dividend date. Therefore, if
on average, dividends send a positive signal to the market, then we expect BDM dividends to be priced
higher than SGM ones.
In line with Procianoy and Verdi (2003), we control for dividend YIELD, defined as the
© RAE- eletrônica - v. 8, n. 1, Art. 1, jan./jun. 2009 www.fgv.br/raeeletronica
dividends to price (results are similar if we use total assets as the deflator). If investors see a high
YIELD as a signal of future profitability, then we expect high YIELD dividends to be positively
correlated with prices on the first ex-dividend day. We also control for company size (SIZE), defined as
the natural logarithm of total assets, and for past operational performance (EBITDA), defined as
earnings before interest, taxes, depreciation and amortization deflated by total assets. Both SIZE and
EBITDA are measured at the beginning of fiscal year when the dividends were paid. Finally, we
include YEAR dummies to control for macroeconomic effects. In addition, we expect that over time
investors will learn from experience and that, eventually, the stock market will adjust accordingly, so
each year’s unexpected results should get closer to the theoretical value. We define n-1 dummy
variables coded ‘1’ if the dividend was paid in the specific year and ‘0’ otherwise.
We estimate a linear model using ordinary least squares described as follows:
PD1a (PD2a) = β0 + β1*YIELD+ β2*INFO + β3*SIZE + β4*EBITDA + βi*YEARi (8)
We predict β1 and β2 > 0 because high YIELD dividends and dividends that are unexpected may
contain a signal to the market.
Event Study
Following Procianoy and Verdi (2003), we perform an event study to evaluate the presence of
abnormal returns in an 11-day event window around the last cum-dividend day. This method is
unbiased and a powerful test of whether there are unexpected returns around the event date (Brown and
Warner (1985)). Abnormal returns are calculated according to the market-adjusted-return model and
computed as the difference between the observed stock price return and the market portfolio return:
ARit = Rit – Rmt (9)
where ARit is the abnormal return of stock i on date t; Rit is the return of stock i on date t; and
Rmt is the market return on date t. We use the IBOVESPA index as the market portfolio.
We compute the cumulative abnormal return as the sum of the average daily abnormal returns
(MacKinlay (1997)).
CARt is the cumulative abnormal return of the stock price between date ‘0’ and date t and ARt
is mean abnormal return on date t.
In addition to abnormal returns, we compute the abnormal trading volume (ABVOL0 and
ABVOL1) to study the market adjustment around the ex-dividend date and to test whether this
adjustment is a function of the type of dividend announcement (BDM or SGM). Following Kalay
(1982), for each dividend payment we calculate the average daily trading volume between dates -40
and dates –10. We calculate the abnormal volume on date t as the difference between the average stock
volume during days –40 and –10 and the stock volume on date t. We extend this measure to an event
window from date -5 to date +5.
We measure trade volume to test the existence of abnormal volume around the ex-dividend
date. Abnormal volume could arise from clientele trade due to tax incentives, or from investors trading
on new information revealed to the market. We expect that the existence of abnormal volume for
expected dividends (paid via the shareholders meeting) will mainly reflect clientele trade driven by tax
incentives, since the new information revealed to the market is minimal given that the dividends have
been previously announced. On the other hand, an abnormal trade related to unexpected dividends may
reflect either clientele trade or trade due to the new information disclosed to the market.
SAMPLE DESCRIPTION
We collect stock prices and financial data from the ECONOMATICA database. We include companies
whose stocks were traded on the São Paulo Stock Exchange between January 1, 1996 and December
31, 2000, and that paid at least one dividend in the period. We exclude all stocks that do not trade on
cum- and ex-dividend days to avoid illiquid stocks. The final sample is composed of 394 dividend
distributions from 119 different companies, which are representative of large companies in the
Brazilian economy.
The sample contains 58% of the stocks on the IBOVESPA index in the Brazilian market during
May-August, 1996 and 1997, 56% of the stocks in the index in 1998 and 1999, and 72% of the stocks
in the index in 2000. All variables are winsorized at 1% and 99% (i.e., for each variable we re-assign
its value if it is less (greater) than the 1st (99th) percentile to the value of the 1st (99th) percentile) to
© RAE- eletrônica - v. 8, n. 1, Art. 1, jan./jun. 2009 www.fgv.br/raeeletronica
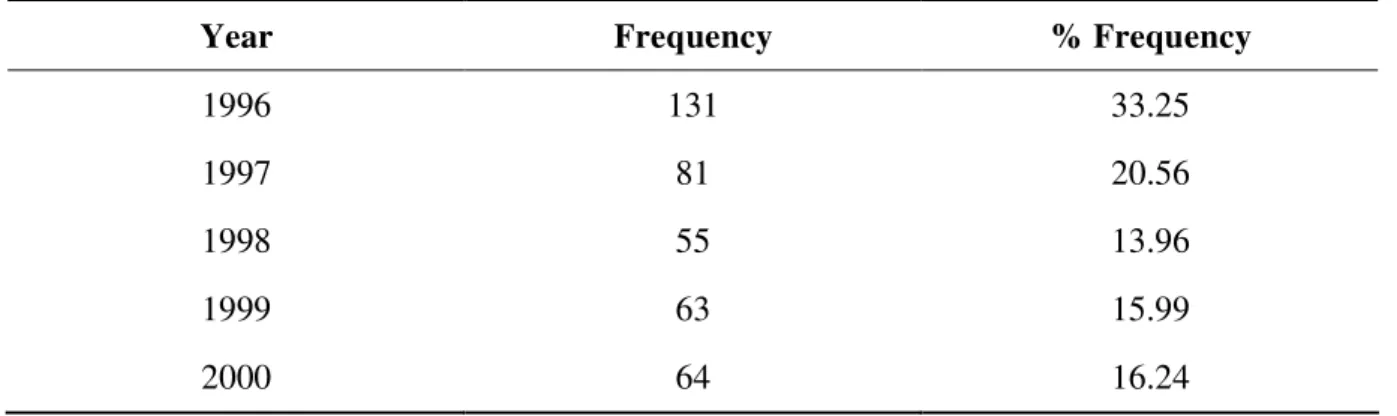
Table I – Panel A presents the frequency of observations per calendar year. We observe a
concentration of events in 1996 because, starting in 1997, Brazilian firms were allowed to pay a special
type of dividend, which has a different tax treatment. These dividends are tax deductible at the
company level up to the long term interest rate (this deductibility is similar to the interest deductibility
of debt) but are taxed at the investor level at 15%. We exclude special dividends from the sample
because of the different tax treatment and because we are interested in testing the dividend clientele
model when dividends are not taxed. Panel B presents the average number of observations per calendar
month. The Table reports the average number of observations per month across all years in the sample.
Analysis of individual years provides similar distributions. We observe some clustering in April
because of companies whose fiscal year ends in December and that pay dividends in April. For the
remainder of the analysis, we present results using the full sample, but similar results are obtained once
we remove April’s observations, thereby reducing the concern of dependence between observations
and of confounding events like earnings announcements. Also, in a sensitivity test we exclude all
observations from 1996 and the inferences of our results are qualitatively the same.
Table I – Frequency of observations (continua)
Panel A - Frequency of Observations by Year
Year Frequency % Frequency
1996 131 33.25
1997 81 20.56
1998 55 13.96
1999 63 15.99
2000 64 16.24
Panel B - Frequency of Observations by Month
Month frequencies are tabulated across all years.
Month Frequency % Frequency
January 39 9.90
February 35 8.88
April 109
(conclusão)
27.66
May 16 4.06
June 16 4.06
July 31 7.87
August 41 10.41
September 14 3.55
October 17 4.31
November 11 2.79
December 11 2.79
RESULTS
Clientele Model
Table II presents the market-adjusted results for our sample. Untabulated results using raw returns are
identical to the ones reported in this paper. The first two columns tabulate the price differences for the
total sample, and the remaining columns divide the sample between SGM and BDM dividends. For the
total sample, we observed an average price difference PD1a (PD2a) of 1.8% (1.4%) on the first
dividend day, significant at the 1% level. This means that for the full sample the stock price on the
ex-dividend day was 1.8% (1.4%) higher than the minimum (maximum) theoretical price predicted by the
dividend clientele model. For the sub-sample of BDM dividends (unexpected by the market), the
average price difference PD1a (PD2a) is 2.2% (1.8%) whereas for SGM dividends, the average price
difference PD1a (PD2a) is 1.4% (1.0%). The difference between the two samples is significant at the
5% level.
In general, we observe that the stock trades at a higher price than the expected price predicted
by the dividend clientele model. For the total sample, only 4% of the cases had stock prices within the
theoretical interval for the first ex-dividend day. In 65% of the observations, stock prices were higher
than the maximum theoretical price and in 31% of the cases the stock prices were lower than the
© RAE- eletrônica - v. 8, n. 1, Art. 1, jan./jun. 2009 www.fgv.br/raeeletronica
ex-dividend date was higher than the stock price on the last cum-dividend date for the whole sample.
This demonstrates that stock price behavior on the first ex-dividend day did not conform to theoretical
expectations and in most cases was higher than expected prices.
Table II – Ex-dividend day price adjustment
PD1 is the price difference between P1 and P1Tmin. PD2 is theprice difference between P1 and P1Tmax.SGMs are events where
the dividends are paid via the shareholders general meeting, and BDMs are events where the dividends are paid via a board of directors meeting. #Mean difference test comparing BDM vs. SGM. ***, **: 1% and 5% significance level, respectively.
All BDM SGM
Variable PD1 PD2 PD1 PD2 PD1 PD2
Mean 0.018*** 0.014*** 0.022*** 0.018*** 0.014**
*
0.010** *
STD 0.041 0.038 0.045 0.041 0.036 0.034
Min -0.056 -0.060 -0.056 -0.060 -0.056 -0.060
Median 0.009 0.007 0.012 0.009 0.007 0.005
Max 0.213 0.183 0.213 0.183 0.194 0.173
N 394 394 208 208 186 186
t-value 8.81 7.49 7.17 6.42 5.19 4.02
z-value# 2.04** 2.11**
% > 0 68.79 64.72 73.56 68.75 63.44 60.22
In order to investigate in more detail what kind of companies have price increases on the
dividend date, we define a dummy variable ‘UP’ coded as ‘1’ for those companies where the
ex-dividend price is higher than the cum-ex-dividend price (i.e. P1 greater than P0). Table III presents mean
values for the total sample and the sub-sample dividends by the type of dividend (SGM vs. BDM) and
by dividend yield quintiles. We observe that in 39% of the cases the trading price was higher on date
‘1’ than on date ‘0’. This number increases to 60% for the low-yield dividend sub-sample and
decreases to 15% for the high dividend yield group (the non-parametric test for difference in means is
statistically significant at the 1% level). We also find that prices are more likely to increase on the
ex-dividend date for unexpected ex-dividends (42%) than for expected ex-dividends (34%), but the
non-parametric test for difference in means is only marginally significant (p-value < 0.11).
In general we observe that low-yield dividends increase the probability of price increases on the
ex-dividend day. This finding is expected by the dividend clientele model since the higher the dividend
yield, the higher the expected drop in the share price. However, to the extent that the price actually
increases, the clientele model cannot explain this finding. The evidence also suggests that the price
However, even for expected dividends where the information content is low, we still observe price
increases. These results do not rule out the clientele hypothesis but do go against the theoretical
predictions of the clientele model. They suggest that when dividends are unexpected, following the
signaling hypothesis, the information disclosed to the market increases the probability of price increase
on the ex-dividend date.
Table III – UP Frequency
UP is a dummy variable coded ‘1’ if the stock price on date 1 was higher than the stock price on date ‘0’. SGMs are events where the dividends are paid via shareholders general meetings, and BDMs are events where the dividends are paid via board of directors meetings. YIELD is the dividend paid divided by the stock price on date ‘0’ multiplied by 100.
UP Yield Quintiles
1 2 3 4 5 All
All
Mean Yield
(%) 0.13 0.85 2.07 3.67 8.30 3.01
Mean UP 0.60 0.48 0.42 0.28 0.15 0.39
N 78 79 79 79 79 394
t-value 10.8 8.5 7.48 5.49 3.74 15.71
BDM Mean Yield
(%) 0.20 0.81 2.04 3.67 7.91 3.00
Mean UP 0.59 0.46 0.49 0.33 0.18 0.42
N 59 28 41 36 44 208
t-value 9.2 4.84 6.17 4.18 3.09 12.32
SGM Mean Yield
(%) 0.11 0.91 2.10 3.66 8.61 3.02
Mean UP 0.63 0.49 0.34 0.23 0.11 0.34
N 19 51 38 43 35 186
t-value 5.55 6.93 4.39 3.57 2.09 9.85
Multiple Regression Analysis
Table IV presents the descriptive statistics for the variables included in the multiple regression models.
© RAE- eletrônica - v. 8, n. 1, Art. 1, jan./jun. 2009 www.fgv.br/raeeletronica
(2.1%) and more than 75% of the sample paid dividend yields smaller than 5%. Panel B provides
Pearson correlations for the variables. We observe that YIELD is positively correlated with price
differences but negatively correlated with the UP variable.
Table IV – Descriptive Statistics (continua)
PD1 is the price difference between P1 and P1Tmin. PD2 is the price difference between P1 and P1Tmax. UP is a dummy variable coded ‘1’ if the stock price on date ‘1’ was higher than the stock price on date' ‘0’. YIELD is the dividend paid divided by the stock price on date ‘0’ multiplied by 100. INFO is a dummy variable coded ‘1’ for dividends announced via a BDM and ‘0’ for dividends announced via the SGM. SIZE is the natural logarithm of a firm’s total assets in the year before the dividend payment. EBITDA is earnings before interest, taxes, depreciation and amortization deflated by total assets. P-values are presented in italics.
Panel A – Descriptive statistics
Variable N Mean STD Q1 Median Q3
PD1 394 0.018 0.041 -0.004 0.009 0.030
PD2 394 0.014 0.038 -0.006 0.007 0.027
UP 394 0.386 0.487 0 0 1
YIELD
(%) 394 3.01 3.27 0.60 2.14 4.18
INFO 394 0.528 0.500 0 1 1
SIZE 394 14.792 1.695 13.353 14.832 15.755
EBITDA 394 0.053 0.070 0.000 0.012 0.092
Panel B – Correlation Matrix
PD1 PD2 UP YIELD
(%) INFO SIZE
PD2 0.99 --
<.0001
UP 0.24 0.28 --
<.0001 <.0001
YIELD
(%) 0.54 0.46 -0.29 --
<.0001 <.0001 <.0001
INFO 0.10 0.11 0.08 0.00 --
(conclusão)
SIZE -0.25 -0.22 0.09 -0.41 0.17 --
<.0001 <.0001 0.0731 <.0001 0.0006
EBITDA -0.01 -0.02 -0.25 0.12 -0.14 -0.18
0.9191 0.7509 <.0001 0.0135 0.0064 0.0003
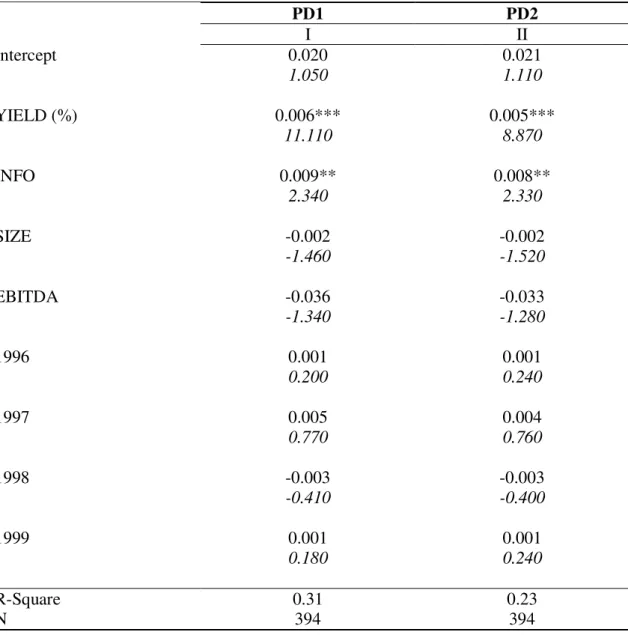
Table V presents the results for the multiple regressions with PD1a and PD2a as the dependent
variables. Following our predictions, we observe a positive and statistically significant (at the 1% level)
effect of YIELD, which suggests that the shares of companies that paid high dividends compared to the
stock price traded at higher prices on the ex-dividend day. We also observe that unexpected dividends
have a positive effect on stock prices since dividends announced via a BDM are priced 0.9% higher
than dividends announced via the SGM (significant at the 5% level). This result is consistent with the
informative effect of dividends given that dividends announced to the market via the shareholders
general meeting (SGM) had been previously released and already incorporated into prices; hence the
smaller market reaction. Finally, we observe no YEAR effect, suggesting that price differences do not
reduce over time.
We estimate the model with a proxy for unexpected dividends calculated as the percentage
difference between the current dividend yield and the dividend yield in the previous year. The purpose
of this variable is to capture whether the dividend represents good or bad news for investors. We are
able to estimate this variable for 352 observations, but its inclusion does not change the results
presented in the paper.
In general, these results raise new questions about the determinants of stock prices on the first
ex-dividend day. The results seem to contradict the clientele model since we observe a price increase
on the first ex-dividend date. Furthermore, the findings favor the signaling hypothesis showing that
© RAE- eletrônica - v. 8, n. 1, Art. 1, jan./jun. 2009 www.fgv.br/raeeletronica Table V - Multiple Regression Analysis for Price Difference
PD1 is the price difference between P1 and P1Tmin. PD2 is theprice difference between P1 and P1Tmax.1996, 1997, 1998 and 1999 are dummy variables coded ‘1’ if the dividend was paid in the specific year and ‘0’ otherwise. YIELD is the dividend paid divided by the stock price on date ‘0’ multiplied by 100. INFO is a dummy variable coded ‘1’ for dividends announced via a BDM and ‘0’ for dividends announced via the SGM. SIZE is the natural logarithm of a firm’s total assets in the year before the dividend payment. EBITDA is earnings before interest, taxes, depreciation and amortization deflated by total assets. T-values are in italics, and *** and ** indicate significance at the 1% and 5% levels, respectively.
PD1 PD2
I II
Intercept 0.020 0.021
1.050 1.110
YIELD (%) 0.006*** 0.005***
11.110 8.870
INFO 0.009** 0.008**
2.340 2.330
SIZE -0.002 -0.002
-1.460 -1.520
EBITDA -0.036 -0.033
-1.340 -1.280
1996 0.001 0.001
0.200 0.240
1997 0.005 0.004
0.770 0.760
1998 -0.003 -0.003
-0.410 -0.400
1999 0.001 0.001
0.180 0.240
R-Square 0.31 0.23
N 394 394
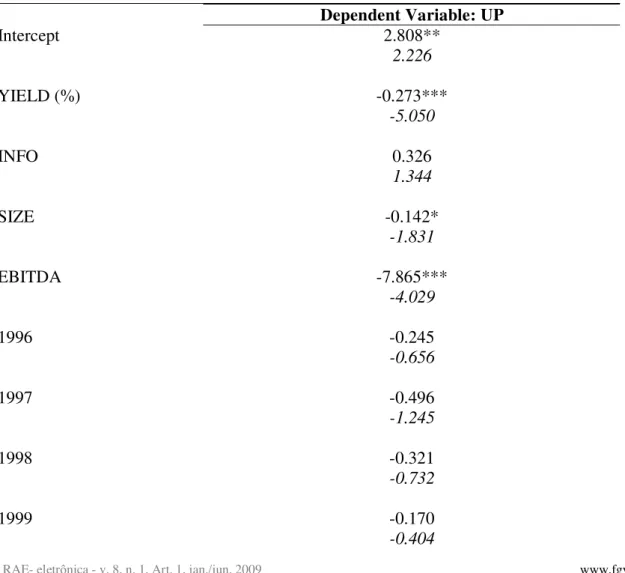
Table VI presents the results for a logistic regression using UP as the dependent variable. We
find a negative relation between YIELD and UP. The results suggest that stocks that pay low dividends
yields are more likely to increase in price on the first ex-dividend day. Another interpretation is that the
market is not informed that the stock is traded ex-dividend. In this case, the higher the dividend yield,
therefore the lower the likelihood of a price increase. We also find a positive coefficient on INFO
although the result is not significant at conventional levels.
At first sight, one could argue that the reason that prices are driven up on the first ex-dividend
day is that some dividends are small and may be unexpected to the market. In this case, the clientele
model would not be able to predict the stock price. However, we refer to the results from Table III that
show that, even for the highest yield quintile and for expected dividends (SGM cases), we observe that
prices increase on the first ex-dividend date in 11% of the cases. Overall, the results in Tables V and VI
explain part of the puzzle but some questions remain unanswered.
Table VI – Multiple Regression Analysis for ‘UP’ (continuação)
UP is a dummy variable coded ‘1’ if the stock price on date ‘1’ was higher than the stock price on date ‘0’. 1996, 1997,
1998 and 1999 are dummy variables coded ‘1’ if the dividend was paid in the specific year and ‘0’ otherwise. YIELD is the
dividend paid divided by the stock price on date ‘0’ multiplied by 100. INFO is a dummy variable coded ‘1’ for dividends announced via a BDM and ‘0’ for dividends announced via the SGM. SIZE is the natural logarithm of a firm’s total assets in the year before the dividend payment. EBITDA is earnings before interest, taxes, depreciation and amortization deflated by total assets. T-values are in italics, and *** and ** indicate significance at the 1% and 5% levels, respectively.
Dependent Variable: UP
Intercept 2.808**
2.226
YIELD (%) -0.273***
-5.050
INFO 0.326
1.344
SIZE -0.142*
-1.831
EBITDA -7.865***
-4.029
1996 -0.245
-0.656
1997 -0.496
-1.245
1998 -0.321
-0.732
1999 -0.170
© RAE- eletrônica - v. 8, n. 1, Art. 1, jan./jun. 2009 www.fgv.br/raeeletronica (conclusão)
R-Square 0.16
N 394
Event Study
We perform an event study to test whether the results above were produced by momentary speculation,
insider trading, or over-reaction due to a preference for “birds-in-hand” as described by Bhattacharya
(1979). We remove all observations with three or more days without negotiation in the event window,
resulting in 368 observations. We censored the daily abnormal returns from the 1st and 99th percentiles
to avoid the influence of extreme observations.
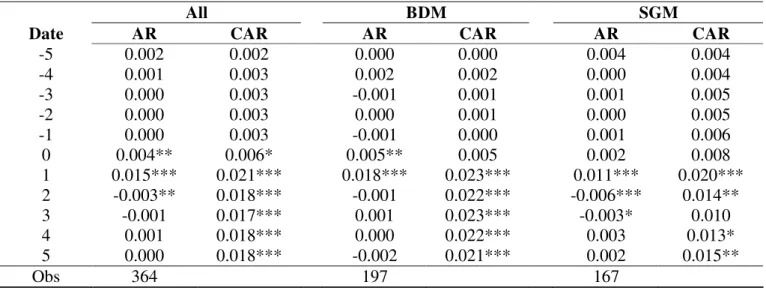
We tabulate abnormal returns and cumulative abnormal returns for the total sample and for the
sub-sample depending on the information content of the dividend (SGM vs. BDM). Results in Table
VII show, for the total sample, a positive abnormal return on the first ex-dividend day of 1.5%,
significant at the 1% level. The abnormal return is higher for the unexpected dividends (1.8%) than for
the expected dividends (1.1%).
We also observe that the abnormal return on date ‘0’ is positive and statistically significant for
the unexpected dividends. This suggests that some of the BDM dividend announcements are made
before the market closes on the last cum-dividend date or that the market anticipates the information
decided upon in the board meeting. Another possibility could be insider trading before the information
becomes public knowledge in the market. Figure 1 presents the cumulative abnormal return, ‘CAR’,
during the event window. We observe that the abnormal returns on the first ex-dividend day decrease
on the following days but still remain at a new price level that is higher than the new expected
theoretical price. Overall, the results corroborate tests performed on the clientele hypothesis in the
Table VII -Abnormal Returns
Abnormal returns are calculated according to the market model as the difference between the observed stock price return and the market portfolio return. We compute the cumulative abnormal return as the sum of the average abnormal return. Date ‘0’ represents the last cum-dividend day. SGMs are events where the dividends are paid via shareholders general meetings, and BDMs are events where the dividends are paid via board of directors meetings. ***, **, *: 1%, 5% and 10% significance levels, respectively.
All BDM SGM
Date AR CAR AR CAR AR CAR
-5 0.002 0.002 0.000 0.000 0.004 0.004
-4 0.001 0.003 0.002 0.002 0.000 0.004
-3 0.000 0.003 -0.001 0.001 0.001 0.005
-2 0.000 0.003 0.000 0.001 0.000 0.005
-1 0.000 0.003 -0.001 0.000 0.001 0.006
0 0.004** 0.006* 0.005** 0.005 0.002 0.008
1 0.015*** 0.021*** 0.018*** 0.023*** 0.011*** 0.020***
2 -0.003** 0.018*** -0.001 0.022*** -0.006*** 0.014**
3 -0.001 0.017*** 0.001 0.023*** -0.003* 0.010
4 0.001 0.018*** 0.000 0.022*** 0.003 0.013*
5 0.000 0.018*** -0.002 0.021*** 0.002 0.015**
Obs 364 197 167
Table VIII presents the abnormal volumes for the total sample and for the sub-sample depending on the
information content of the dividend (SGM vs. BDM). Daily abnormal volumes are censored [removed
from?] the 1st and 99th percentiles. We find positive abnormal volumes for the dates –1, 0, and +1, but
the result is mainly driven by the unexpected dividends since the abnormal volumes for the expected
dividends are positive but not statistically significant.
Figure 2 presents daily abnormal volumes for the three samples. The results suggest an
abnormal behavior due to the information content of the dividend; however, we do not find any
abnormal behavior suggesting there is clientele trade, i.e., driven by the different tax incentives or
insider trading over the few days before any stock becomes ex-dividend.
We re-estimate the abnormal volumes (untabulated) for each year to check for the existence of a
time trend. We would expect that the abnormal volume would decrease over time reflecting the market
learning about the stock mispricing. Consistent with our predictions, we find that abnormal volumes in
1996 (133% for both BDM and SGM) are much higher than the abnormal volumes in the rest of the
period (28%), although both are statistically different from zero. However, even after excluding 1996,
we still find a positive and statistically significant abnormal volume on dates ‘-1’, ‘0’, and ‘+1’ for the
© RAE- eletrônica - v. 8, n. 1, Art. 1, jan./jun. 2009 www.fgv.br/raeeletronica
Table VII -Abnormal Volume
We calculate the abnormal volume on date t as the difference between the average stock volume between days –40 and –10 and the stock volume on date t. Date ‘0’ represents the last cum-dividend day. SGMs are events where the dividends are paid via shareholders general meetings, and BDMs are events where the dividends are paid via board of directors meetings. ***, **, *: 1%, 5% and 10% significance levels, respectively
All BDM SGM
Date ABV ABV ABV
-5 0.073 0.071 0.075
-4 0.135 0.080 0.188
-3 -0.037 0.076 -0.147*
-2 0.112 0.142 0.082
-1 0.241*** 0.293** 0.189
0 0.665*** 1.099*** 0.242
1 0.358*** 0.636*** 0.087
2 0.031 0.138 -0.074
3 0.007 -0.032 0.045
4 0.118 0.295* -0.054
5 0.193* 0.487** -0.093
Obs 314 155 159
CONCLUSION
We investigate the clientele effect during the sample period of 1996 to 2000. The clientele hypothesis
was first proposed by Miller and Modigliani (1961) and then tested by Elton and Gruber (1970). Since
then several papers have tested the EG model with mixed evidence, with Procianoy and Verdi (2003)
producing important evidence that is inconsistent with the existence of a clientele effect in the Brazilian
market. Contrary to the clientele hypothesis, they find evidence of a price increase on the first
ex-dividend day, suggesting that investors were paying more for a stock without a ex-dividend than they were
for the same stock with the right to receive the dividend.
This paper extends the research in Procianoy and Verdi (2003) by exploring the fact that
Brazilian companies are allowed to pay dividends via two processes: Shareholders General Meeting
(SGM) and Board of Directors Meeting (BDM). All SGMs are called at least 8 days in advance and
cum-dividend date, SGM cum-dividends are already expected whereas BDM cum-dividends are unexpected by
investors.
Using a sample of 394 dividend distributions from 119 companies during 1996 to 2000 we find,
like Procianoy and Verdi (2003), that on the first ex-dividend day the actual stock price is on average
1.8% higher than the price expected by the dividend clientele model and results in an abnormal return
of 1.5%, which is significant at the 1% level. Dividends announced via a BDM are priced 0.9% higher
than dividends announced via the SGM (significant at the 5% level). However, even with dividends
that are previously announced via the SGM the stock prices are higher than expected. This suggests
that the findings in Procianoy and Verdi (2003) are not purely driven by the information content of the
dividends announced via a BDM. Finally, we find evidence of a positive abnormal volume around the
dividend payments via a BDM, which is consistent with the signaling hypothesis, but we do not find
abnormal trading volumes around the ex-dividend date for dividends previously announced via the
SGM.
Although we cannot rule out clientele adjustments to prices on the ex-dividend date, our results
are inconsistent with the clientele model’s predictions and support the signaling theory of dividends.
Our results explain some of the findings in Procianoy and Verdi (2003) but many questions remain
unanswered since we find, like these authors, that investors pay more for a stock without dividend than
for the same stock with a dividend.
Nevertheless, our study contributes to academic literature by jointly studying the clientele and
the signaling hypotheses in a unique setting. In addition, our results have implications for the
non-academic community such as managers, asset management investors, and institutional investors
looking to increase the returns on their investments. Finally, given the increased attention to emerging
economies, an opportunity exists to investigate a similar question in other markets such as Russia,
India, and China. We leave this for future research.
NOTE OF GRATEFULNESS
We thank Yakov Amihud, John Core, Wayne Guay, Lillian Mills, Janet Payne, Tjomme Rusticus, Narayanan Subramanian
and participants at the BALAS 2002, the Financial Management Association 2003, the Eastern Finance Association 2004,
and the American Accounting Association 2004 conferences for their thoughtful comments. Ricardo Heneiberg’s research
assistance is acknowledged. Rodrigo Verdi gratefully acknowledges the financial support of the MIT Sloan School of
Management.
© RAE- eletrônica - v. 8, n. 1, Art. 1, jan./jun. 2009 www.fgv.br/raeeletronica REFERENCES
AMIHUD, Y; MURGIA, M. Dividends, taxes, and signaling: evidence from Germany. Journal of
Finance, v. 52, n. 1, p. 397-408, 1997.
BHATTACHARYA, S. Imperfect information, dividend policy, and the bird in hand fallacy. Bell
Journal of Economics, v. 10, n. 1, p. 259-270, 1979.
BROWN, S; WARNER, J. Using daily stocks returns: the case of event studies. Journal of Financial
Economics, v. 14, n. 4, p. 3-31, 1985.
CAMPBELL, J. Y; LO, ANDREW W; MACKINLAY, A. CRAIG. The econometrics of financial
markets. New Jersey: Princeton University Press, 1997.
DAUNFELDT, S. O. Tax policy changes and ex-dividend behavior: the case of Sweden. Working
paper. University of Umea, 2002.
EASTERBROOK, F. H. Two agency-cost explanations of dividends. American Economic Review, v.
74, n. 4, p. 221-230,1984.
ELTON, E. J; GRUBER, M. J. Marginal stockholders tax rates and the clientele effect. Review of
Economics and Statistics, v. 52, n. 1, p. 68-74, 1970.
ELTON, E. J.; GRUBER, M. J.; BLAKE, C. Marginal stockholder tax effects and ex-dividend day
behavior thirty-two years later. Working paper. New York University, 2002.
FRANK, M; JAGANNATHAN, R. Why do stock prices drop by less than the value of the dividend?
Evidence from a country without taxes. Journal of Financial Economics, v. 47, n. 2, p. 161-188, 1998.
JENSEN, M. Agency costs of free cash flow, corporate finance, and takeovers. American Economic
JOHN, K; WILLIAMS, J. Dividends, dilution, and taxes: a signaling equilibrium. Journal of Finance,
v. 40, n. 4, p. 1053-1070, 1985.
KALAY, A. The ex-dividend day behavior of stock prices: a re-examination of the clientele effect.
Journal of Financial Economics, v. 10, n. 2, p. 1059-1070, 1982.
LASFER, M; ZENOMOS, M. The tax impact on the ex-dividend dates: evidence from Europeans
firms. Working paper. Cass Business School, 2003.
MACKINLAY, A. C. Event studies in economics and finance. Journal of Economic Literature, v. 35,
n. 1, p. 13-39, 1997.
MICHAELY, R; MURGIA, M. The effect of tax heterogeneity on prices and volume around the
ex-dividendday: evidence from the milan stock exchange. The Review of Financial Studies, v. 8, p.
369-399, 1995.
MILLER, M. H; MODIGLIANI, F. Dividend policy, growth and the valuation of shares. Journal of
Business, v. 34, n. 4, p. 411-433, 1961.
MILLER, M. H; ROCK, K. Dividend policy under asymmetric information. Journal of Finance, v. 40,
p. 1031-1051, 1985.
MILONAS, N; TRAVLOS, N. G. The ex-dividend day stock price behavior in the Athens stock
exchange. Working paper. 2001.
MILONAS, N; TRAVLOS, N. G; XIAO, J. Z; TAN, C. The Ex-dividendDay Stock Price Behavior in
the Chinese Stock Market. Working paper. 2002.
PROCIANOY, J. L; VERDI, R. O efeito clientela no mercado brasileiro: será que os investidores são
© RAE- eletrônica - v. 8, n. 1, Art. 1, jan./jun. 2009 www.fgv.br/raeeletronica
ROMON, F. Contribution of dividend policy stability to the measurement of dividend announcement