TCD
9, 441–493, 2015Snowfall in the Himalayas: an uncertain future from
a little-known past
E. Viste and A. Sorteberg
Title Page
Abstract Introduction
Conclusions References
Tables Figures
◭ ◮
◭ ◮
Back Close
Full Screen / Esc
Printer-friendly Version
Interactive Discussion
Discussion
P
a
per
|
Discussion
P
a
per
|
Discussion
P
a
per
|
Discussion
P
a
per
The Cryosphere Discuss., 9, 441–493, 2015 www.the-cryosphere-discuss.net/9/441/2015/ doi:10.5194/tcd-9-441-2015
© Author(s) 2015. CC Attribution 3.0 License.
This discussion paper is/has been under review for the journal The Cryosphere (TC). Please refer to the corresponding final paper in TC if available.
Snowfall in the Himalayas: an uncertain
future from a little-known past
E. Viste and A. Sorteberg
Geophysical Institute, University of Bergen, and Bjerknes Centre for Climate Research Allégaten 70, 5007 Bergen, Norway
Received: 4 December 2014 – Accepted: 12 December 2014 – Published: 16 January 2015
Correspondence to: E. Viste ([email protected])
TCD
9, 441–493, 2015Snowfall in the Himalayas: an uncertain future from
a little-known past
E. Viste and A. Sorteberg
Title Page
Abstract Introduction
Conclusions References
Tables Figures
◭ ◮
◭ ◮
Back Close
Full Screen / Esc
Printer-friendly Version
Interactive Discussion
Discussion
P
a
per
|
Discussion
P
a
per
|
Discussion
P
a
per
|
Discussion
P
a
per
Abstract
Snow and ice provide large amounts of meltwater to the Indus, Ganges and Brahma-putra rivers. This study combines present-day observations and reanalysis data with climate model projections to estimate the amount of snow falling over the basins today and in the last decades of the 21st century. Estimates of present-day snowfall based on
5
a combination of temperature and precipitation from reanalysis data and observations, vary by factors of 2–4. The spread is large, not just between the reanalysis and the
ob-servations, but also between the different observational data sets. With the strongest
anthropogenic forcing scenario (RCP 8.5), the climate models project reductions in annual snowfall by 30–50 % in the Indus Basin, 50–60 % in the Ganges Basin and
10
50–70 % in the Brahmaputra Basin, by 2071–2100. The reduction is due to increasing temperatures, as the mean of the models show constant or increasing precipitation throughout the year in most of the region. With the strongest anthropogenic forcing scenario, the mean elevation where rain changes to snow – the rain/snow line – creeps upward by 400–900 m, in most of the region by 700–900 m. The largest relative change
15
in snowfall is seen in the upper, westernmost sub-basins of the Brahmaputra. With the strongest forcing scenario, most of this region will have temperatures above freezing, especially in the summer. The projected reduction in annual snowfall is 65–75 %. In
the upper Indus, the effect of a warmer climate on snowfall is less extreme, as most
of the terrain is high enough to have temperatures sufficiently far below freezing today.
20
A 20–40 % reduction in annual snowfall is projected.
1 Introduction
In the dry spring months preceding the Indian summer monsoon, much of the water in the Himalayan rivers comes from melting snow and ice (Bookhagen and Burbank, 2010; Siderius et al., 2013; Schaner et al., 2012). Concern has been raised that global
25
TCD
9, 441–493, 2015Snowfall in the Himalayas: an uncertain future from
a little-known past
E. Viste and A. Sorteberg
Title Page
Abstract Introduction
Conclusions References
Tables Figures
◭ ◮
◭ ◮
Back Close
Full Screen / Esc
Printer-friendly Version
Interactive Discussion
Discussion
P
a
per
|
Discussion
P
a
per
|
Discussion
P
a
per
|
Discussion
P
a
per
amount of seasonal snow available for melting. Whether the meltwater comes from snow or glacier ice, stable snowfall is required to maintain the flow in the long run. Observations of present-day snowfall in the region are limited, meaning that there is also limited knowledge of the normal state and of historical trends. In this study we use temperature and precipitation data from a reanalysis and from observations to estimate
5
snowfall in the Indus, Ganges and Brahmaputra Basins today. We then incorporate future changes in temperature and precipitation from a suite of climate models and follow the same procedure to estimate snowfall in 2071–2100.
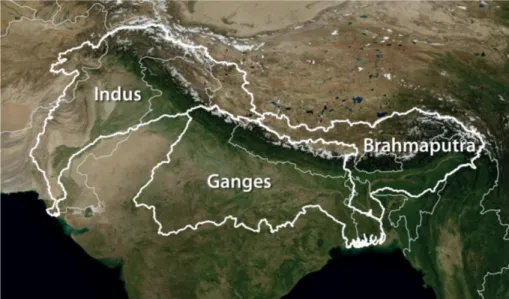
The catchments of the Indus, Ganges and Brahmaputra rivers, as referred to in this article, are shown in Fig. 1. The rivers run from the Hindu Kush - Karakoram - Himalaya
10
(HKH) mountain range through the lowlands of Pakistan, India and Bangladesh. Both rainwater and meltwater from snow and ice contribute to all three rivers, with the highest meltwater fraction in the Indus and the lowest in the Ganges (Immerzeel et al., 2010; Bookhagen and Burbank, 2010; Singh et al., 1997). Even in the Ganges, meltwater is important in the otherwise dry spring (Siderius et al., 2013).
15
The Indian summer monsoon creates markedly different seasonal cycles in eastern
and western parts of the HKH, both in precipitation and in the accumulation of snow and ice. In the monsoon-dominated central Himalayas and on the Tibetan Plateau, more than 80 % of the annual precipitation falls during summer. Precipitation maxima in the western regions occur in connection with westerly disturbances in winter. In the
20
Hindu Kush and Karakoram, as well as in the easternmost Himalaya, summer precipi-tation amounts to less than 50 % of the annual precipiprecipi-tation (Bookhagen and Burbank, 2010). The seasonal cycle of snowfall varies accordingly. In the western HKH, snow ac-cumulates during winter, while the summer is the main melting season. Further east, the summer is the main season, not just for ablation, but also for accumulation (Rees
25
and Collins, 2006).
Precipitation also varies greatly between inner and outer parts of the Himalayas (Singh et al., 1997; Bookhagen and Burbank, 2006; Winiger et al., 2005). According to
TCD
9, 441–493, 2015Snowfall in the Himalayas: an uncertain future from
a little-known past
E. Viste and A. Sorteberg
Title Page
Abstract Introduction
Conclusions References
Tables Figures
◭ ◮
◭ ◮
Back Close
Full Screen / Esc
Printer-friendly Version
Interactive Discussion
Discussion
P
a
per
|
Discussion
P
a
per
|
Discussion
P
a
per
|
Discussion
P
a
per
monsoon is most pronounced in the lowlands, below 500 m a.s.l., while the difference
is less at higher elevations.
1.1 Observed trends in snowfall, temperature and precipitation
Using satellite data, Rikiishi and Nakasato (2006) found that the mean annual snow
cover area in Himalaya and on the Tibetan Plateau had been reduced by ∼1 % yr−1
5
during 1966–2001. Few studies include snowfall data from stations on the ground, especially for periods long enough to detect trends. Studies of temperature and precip-itation provide some information, though the picture is far from complete. Temperatures have increased in most of the region, whereas precipitation studies show varying re-sults, depending on the location and time period. Whereas higher temperatures act
10
to reduce the snow fraction, increased precipitation may have compensated in some regions.
Positive temperature trends have been observed throughout the HKH (Immerzeel, 2008; Immerzeel et al., 2009; Xu et al., 2008b; Bhutiyani et al., 2007, 2010; Shrestha et al., 1999; Shekhar et al., 2010; Fowler and Archer, 2006). The only exception to the
15
regional warming is the Karakoram range, where both maximum and minimum tem-peratures have decreased since the mid-1980s (Shekhar et al., 2010). Both in Nepal (Shrestha et al., 1999) and the Upper Indus (Immerzeel et al., 2009), temperatures have increased more at higher elevations than in the lower terrain, implying that regions
with snow may have been more strongly affected than indicated by regional means.
20
Increasing temperatures (Xu et al., 2008b) have most likely been the driver behind reductions in the snow cover on the Tibetan Plateau. During 1966–2001, the length of the snow season was reduced by 23 days (Rikiishi and Nakasato, 2006). The annual precipitation on most of the Tibetan Plateau increased over the same period (Xu et al., 2008a, b; You et al., 2008); only in the western part was there a decrease (Xu et al.,
25
2008b).
Brahmapu-TCD
9, 441–493, 2015Snowfall in the Himalayas: an uncertain future from
a little-known past
E. Viste and A. Sorteberg
Title Page
Abstract Introduction
Conclusions References
Tables Figures
◭ ◮
◭ ◮
Back Close
Full Screen / Esc
Printer-friendly Version
Interactive Discussion
Discussion
P
a
per
|
Discussion
P
a
per
|
Discussion
P
a
per
|
Discussion
P
a
per
tra as a whole for 1901–2002. For the same period Guhathakurta and Rajeevan (2008) found no significant precipitation trends relevant to snowfall in eastern parts of India, and neither did Shrestha et al. (2000) for stations in Nepal in the shorter period 1959– 1994.
More studies of snow and ice have been performed for the Indus Basin than for the
5
Ganges and Brahmaputra, possibly because meltwater constitutes a larger fraction of
the run-offin this basin (Bookhagen and Burbank, 2010; Immerzeel et al., 2010). Also,
as large parts of the Indus get little rain in late spring and summer, the link between melting snow and river discharge is perhaps more intuitive than in the regions further east, where the top of the meltwater season coincides with the Indian summer
mon-10
soon rain (Rees and Collins, 2006). No consistent precipitation trends have been found for the mountain regions of the Indus Basin as a whole, and epochs of more and less precipitation have alternated (Sontakke et al., 2008; Bhutiyani et al., 2010).
Some of the recent interest may also have been sparked by Karakoram glacier growth. After decades of recession, Karakoram glaciers were seen to expand in the
15
late 1990s (Scherler et al., 2011; Gardelle et al., 2012; Hewitt, 2005). An observed combination of increased winter precipitation and decreased summer temperatures have been suggested to be the cause (Archer and Fowler, 2004; Fowler and Archer, 2006), and reduced summer discharge in rivers coming from the Karakoram is in accor-dance with the observed glacier growth (Fowler and Archer, 2006; Sharif et al., 2013).
20
In contrast, Hartmann and Andresky (2013), found only insignificant negative trends in Karakoram precipitation during 1986–2010, and Cook et al. (2013) reported increased discharge in the Upper Indus after 1998. As pointed out by Hewitt (2005) and sup-ported by Kääb et al. (2012), the glacier growth applies only to higher elevations in the central Karakoram, while glaciers in other parts and at intermediate elevations have
25
continued to decline. Increased transport of moisture to higher altitudes may be part of the explanation (Hewitt, 2005).
re-TCD
9, 441–493, 2015Snowfall in the Himalayas: an uncertain future from
a little-known past
E. Viste and A. Sorteberg
Title Page
Abstract Introduction
Conclusions References
Tables Figures
◭ ◮
◭ ◮
Back Close
Full Screen / Esc
Printer-friendly Version
Interactive Discussion
Discussion
P
a
per
|
Discussion
P
a
per
|
Discussion
P
a
per
|
Discussion
P
a
per
duced in all the ranges, though less in the innermost Karakoram than in the outer ranges. As opposed to temperature increases in the other ranges, the Karakoram range experienced decreasing temperatures. The reduction in snowfall on the outside of the outermost range, Pir Panjal, during the last decades was supported by Bhutiyani et al. (2010), who found that the duration of the snowfall season had been reduced by
5
about 5–6 days per decade.
Documented trends in other parts of the Indus basin vary, and alternating epochs indicate that the choice of time period may influence the results. In Jammu and Kash-mir and Himachal Pradesh, Bhutiyani et al. (2010) found a significant decreasing trend in summer precipitation during the 20th century. There was no trend in winter
precip-10
itation at the three stations used, but epochs of dry and wet winters had alternated, and winter precipitation was above average in 1991–2006. Previously, a long-term in-crease in summer and annual precipitation in Jammu and Kashmir was documented by Guhathakurta and Rajeevan (2008), and in Himachal Pradesh by Singh et al. (2008) Sontakke et al. (2008), on the other hand found no trends in this part of India since the
15
19th century, but noted a dry epoch since 1968. It should be pointed out that their data set contained stations in the outer ranges, only, and not in e.g. the Karakoram.
Further west in the Upper Indus Basin, at stations mainly in Pakistan, (Archer and Fowler, 2004) observed no trends in precipitation over the 20th century, but a signifi-cant increase in winter, summer and annual precipitation at several stations starting in
20
1961. The increase was accompanied by increasing winter temperatures, but decreas-ing summer temperatures (Fowler and Archer, 2006). Hartmann and Andresky (2013) found significant, positive trends in precipitation in the Hindu Kush and the Sulaiman mountains for 1986–2010.
Satellite-based studies of trends in the present century (2000–2008/2001–2007)
25
TCD
9, 441–493, 2015Snowfall in the Himalayas: an uncertain future from
a little-known past
E. Viste and A. Sorteberg
Title Page
Abstract Introduction
Conclusions References
Tables Figures
◭ ◮
◭ ◮
Back Close
Full Screen / Esc
Printer-friendly Version
Interactive Discussion
Discussion
P
a
per
|
Discussion
P
a
per
|
Discussion
P
a
per
|
Discussion
P
a
per
1.2 Future projections of snowfall, temperature and precipitation
In the last decades of the 21th century, the temperature over India is projected to be on
average 2.0–4.8◦C higher than today, depending on the anthropogenic forcing scenario
(Chaturvedi et al., 2012). In the Himalayas, a temperature increase of more than 7◦C is
seen with the strongest forcing, the Representative Concentration Pathway (RCP) 8.5
5
(Chaturvedi et al., 2012; Collins et al., 2013). Independently of precipitation changes, higher temperatures will decrease the fraction of precipitation falling as snow. Whether snowfall will increase or decrease thus depends on whether precipitation will increase enough to compensate for the reduced snow fraction.
Climate models from CMIP5, the most recent Coupled Model Inter-comparison
10
Project (Taylor et al., 2011), project a general increase in precipitation over India, grow-ing with anthropogenic forcgrow-ing and with time, both annually (Chaturvedi et al., 2012) and during the summer monsoon (Menon et al., 2013). An increase was also seen in data from the previous model comparison project, CMIP3 (Turner and Annamalai, 2012). Menon et al. (2013) found that changes in the low-level winds suggest a
north-15
ward shift in the monsoon by the end of the 21st century for the strongest forcing scenario, although the total zonal strength of the monsoon remained fairly constant.
It should be emphasized that there is a large inter-model spread in precipitation pro-jections, and the IPCC AR5 concludes that there is medium confidence in the increase in summer monsoon precipitation over South Asia (Christensen et al., 2013). But
al-20
though precipitation projections are less reliable than temperature projections, agree-ment between models increases with time and anthropogenic forcing (Chaturvedi et al., 2012). Also, the CMIP5 multi-model mean has been considered to represent the mon-soon and the actual climate in India better than any individual model (Chaturvedi et al., 2012; Sperber et al., 2013).
25
sim-TCD
9, 441–493, 2015Snowfall in the Himalayas: an uncertain future from
a little-known past
E. Viste and A. Sorteberg
Title Page
Abstract Introduction
Conclusions References
Tables Figures
◭ ◮
◭ ◮
Back Close
Full Screen / Esc
Printer-friendly Version
Interactive Discussion
Discussion
P
a
per
|
Discussion
P
a
per
|
Discussion
P
a
per
|
Discussion
P
a
per
ulate 7–25 % reductions in the spring snow cover extent by 2080–2100. For snowfall and snow water equivalents (SWE), the projections show more variation. While warm-ing decreases the amount of snow, both through meltwarm-ing and through decreaswarm-ing the snow fraction, more precipitation may increase snowfall in some of the coldest regions (Räisänen, 2008; Brutel-Vuilmet et al., 2013). Though shown to apply mainly to the
5
northern parts of Eurasia and North America, there is a possibility that some of the
higher-lying terrain in the HKH may be similarly affected.
1.3 Aims and scope
For the HKH, uncertainty in projections of future precipitation and snowfall comes on top of uncertainty in present time conditions. Observations are limited, especially in
re-10
mote, high-elevation regions (Anders et al., 2006; Immerzeel, 2008; Tahir et al., 2011b;
Winiger et al., 2005). Insufficient knowledge of the amount of snow falling over the
re-gion today, makes the contribution to both seasonal snowmelt and storage in glaciers correspondingly uncertain.
Recognizing this uncertainty, this study provides an ensemble of monthly mean
15
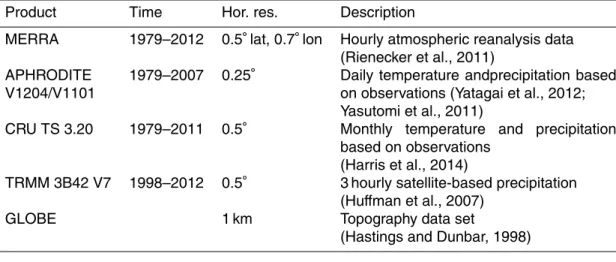
snowfall estimates for all sub-basins of the Indus, Ganges and Brahmaputra, today and for 2071–2100. For the present time estimates, we have combined MERRA re-analysis data (Rienecker et al., 2011) with observationally based data sets of
precip-itation and temperature: CRU TS (Harris et al., 2014), TRMM (Huffman et al., 2007)
and APHRODITE (Yatagai et al., 2012; Yasutomi et al., 2011). Whereas Ménégoz
20
et al. (2013) and Wiltshire (2014) analyzed Himalayan snowfall by downscaling reanal-ysis data with regional climate models, we have applied a simple terrain adjustment of the reanalysis temperature field.
The ensemble of present-day estimates is presented in Sect. 3. Future snowfall was then calculated based on the present-day snowfall and projected changes in
temper-25
TCD
9, 441–493, 2015Snowfall in the Himalayas: an uncertain future from
a little-known past
E. Viste and A. Sorteberg
Title Page
Abstract Introduction
Conclusions References
Tables Figures
◭ ◮
◭ ◮
Back Close
Full Screen / Esc
Printer-friendly Version
Interactive Discussion
Discussion
P
a
per
|
Discussion
P
a
per
|
Discussion
P
a
per
|
Discussion
P
a
per
Three main features may be involved in precipitation changes in the HKH: changes in the summer monsoon, changes in western disturbances during winter, and the gen-eral changes that occur in the thermodynamic properties of the air as the temperature increases and the air contains more water vapor. We have not considered the role of
the different factors, only looked at how changes in temperature and precipitation
af-5
fect snowfall. Unless otherwise specified, any reference to snow refers to precipitation falling as snow, not to the snow cover on the ground.
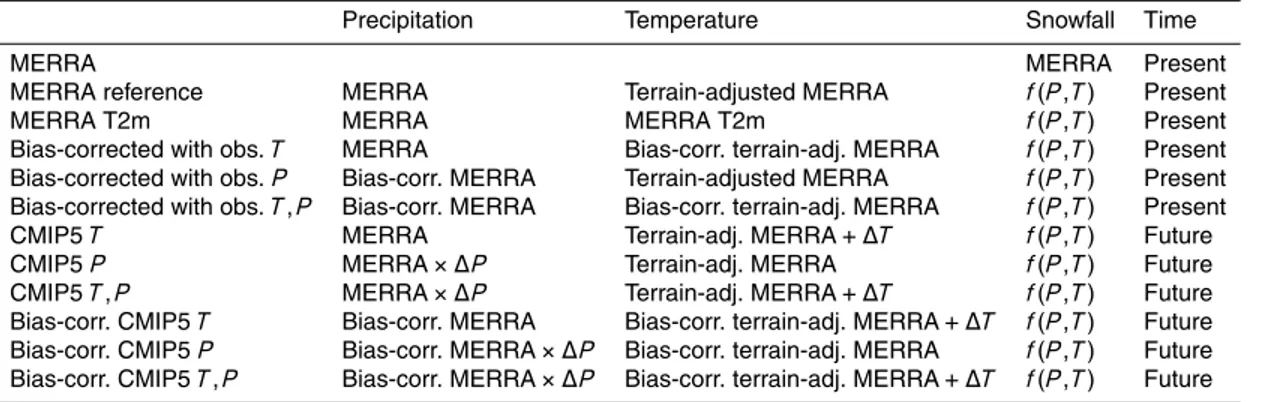
2 Data and methods
In addition to the original MERRA reanalysis snowfall, we estimated snowfall using
different combinations of temperature and precipitation data. An overview of the
com-10
binations is shown in Table 1 and the data sets used presented in Tables 2 and 3. Present-day snowfall estimates were based on:
1. MERRA 2 m temperature adjusted to a higher-resolution elevation grid, and MERRA precipitation (Sect. 2.1). This was used as a basis for the other estimates and is referred to as MERRA reference snowfall. The adjusted temperature is
15
referred to as terrain-adjusted.
2. MERRA 2 m temperature and precipitation.
3. The MERRA data in (1) bias-corrected with observation-based data for tempera-ture and precipitation (Sect. 2.2).
Estimates for the last decades of the 21th century were based on:
20
4. The MERRA data in (1) plus the changes in temperature and precipitation in a group of CMIP5 models over the coming century (Sect. 2.3).
TCD
9, 441–493, 2015Snowfall in the Himalayas: an uncertain future from
a little-known past
E. Viste and A. Sorteberg
Title Page
Abstract Introduction
Conclusions References
Tables Figures
◭ ◮
◭ ◮
Back Close
Full Screen / Esc
Printer-friendly Version
Interactive Discussion
Discussion
P
a
per
|
Discussion
P
a
per
|
Discussion
P
a
per
|
Discussion
P
a
per
With the exception of original MERRA snowfall data, all snowfall estimates were based on the relationship between temperature and snowfall derived by Dai (2008). Based on observations, the conditional snow frequency over land was formulated as
F(Ts)=ahtanh b(Ts−c)−di, (1)
whereTsis the surface air temperature [◦C], anda
=−48.2292,b=0.7205,c=1.1662,
5
andd=1.0223. This may be interpreted as the probability, or fraction, of precipitation
falling as snow at a given temperature. We calculated hourly snowfall as the product
ofF and the amount of precipitation. Cut-offs for no rain and no snow were set at−10
and 10◦C, respectively, as this was the range of the data used by Dai (2008).
All snowfall estimates were made for the sub-basins defined in the HydroSHEDS
10
data set (Lehner et al., 2008). The results were then aggregated for the Indus, Ganges, and Brahmaputra Basins.
Within each major basin, we also grouped the sub-basins into regions with
simi-lar characteristics of snow and precipitation. This was done withk-means clustering
(MacQueen, 1967), using the square Euclidean distance as the distance measure.
15
The seasonal cycles of precipitation, snow and snow fraction were first clustered sep-arately, with the MERRA reference data and data bias-corrected with CRU TS data as input. We then adjusted the clusters manually, prioritizing similarity of the relative sea-sonal cycles of snow and snow fraction, and checking that both data sets gave similar results. Five groups were defined for the Indus, and four for each of the other basins.
20
This included a no-snow group in each basin.
2.1 Reference present-day snowfall
The horizontal resolution of the MERRA reanalysis data in the Himalayas is about 55 km latitude and 70 km longitude. To account for smaller-scale temperature variations in the rugged terrain, we used the vertical temperature gradient in MERRA to adjust
25
TCD
9, 441–493, 2015Snowfall in the Himalayas: an uncertain future from
a little-known past
E. Viste and A. Sorteberg
Title Page
Abstract Introduction
Conclusions References
Tables Figures
◭ ◮
◭ ◮
Back Close
Full Screen / Esc
Printer-friendly Version
Interactive Discussion
Discussion
P
a
per
|
Discussion
P
a
per
|
Discussion
P
a
per
|
Discussion
P
a
per
elevation-adjusted ground temperature was calculated as
T
adj=T0−
T2−T1
z2−z1(zmerra, 0−zglobe) , (2)
whereT0is the MERRA 2 m temperature,T1 is the temperature at the lowest pressure
level above the ground,T
2the temperature at the next level, andz2andz1the height of
these levels.zmerra,0andzglobe is the elevation of the MERRA and GLOBE topography,
5
respectively. To reduce calculation time compared to using the original 1 km GLOBE resolution, both MERRA and GLOBE data were interpolated to a 4 km grid. Snowfall was calculated for each grid-point, and then aggregated for each sub-basin for each month.
Snowfall based on elevation-adjusted MERRA temperature and MERRA
precipita-10
tion is used as a reference throughout this article. This is because the elevation-adjusted temperature and the 4 km grid was used as the starting-point in all subse-quent calculations. It does not mean that we consider this snowfall to be closer to the truth than any of the other estimates.
2.2 Bias-corrected, present-day snowfall
15
A second group of present-day snowfall estimates was made from MERRA precipi-tation and elevation-adjusted temperature bias-corrected with observationally based data sets: APHRODITE daily temperature and precipitation for 1979–2007, CRU TS monthly temperature and precipitation for 1979–2011, and TRMM 3B42 3 hourly pre-cipitation for 1998–2012. Bias-corrections were performed on daily or monthly scales,
20
depending on the input data, and the result distributed over the hourly time-steps of the MERRA temperature and precipitation. As a result, the diurnal cycle in MERRA is maintained in all estimates. Snowfall was then calculated following the same procedure as for the MERRA reference snowfall (Sect. 2.1). When referring to APHRODITE snow or CRU snow anywhere in this article, this is the snowfall calculated using MERRA
25
TCD
9, 441–493, 2015Snowfall in the Himalayas: an uncertain future from
a little-known past
E. Viste and A. Sorteberg
Title Page
Abstract Introduction
Conclusions References
Tables Figures
◭ ◮
◭ ◮
Back Close
Full Screen / Esc
Printer-friendly Version
Interactive Discussion
Discussion
P
a
per
|
Discussion
P
a
per
|
Discussion
P
a
per
|
Discussion
P
a
per
Temperature data are generally assumed to be normally distributed, and as de-scribed in Teutschbein and Seibert (2012) and references therein, the data can be bias-corrected through a Gaussian distribution mapping. We thus bias-corrected the elevation-adjusted MERRA temperature with the observationally based APHRODITE V1204 daily temperature, by mapping the distribution of the MERRA data to the
Gaus-5
sian distribution of the observations.
As the CRU TS 3.20 includes monthly mean daily minimum and maximum temper-atures, the method described by (Wang and Zeng, 2013) was used. Bias-corrected, daily maximum temperatures were defined as
T
d, max=Tmerra, d, max− Tmerra, mn, max−Tcru, mn, max
, (3)
10
d denotes daily and mn monthly. Daily minimum temperatures were then corrected by adjusting the diurnal range,
Td, min=Td, max−∆Tmerra, d· ∆
Tcru, mn
∆Tmerra, mn, (4)
where∆T represents the diurnal and monthly temperature range.
The distribution mapping procedure described by Ines and Hansen (2006) was used
15
to bias-correct MERRA precipitation with APHRODITE V1101R2 daily precipitation and daily accumulated TRMM 3B42 3 hourly precipitation. This is a two-step procedure involving frequency and intensity adjustments. We defined precipitation days as days with at least 0.1 mm in the observations. The frequency was first adjusted by setting the number of precipitation days in MERRA equal to that of the observations. This was
20
done by removing the lowest daily values. The intensity was then adjusted by fitting the remaining days to the gamma distribution of the observations.
Bias-corrections with CRU TS 3.20 monthly precipitation were done with a simple correction factor to adjust the monthly MERRA total to that of CRU (e.g. Ines and Hansen, 2006).
TCD
9, 441–493, 2015Snowfall in the Himalayas: an uncertain future from
a little-known past
E. Viste and A. Sorteberg
Title Page
Abstract Introduction
Conclusions References
Tables Figures
◭ ◮
◭ ◮
Back Close
Full Screen / Esc
Printer-friendly Version
Interactive Discussion
Discussion
P
a
per
|
Discussion
P
a
per
|
Discussion
P
a
per
|
Discussion
P
a
per
2.3 Projected snowfall
The MERRA reanalysis was also the basis for estimates of future snowfall. The changes in temperature and precipitation from 1971–2000 to 2071–2100 were added to the reanalysis data and snowfall calculated following the same procedure as for the present time. Climate change input came from models that were part of the Coupled
5
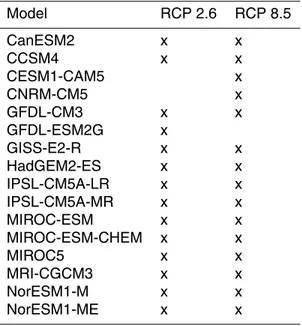
Model Inter-comparison Project 5 (CMIP5, Taylor et al., 2011), for the Representative Concentration Pathways (RCP) 2.6 and 8.5 (Moss et al., 2010; van Vuuren et al., 2011). The models used are listed in Table 3.
Due to the different spatial resolution of the models, changes were defined as
monthly mean changes on the sub-basin level. For temperature, the absolute change
10
was used, and for precipitation, the fractional change. Future projected snowfall was calculated with reference to elevation-adjusted MERRA snowfall for each model. Due to large deviations in estimates of present-day snowfall (Sect. 3), we also calculated snowfall for the CMIP5 multi-model mean changes with reference to the lowest present time estimate, APHRODITE snowfall.
15
2.4 The rain-snow line
Not all temperature changes affect snowfall. We defined the rain-snow line as the
el-evation where the temperature suggests a shift from rain to snow. Technically, this is a conditional rain-snow line, as no precipitation was required. For every hour, all grid cells that had a snow fraction/probability between 0.25 and 0.75, corresponding
20
to a temperature between 0.9 and 1.3◦C, were identified. The monthly rain-snow line
was then set as the mean elevation of these grid cells and time steps. For present-day conditions this was done for elevation-adjusted MERRA temperature and temperature bias-corrected with APHRODITE. Projected temperature changes in the CMIP5 RCP 8.5 were then added to these temperatures and the procedure repeated.
TCD
9, 441–493, 2015Snowfall in the Himalayas: an uncertain future from
a little-known past
E. Viste and A. Sorteberg
Title Page
Abstract Introduction
Conclusions References
Tables Figures
◭ ◮
◭ ◮
Back Close
Full Screen / Esc
Printer-friendly Version
Interactive Discussion
Discussion
P
a
per
|
Discussion
P
a
per
|
Discussion
P
a
per
|
Discussion
P
a
per
3 Present-day snowfall
3.1 Seasonal cycles of precipitation and snowfall
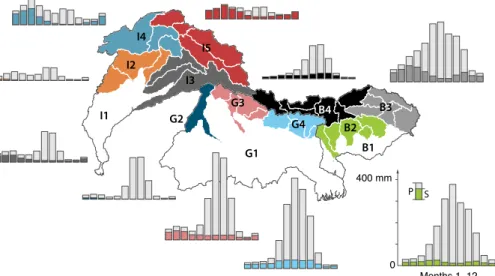
Figure 2 gives an overview of the seasonal cycle of rain and snow in different parts of
the HKH, based on MERRA precipitation and MERRA reference snowfall (Sect. 2.1). The upper Indus basin gets more snow than rain; in other sub-basins of the Indus,
5
Ganges and Brahmaputra, rainfall dominates. This difference is caused by different
pre-cipitation cycles. Whereas the summer monsoon dominates in the Central Himalayas, winter depressions bring most of the precipitation in the upper Indus – at a time when low temperatures mean that precipitation falls as snow in larger areas than it would in summer. Although snow fractions are lower in the upper Brahmaputra, monsoon
10
precipitation produces a substantial amount of summer snow at high elevations. In the northwesternmost cluster in the Indus, I4, March is the wettest month and also the month with the highest total amount of snowfall. Precipitation has a second peak during July and August, but the temperature is then too high to allow much snowfall. Further east, in cluster I5, more terrain at higher elevations cause higher snow fractions
15
during summer, but winter and spring is still the dominant snow season. The summer peak in precipitation in this cluster is caused by the two eastern sub-basins. There is little summer precipitation in the west.
In Brahmaputra’s cluster B4 and Ganges’ G4, maximum snowfall occurs during the summer monsoon. Higher temperatures during summer means that the snow fraction
20
is lower than in winter, but as there is much more summer precipitation, the amount of snow is also higher. Rare occurrences of precipitation during the cold winter, together with the combination of snowfall and snowmelt during summer, makes the seasonal cycle of snow depth in the Central Himalayas unpronounced (Ménégoz et al., 2013). In the upper-level basins in Brahmaputra’s B3, the summer is also the main
precipi-25
TCD
9, 441–493, 2015Snowfall in the Himalayas: an uncertain future from
a little-known past
E. Viste and A. Sorteberg
Title Page
Abstract Introduction
Conclusions References
Tables Figures
◭ ◮
◭ ◮
Back Close
Full Screen / Esc
Printer-friendly Version
Interactive Discussion
Discussion
P
a
per
|
Discussion
P
a
per
|
Discussion
P
a
per
|
Discussion
P
a
per
3.2 Comparison of snowfall estimates
The MERRA reference snowfall described in Sect. 3.1 differs greatly from snowfall
based on bias-corrected temperature and precipitation. Large differences between
temperature and data sets for the HKH cause corresponding deviations in snowfall – not only between MERRA-based estimates and bias-corrected data, but between
esti-5
mates based on bias-corrections with different data sets. This can be seen from Table 4,
which displays annual snowfall estimates for combinations of the bias-corrections de-scribed in Sect. 2.2, aggregated to the major basins. Data for the individual sub-basins are included as Supplement.
With the exception of snowfall based on MERRA precipitation and MERRA
temper-10
ature corrected with CRU TS in the Ganges basin, all estimates based on bias-corrected data are lower than the MERRA reference snowfall. The lowest estimates are those based on bias-corrections with APHRODITE precipitation and temperature. This combination produced only 33 % of the reference snowfall in the Indus Basin, 22 % in
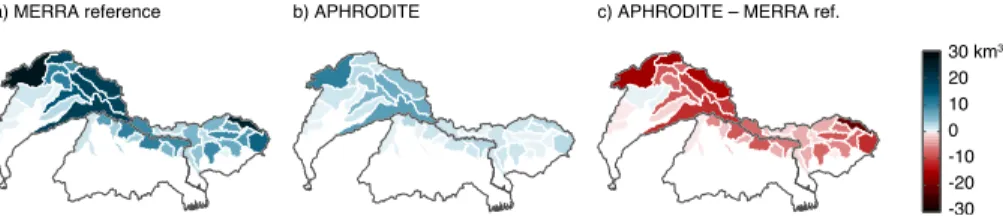
the Ganges Basins, and 17 % in the Brahmaputra Basin. While the difference is large in
15
all sub-basins that have snow today, it is especially large in the upper parts of the Indus and Brahmaputra Basins (Fig. 3). In comparison, bias-corrections with CRU TS tem-perature and precipitation produce 54 % of the reference snowfall in the Indus, 75 % in the Ganges, and 42 % in the Brahmaputra – factors of 2–4 compared to APHRODITE. It should be noted that, as the time periods covered by the data sets are not equal,
20
the results are not strictly comparable, but tests using different MERRA periods (not
shown) indicate that there would be no major difference in the monthly means.
The large difference between MERRA reference snowfall and snowfall based on
bias-corrected data, results from differences in both temperature and precipitation, but
differences in the precipitation pattern have the greatest effect. Estimates where only
25
the precipitation has been bias-corrected are lower than those where only the
tempera-ture has been bias-corrected (Table 4). This is not solely an effect of more precipitation
TCD
9, 441–493, 2015Snowfall in the Himalayas: an uncertain future from
a little-known past
E. Viste and A. Sorteberg
Title Page
Abstract Introduction
Conclusions References
Tables Figures
◭ ◮
◭ ◮
Back Close
Full Screen / Esc
Printer-friendly Version
Interactive Discussion
Discussion
P
a
per
|
Discussion
P
a
per
|
Discussion
P
a
per
|
Discussion
P
a
per
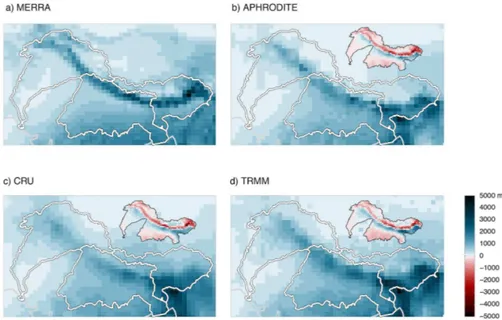
data sets in the Indus, and for APHRODITE also in the Ganges and the
Brahmapu-tra. An inland and upward shift in the MERRA precipitation adds to the differences.
As shown in Fig. 4, all the observation-based precipitation data sets are wetter than MERRA in most of the lowlands and in the foothills of the HKH, but drier in the higher-elevation regions further inland. In MERRA, the precipitation belt is shifted higher up
5
in the Himalayas, where temperatures are lower, and more of the precipitation falls as snow.
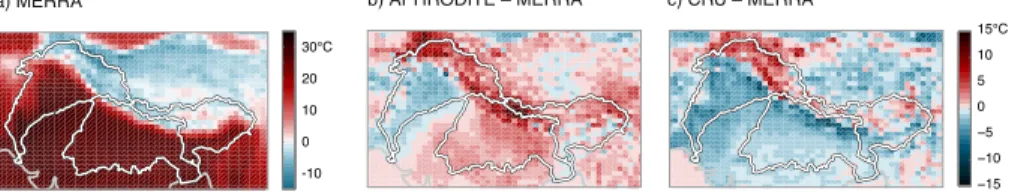
In addition, HKH temperatures are lower in MERRA than in APHRODITE, and in the upper Indus also than in CRU TS (Fig. 5). The lower temperatures in MERRA
cause higher snow fractions, further increasing the difference between the MERRA
ref-10
erence snowfall and APHRODITE snowfall. Oppositely, CRU TS is colder than MERRA throughout the Ganges, leading to higher snowfall estimates when bias-correcting MERRA temperatures with CRU TS (Table 4).
We do not see any reason to consider any of the observation-based data sets, nor the reanalysis, the ground truth. The reanalysis has the benefit of being physically
15
consistent, though precipitation is a pure model product. In the other data sets, the number of observations vary greatly within the region.
The lack of observations in the HKH has been pointed out in many studies. Most meteorological stations are located in the valleys and do not necessarily represent weather conditions in higher terrain. As demonstrated by Palazzi et al. (2013)
station-20
based data sets like APHRODITE and CRU TS are merely mathematical interpolations in major parts of the HKH and on the Tibetan Plateau Immerzeel (2008) showed that the number of observations going into version 2.1 of the CRU data set in the Himalayan region varies greatly. A drop in the mid-1990s suggests that caution should be taken when interpreting data at later times. Maps (not shown) of station coverage in version
25
3.20, used in this study, show that this problem persists.
TCD
9, 441–493, 2015Snowfall in the Himalayas: an uncertain future from
a little-known past
E. Viste and A. Sorteberg
Title Page
Abstract Introduction
Conclusions References
Tables Figures
◭ ◮
◭ ◮
Back Close
Full Screen / Esc
Printer-friendly Version
Interactive Discussion
Discussion
P
a
per
|
Discussion
P
a
per
|
Discussion
P
a
per
|
Discussion
P
a
per
leading to a possible under-registration of precipitation at the few high-elevation sta-tions that exist. Comparing stasta-tions along a vertical profile in the Karakoram, Winiger et al. (2005) found that precipitation multiplied by a factor of 5–10 from 2500 m a.s.l. to 5000–6000 m a.s.l. This maximum is much higher than reported in most other studies, and they attributed this to the valley-dominance of stations normally used.
5
Indications of too little precipitation at higher elevations were also given by Tahir et al. (2011b), as APHRODITE precipitation was too low to account for the observed discharge in the Hunza river in the Karakoram Anders et al. (2006) reported that TRMM radar data underestimated precipitation at higher elevations in the Himalayas, due to the low ability of the radar to detect very low precipitation and low–moderated
10
snowfall rates. On the other hand, Krakauer et al. (2013) found that both TRMM and APHRODITE had too much precipitation compared to observations from the few exist-ing stations at elevations above 3000 m a.s.l. in Nepal.
Satellite data are a promising future alternative for measuring snowfall, but presently of limited use. MODIS and LANDSAT satellite data have been used in several studies
15
of snow and ice in the Himalayas (Tahir et al., 2011a b; Bookhagen and Burbank, 2010; Hewitt, 2005; Krishna, 2005; Negi et al., 2009; Jain et al., 2009; Butt, 2012; Gao et al., 2012; Kulkarni et al., 2010; Immerzeel et al., 2009), but these data contain only snow cover area, with no measure of the snow thickness or snow water equivalents. The NASA AMSR-E SWE data set distributed by the National Snow and Ice Data
20
Center could have been used, but correlations between AMSR-E SWE and ground observations have been shown to be poor (Tedesco and Narvekar, 2010; Byun and Choi, 2014; Kumar et al., 2006). As AMSR-E SWE has been found underestimate snow depth, we concluded that incorporating these data into our ensemble would not likely constrain the results, nor add new information.
25
TCD
9, 441–493, 2015Snowfall in the Himalayas: an uncertain future from
a little-known past
E. Viste and A. Sorteberg
Title Page
Abstract Introduction
Conclusions References
Tables Figures
◭ ◮
◭ ◮
Back Close
Full Screen / Esc
Printer-friendly Version
Interactive Discussion
Discussion
P
a
per
|
Discussion
P
a
per
|
Discussion
P
a
per
|
Discussion
P
a
per
chosen mainly because it has an hourly resolution, allowing diurnal temperature
vari-ations to affect snowfall. But even though this estimate is much higher than all the
bias-corrected estimates, it cannot be discarded. It has been argued that reanalysis data and regional climate models may in some cases be as good as, or better, than observations in the HKH (Wiltshire, 2014; Ménégoz et al., 2013; Akhtar et al., 2008).
5
Akhtar et al. (2008) got better results when modeling river discharge in three upper Indus catchments with an RCM-based hydrological model, than with one based on the few observations available within the region. They concluded that it was preferable to use RCM data directly as input to hydrological models in this region.
As shown in the small, inset maps in Fig. 4, MERRA precipitation is higher than
ob-10
served precipitation throughout the HKH, and the same has previously been shown for ERA-Interim reanalysis precipitation (Palazzi et al., 2013). In MERRA, the precipi-tation belt is shifted upward in the terrain, compared to in the observation-based data sets. Whether this shift is realistic, cannot be determined as long as observations from upper-level terrain are either missing or likely too low.
15
4 Projected future snowfall
Whether higher temperatures lead to less snowfall, depends on whether the tempera-ture changes from below to above freezing, and whether this change occurs at a time when there is precipitation. The maps in Fig. 6 illustrate where a temperature increase
is most likely to affect snowfall and snowmelt. In the red zones, where the monthly
20
temperature today is between –5 and 0◦C, the projected temperature increase of 2–
7◦C (Chaturvedi et al., 2012; Collins et al., 2013; Wiltshire, 2014), may be considered
critical. Such a change would change snowfall to rain and also cause a change from freezing to melting of snow and ice. The pink zones, with monthly mean temperatures
of 0–5◦C, would similarly change from a climate where precipitation may often fall as
25
TCD
9, 441–493, 2015Snowfall in the Himalayas: an uncertain future from
a little-known past
E. Viste and A. Sorteberg
Title Page
Abstract Introduction
Conclusions References
Tables Figures
◭ ◮
◭ ◮
Back Close
Full Screen / Esc
Printer-friendly Version
Interactive Discussion
Discussion
P
a
per
|
Discussion
P
a
per
|
Discussion
P
a
per
|
Discussion
P
a
per
In January (Fig. 6a), only the lower parts of the Himalayas is affected, as most of
the region would still have temperatures well below the freezing point. The small, inset map shows precipitation in the red zone; a narrow band along the range. Oppositely,
in July (Fig. 6c), the temperature is already above 5◦C in most of the region, though at
higher elevations along the Himalayan range and in the Karakoram, the change can be
5
critical. The most widespread changes are seen in spring and fall. In April and October (Fig. 6b, d), large areas in the HKH and on the Tibetan Plateau risk a change from below to above freezing.
Incorporating CMIP5 precipitation changes, we find that the projected temperature increase has a larger impact, so that snowfall will be reduced in the Indus, Ganges, and
10
Brahmaputra Basins by 2071–2100 compared to today. Details for the major basins are presented in Sect. 4.1. How much increased temperatures reduce snowfall within a region, depends on the location of the rain/snow line today, compared to the terrain distribution. Results for selected upper-level sub-basins in the Indus and Brahmaputra will be discussed in that context, in Sect. 4.2.
15
The large deviations in the estimates of present-day snowfall (Sect. 3) means that there will be correspondingly large deviations in projected values. To account for this, most results are shown with reference to the highest and lowest present-day estimates: MERRA reference snowfall and to APHRODITE-based snowfall. Future estimates rela-tive to CRU and TRMM are assumed to lie between those of MERRA and APHRODITE.
20
4.1 Basin-scale projections
In the Indus, Ganges and Brahmaputra Basins, the CMIP5 models project a mean increase in both temperature (Fig. 7) and precipitation (Fig. 8) in the region by 2071– 2100, for both RCPs 2.6 and 8.5. The RCP 8.5 multi-model mean change in
temper-ature varies through the year, with a 4.9–6.2◦C increase in the Indus, 3.6–5.2◦C in
25
the Ganges and 4.2–6.0◦C in the Brahmaputra. The increase is smallest during the
TCD
9, 441–493, 2015Snowfall in the Himalayas: an uncertain future from
a little-known past
E. Viste and A. Sorteberg
Title Page
Abstract Introduction
Conclusions References
Tables Figures
◭ ◮
◭ ◮
Back Close
Full Screen / Esc
Printer-friendly Version
Interactive Discussion
Discussion
P
a
per
|
Discussion
P
a
per
|
Discussion
P
a
per
|
Discussion
P
a
per
the RCP 2.6. The summer is also the season with the largest absolute increase in precipitation.
Compared to present-day estimates, the CMIP5 models project less snowfall in the Indus, Ganges, and Brahmaputra Basins in the last decades of this century. This can be seen from Fig. 9. The projected multi-model mean is lower than today in all
calen-5
dar months, for both RCPs 2.6 and 8.5. With the RCP 2.6, some models suggest an increase in some months, mainly in winter and spring. This is also the case for one or two models with the RCP 8.5, whereas other models indicate that the snowfall in the same months will be only half of today’s values.
In the Ganges Basin (Fig. 9b) the seasonal distribution of snowfall today is mainly
10
flat, with equal amounts of snowfall from January through September. Reductions in summer snowfall with the RCP 8.5 would change the seasonal cycle into a winter-dominated one. To a lesser degree, this is also the case for RCP 2.6. As summer precipitation is projected to increase in all of the Ganges (not shown, but consistent with Menon et al., 2013), this indicates that large areas are at elevations where a small
15
increase in the summer temperature may cause a shift from snow to rain. This is seen as the red band along the upper Ganges in Fig. 6c. Reductions in summer snowfall are also large in the Brahmaputra (Fig. 9b), whereas in the Indus, the largest total changes occur in March–May (Fig. 9a).
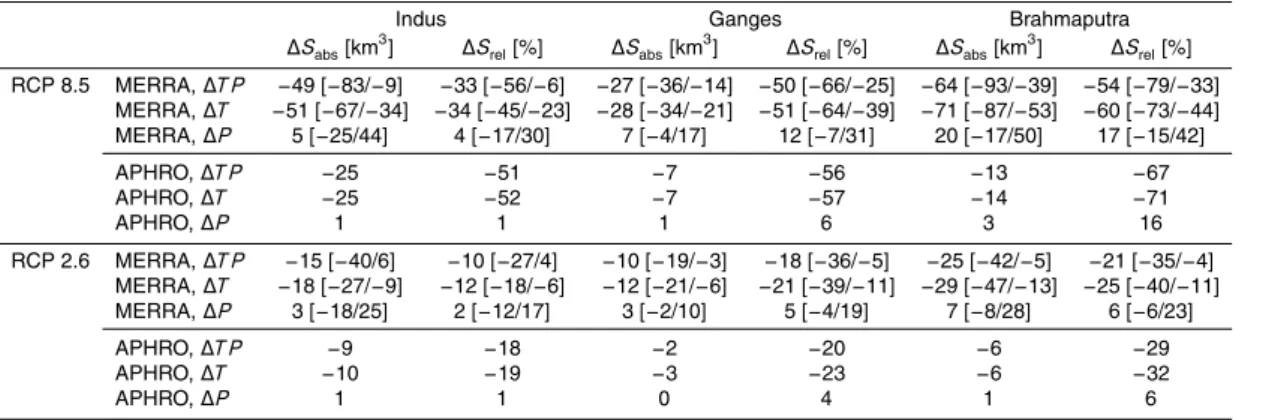
As the MERRA reference snowfall for today is much larger than APHRODITE
snow-20
fall (Sect. 3.2), projected absolute changes for 2071–2100 are also much larger in MERRA. The relative changes are more similar, though larger with reference to APHRODITE. Annual snowfall changes for each major basin are presented in Table 5, for changes in temperature, precipitation or both, and with reference to MERRA and Aphrodite present-day snowfall. Changes at the sub-basin level are shown in Fig. 10.
25
In the Ganges Basin, both MERRA- and APHRODITE-based multi-model mean snow-fall is reduced by about 20 % with the RCP 2.6 and 50 % with the RCP 8.5. In the
Indus and Brahmaputra Basins, the differences between MERRA- and
TCD
9, 441–493, 2015Snowfall in the Himalayas: an uncertain future from
a little-known past
E. Viste and A. Sorteberg
Title Page
Abstract Introduction
Conclusions References
Tables Figures
◭ ◮
◭ ◮
Back Close
Full Screen / Esc
Printer-friendly Version
Interactive Discussion
Discussion
P
a
per
|
Discussion
P
a
per
|
Discussion
P
a
per
|
Discussion
P
a
per
to MERRA and APHRODITE, respectively, the reduction in snowfall in the Indus Basin, is 30 and 50 %, with the RCP 8.5. The corresponding reductions in the Brahmaputra Basin are 50 and 70 %.
The projected changes in temperature have greater effect on snowfall than the
changes in precipitation. When taking into account only changes in precipitation, all
5
snowfall estimates are positive (∆P, Table 5). This indicates that the mean annual
to-tal reduction for each major basin is governed by the temperature change. In some
CMIP5 models (values in brackets in Table 5) the effect of precipitation changes (∆P)
on snowfall are of the same magnitude as the effect of temperature changes (∆T), but
for the CMIP5 multi-model mean, temperature changes cause snowfall changes 4–10
10
times as large as those due to changes in precipitation. This is with reference to the present-day MERRA reference snowfall, and for both RCPs 2.6 and 8.5. With reference
to APHRODITE snowfall, the effect of temperature changes compared to precipitation
changes is even greater.
4.2 Regional projections
15
If temperatures are far below freezing everywhere, warming may have little effect on
snowfall. The same applies if only the highest peaks receive snow today. The largest reduction in snowfall in a basin occurs if today’s rain/snow line is at an elevation just below the dominant elevation of the basin. Then, large regions will see a shift from snow to rain.
20
In the Indus Basin, the largest relative snowfall reduction by 2071–2100 is seen in the southwestern sub-basins, where snowfall is limited today (Fig. 10). The largest total reduction is seen in the snow-rich sub-basins of Kabul/Swat/Alingar in the west and in the east, and a smaller reduction in the inner-most basins of Gilgit/Hunza, Indus 1, and Nubra/Shyok. Together with the upper regions of the Brahmaputra, these sub-basins,
25
TCD
9, 441–493, 2015Snowfall in the Himalayas: an uncertain future from
a little-known past
E. Viste and A. Sorteberg
Title Page
Abstract Introduction
Conclusions References
Tables Figures
◭ ◮
◭ ◮
Back Close
Full Screen / Esc
Printer-friendly Version
Interactive Discussion
Discussion
P
a
per
|
Discussion
P
a
per
|
Discussion
P
a
per
|
Discussion
P
a
per
the seasonal cycle of snowfall and snow fraction. The values presented in this section are all from the RCP 8.5, for changes from today to 2071–2100.
4.2.1 Upper Indus, western part
Cluster 4 consists of the sub-basins Astor, Kabul/Swat/Alingar, and Krishen Ganga. As seen from the elevation profile at the top of Fig. 11a the elevation span is large,
5
and there is an almost equal proportion of the terrain at all levels from heights close to sea level to about 5000 m a.s.l. The most important change for this cluster, is a large reduction in the total amount of snowfall in winter and spring.
With a few exceptions, all CMIP5 models project less snowfall in all months of the year (Fig. 11a i, ii). The largest total multi-model mean reduction in snowfall (ii)
oc-10
curs in February–April, without notable change in the multi-model mean precipitation (iii). Thus, the reduction is caused by increasing temperatures, represented by the rain/snow line in Fig. 11a iv. As seen from the change in the rain/snow line elevation, the projected temperature increase in these months would imply that large areas that receive snow today would receive only rain. About 40 % of the ground in this cluster lies
15
below 2000 m a.s.l. and receives precipitation as rain throughout the year. In summer, precipitation (iii) is at a minimum, and the rain/snow line (iv) is already so high that only a small fraction of the area receives snowfall today. Thus, although the relative change in snowfall (i) is largest in summer, the change in the amount of snowfall (ii) is small. It should also be noted that the change in the rain/snow line elevation (iv) in summer is
20
much smaller; 400–600 m compared to 600–900 m in December–April.
4.2.2 Upper Indus, eastern part
Further east, the largest changes are projected for the spring season. Cluster 5 in the Indus Basin consists of the sub-basins Gilgit/Hunza, Indus 1, Nubra/Shyok, and Zan-skar. As shown in Fig. 11b, this is high-elevation terrain, with 80 % of the ground lying
25
TCD
9, 441–493, 2015Snowfall in the Himalayas: an uncertain future from
a little-known past
E. Viste and A. Sorteberg
Title Page
Abstract Introduction
Conclusions References
Tables Figures
◭ ◮
◭ ◮
Back Close
Full Screen / Esc
Printer-friendly Version
Interactive Discussion
Discussion
P
a
per
|
Discussion
P
a
per
|
Discussion
P
a
per
|
Discussion
P
a
per
For the multi-model mean, no big changes are projected in January–February. This is partly because of little change in precipitation (iii) and because the rain/snow line (iv)
in these months is sufficiently low in the terrain today. With the 500–600 m shift
pro-jected with the RCP 8.5, 80–90 % of the area will still have temperatures low enough for snow. The largest changes occur in March–October, when higher temperatures
5
push the rain/snow line above large areas that receive snow today. Increasing summer precipitation (iii) causes the snowfall reduction in summer to be less than it would
other-wise be. The effect of higher temperatures is smaller on the APHRODITE snowfall than
on the MERRA reference snowfall (ii), as APHRODITE has very little summer
snow-fall today. The difference arises both from less precipitation (iii) in APHRODITE than
10
MERRA today, and from a higher rain/snow line (iv) in APHRODITE. Note that, as the change in precipitation was defined as a fraction of the present-day value (Sect. 2.3), the relative changes in APHRODITE and MERRA precipitation are equal.
4.2.3 Upper Brahmaputra, western part
In the westernmost part of the upper Brahmaputra Basin, large snowfall changes are
15
projected for the summer. As cluster 5 in the Indus Basin, Brahmaputra’s cluster 4 is limited to higher grounds. Less than 6 % lies outside of the 4000–6000 m a.s.l. range. The cluster consists of Maquan He, Yarlung Zangbo, Dogxung Zangbo/Maiqu Zangbo, Shang Chu/Yarlung Zangbo/Nyang, Lhasa He/Razheng Zangbo, and Yamzho Yumco. The summer monsoon fully dominates the seasonal cycle of precipitation in this region
20
(Fig. 12a iii), resulting in a unimodal snow cycle, with a maximum in July–September. In APHRODITE the seasonal cycle of snowfall is similar, but less pronounced, than in the MERRA reference. The summer also sees the greatest reduction in CMIP5 projected snowfall, both in absolute (ii) and relative (i) terms, despite increasing summer precip-itation in all models (iii). The reason can be seen from the change in the rain/snow
25
TCD
9, 441–493, 2015Snowfall in the Himalayas: an uncertain future from
a little-known past
E. Viste and A. Sorteberg
Title Page
Abstract Introduction
Conclusions References
Tables Figures
◭ ◮
◭ ◮
Back Close
Full Screen / Esc
Printer-friendly Version
Interactive Discussion
Discussion
P
a
per
|
Discussion
P
a
per
|
Discussion
P
a
per
|
Discussion
P
a
per
snow. In comparison, with reference to MERRA, the 300–400 m shift seen in January– February would cause only a small absolute change in snowfall (ii) because there is little precipitation in these months (ii), and a small relative change (i) because the rain/snow line would still be low in the terrain (iv). With reference to APHRODITE, the relative snowfall change in winter would be larger than with reference to MERRA, as
5
temperatures today are higher, resulting in a higher rain/snow line (iv).
4.2.4 Upper Brahmaputra, eastern part
Like further west, the Indian summer monsoon dominates the precipitation cycle in the eastern part of upper Brahmaputra (Fig. 12b iii), but the seasonal cycle of snowfall peaks in spring and fall (iii). This is also the time of the largest projected changes.
10
Cluster 3 in the Brahmaputra consists of the sub-basins Yarlung Zangbo2, Nyang Qu, Yarlung Zangbo3, Yi’ong Zangbo/Parl, Siyom, Zaya Qu/Luhit/Di. About 70 % of the ground lies between 3000 and 6000 m a.s.l., but there is also land almost at sea level, mainly in the Zaya Qu/Luhit/Dingba Qu sub-basin. During summer, most of the terrain lies below the rain/snow line (iv). In spring, temperatures are lower than in summer,
15
and pre- monsoon precipitation is stronger in this part of the Himalayas than further west in cluster 3 (Fig. 12a iii vs. Fig. 12b iii). As a result, March–April gets the most snow.
Reductions in snowfall are projected for all months (ii), comparable in magnitude, but largest in the snow-rich spring, and late summer. The CMIP5 multi-model mean shows
20
increasing, or no change in precipitation in all months (Fig. 12b iii), so the reduction in snowfall is due solely to higher temperatures. The largest absolute reductions, in April and May, occur with a 700–800 m shift in the rain/snow line elevation, leaving 30 % more of the terrain in the rain. The largest relative reduction in future snowfall are projected for July and August (Fig. 12b i), when the rain/snow line shifts so high that
25
TCD
9, 441–493, 2015Snowfall in the Himalayas: an uncertain future from
a little-known past
E. Viste and A. Sorteberg
Title Page
Abstract Introduction
Conclusions References
Tables Figures
◭ ◮
◭ ◮
Back Close
Full Screen / Esc
Printer-friendly Version
Interactive Discussion
Discussion
P
a
per
|
Discussion
P
a
per
|
Discussion
P
a
per
|
Discussion
P
a
per
4.3 Potential effects of reduced snowfall on water availability
With a few exceptions, the CMIP5 multi-model mean precipitation change over the com-ing century is positive in all months in the upper Indus and Brahmaputra (Sect. 4.2). Thus, the projected reduction in snowfall is due solely to higher temperatures. How-ever, there is a large spread in precipitation projections among the models. If
tempera-5
tures increase as much as projected with the RCP 8.5, could any realistic precipitation change in the HKH compensate and maintain present-day snowfall? Results indicate that this may happen in parts of the upper Indus, but is out of the reach in the upper Brahmaputra. As for water availability, reduced snowfall may still cause more severe problems in the Indus than in the Brahmaputra.
10
In cold regions, where temperatures remain below freezing, more winter precipita-tion may increase both the snow cover area, the length of the snow season and the SWE (Collins et al., 2013; Brutel-Vuilmet et al., 2013; Räisänen, 2008; Gao et al., 2012; Wiltshire, 2014). Räisänen (2008) showed this to be the case in eastern Siberia and the northernmost part of North America. At the southern edge of the seasonal snow
15
cover, relevant for this study, precipitation did not compensate, and there was a reduc-tion in SWEWiltshire (2014) concluded that there would be small changes in snowfall in very cold and very warm regions of the HKH. Snowfall in Nepal, Bhutan and Hi-machal Pradesh, where winters are warmer than in most parts of the range, was most vulnerable to higher temperatures. The data presented in Sect. 4.2 generally support
20
the previous studies.
One of the reasons that precipitation does not compensate, is that the highest pro-jected precipitation increase in the HKH is seen in the summer, when the temperature today is so high that only the highest terrain is in the snow zone. Shifting the rain/snow line upward, even by only a few hundred meters, reduces the area that receives snow
25
TCD
9, 441–493, 2015Snowfall in the Himalayas: an uncertain future from
a little-known past
E. Viste and A. Sorteberg
Title Page
Abstract Introduction
Conclusions References
Tables Figures
◭ ◮
◭ ◮
Back Close
Full Screen / Esc
Printer-friendly Version
Interactive Discussion
Discussion
P
a
per
|
Discussion
P
a
per
|
Discussion
P
a
per
|
Discussion
P
a
per
little summer snowfall today, the reduction in summer snowfall is notable in all clusters in the MERRA data, in the Brahmaputra clusters also in APHRODITE.
The largest change in snowfall is seen in the western part of the Brahmaputra (clus-ter B4, Sect. 4.2.3), where a 400–500 m upward shift in the rain/snow line during sum-mer reduces the area with temperatures low enough for snowfall by a factor of 5–10
5
(Fig. 12a iv, values not shown). As a result, the summer peak in the seasonal cycle of snowfall is replaced by a dip (Fig. 12a ii). With an even distribution of precipitation with elevation, the area that still receives snow, would have to receive 5–10 times as much precipitation to compensate for the lost snowfall. Assuming, more realistically, that precipitation decreases above a certain height, would require an even higher
in-10
crease in precipitation. In the model with the highest increase, a doubling of the July precipitation by the end of the century, SWE is less than 25 % of today’s value in that month (Fig. 12a iii).
With a winter-dominated precipitation cycle, the relative change in snowfall is smaller in the upper Indus than in the upper Brahmaputra. Downscaling a high-emission
sce-15
nario (A1B) in two CMIP3 models with a regional model, Wiltshire (2014) found that by the 2080s, precipitation increased more than enough to compensate for higher temper-atures in the Karakoram, Hindu Kush and Jammu and Kashmir in one of the models, the HadCM3. In the other model, ECHAM5, precipitation increased less, and snow-fall increased only in the higher parts of the Karakoram. In our ensemble of CMIP5
20
models, multi-model mean precipitation in the upper Indus clusters increases mainly in the summer season, when the inter-model spread is also the largest (Fig. 11a iii and 11b iii). Among the models, 4–5 project increased winter precipitation in the upper Indus, and in the uppermost cluster, I5, this is associated with an increase in winter snowfall (Fig. 11b ii).
25
Although it is the part of the HKH where snowfall is least reduced by increasing temperatures (Fig. 10b), the Karakoram and inner parts of the upper Indus may still be
the region where the changes have the largest impact on river run-off. Compared to
TCD
9, 441–493, 2015Snowfall in the Himalayas: an uncertain future from
a little-known past
E. Viste and A. Sorteberg
Title Page
Abstract Introduction
Conclusions References
Tables Figures
◭ ◮
◭ ◮
Back Close
Full Screen / Esc
Printer-friendly Version
Interactive Discussion
Discussion
P
a
per
|
Discussion
P
a
per
|
Discussion
P
a
per
|
Discussion
P
a
per
much of the water in the rivers during summer is meltwater (Bookhagen and Burbank, 2010; Immerzeel et al., 2010). As melting of snow and ice has not been analyzed in
this study, we cannot quantify the effect of reduced snowmelt om river run-off, but it is
obvious that eventually, reduced snowfall will lead to reduced melting. In western parts of the HKH, this may lead to changes in the seasonal cycle of the river flow.
5
As pointed out by Wiltshire (2014), increasing precipitation in the eastern HKH im-plies that water resources are likely to increase with climate change. As snowfall and snowmelt are both at maximum during summer (Rees and Collins, 2006), meltwater does not have the same importance for river flow in dry parts of the year as in the In-dus. Reduced snowfall may reduce glaciers, but – not considering potential changes in
10
the amount of evaporation – there is no indication that there will be less water coming from the upper Brahmaputra.
5 Concluding summary
In this study we have presented a suite of estimates of present-day snowfall in the Indus, Ganges and Brahmaputra Basins; and the changes in snowfall that would follow
15
from CMIP5 projected changes in temperature and precipitation from 1971–2000 to 2071–2100. The results show that if the temperature increases as much as in the RCP 8.5, there will be much less snowfall, despite increasing precipitation in most of the region. Limiting anthropogenic forcing to the RCP 2.6 level would still cause reductions, though smaller.
20
Estimates of present-day snowfall based on a combination of temperature and pre-cipitation from reanalysis data and observations, vary by factors of 2–4. The MERRA reanalysis gives higher estimates than TRMM 3B42, CRU TS and APHRODITE; but
the spread is also large between the estimates based on the different observationally
based data sets. This demonstrates the difficulties in assessing vulnerability to climate
25
![Table 4. Annual snowfall estimates for the Indus, Ganges, and Brahmaputra Basins. S : snow [km 3 SWE]](https://thumb-eu.123doks.com/thumbv2/123dok_br/18449241.364062/40.918.50.653.247.506/table-annual-snowfall-estimates-indus-ganges-brahmaputra-basins.webp)