Perspectives on the AIDS Epidemic:
The Experience within the United States
THOMAS C. QUINN~
As of 13 June 1988 a cumulative total of 64,896 AIDS cases and 36,480 AlDS-related deaths had been reported to the Dnited States Centers for Disease Control (CDC). Of the 63,880 adults afflicted, 63% were homosexual or bisexual men; 19% were intra- venous drug users; 7% were homosexual men who were also I. R drug users; 4% were heterosexuals; 3% were blood transfusion recipients; 1% were hemophiliacs; and 3%
were people for whom risk factor information was incomplete. Of the 1,016 children with AIDS, 77% were born to a parent who had or was at risk for AIDS, 13% were
blood transfusion recipients, 6% were hemophiliacs, and 4% were children for whom risk factor information was incomplete. Serologic surveys have provided information regarding the extent of HIV infection in high-riskgroups. The number of AIDS cases projected through 1992 using the methods of extrapolation and back- calculation are 310,000 and 380,000 cases, respectively.
S
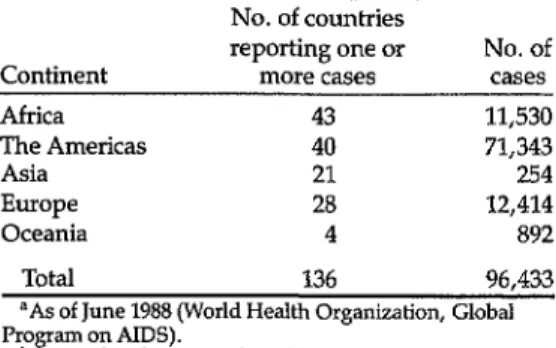
hortly after initial recognition of the acquired immunodeficiency syn- drome (AIDS) in the United States in 1981, additional cases were reported from Europe with similar clinical, immu- nologic, and epidemiologic features. By 1983-1984, it was apparent that AIDS was also present in some areas of Central Africa, the Caribbean, and South Amer- ica (2, 2). Since then AIDS has become a global pandemic, with 96,433 cases of AIDS from 136 countries being reported officially to the World Health Organiza- tion as of June 1988 (Table 1).Over 70,000 of these cases had been re- ported from 40 countries of the Americas, over 12,000 cases from 28 European countries, and over 11,500 from 43 Afri- can countries. The fact that slightly fewer than 900 cases had been reported from
‘Laboratory of Immunoregulation, National Insti- tute of Allergy and Infectious Diseases, Bethesda, Maryland, USA, and Johns Hopkins University School of Medicine and School of Public Health and Hygiene, Baltimore, Maryland. Mailing ad- dress: Johns Hopkins Hospital, 600 N. Wolfe St., BlaIock 1111, Baltimore, MD 21205, USA.
Oceania and only 254 cases had been re- ported from 21 Asian countries makes it appear possible that AIDS was intro- duced into these areas at a later time. In that case, given the right epidemiologic conditions, these areas could witness the same exponential increases in AIDS cases that other areas experienced during the first five years of the epidemic.
In some areas of the world, such as Af- rica, the official figures may be gross un- derestimates of the actual number of AIDS cases, due to inaccurate reporting arising from secondary weaknesses in health infrastructure and from difficulties with the CDClWHO case definition of AIDS (3) that typically requires sophisti- cated diagnostic equipment. However, using the limited serologic surveys and selected AIDS surveillance studies avail- able, the World Health Organization esti- mated in 1988 that there had been over 150,000 cumulative cases of AIDS world- wide, approximately 500,000 cases of in- dividuals with AIDS-related conditions, and five to ten million people asympto- matically infected with the etiologic agent
Table 1. Numbers of countries reporting AIDS cases to the World Health Organization and the numbers of cases reported, by continent .a,b
Continent
No. of countries reporting one or
more cases No. of cases
Africa 43 11,530
The Americas 40 71,343
Asia 21 254
Europe 28 12,414
Oceania 4 892
Total 136 96,433
aAs of June 1988 (World Health Organization, Global Pro
bF ee updated case numbers (through 31 January 1989) am on AIDS). on pp. 144-145.
of AIDS, the human immunodeficiency virus (HIV) (2). It is from this latter pool of asymptomatically infected individuals that additional cases of AIDS will eventu- ally develop, and from which thousands of additional individuals will be infected with HIV through sexual or parenteral exposure.
Unfortunately, it appears that the vast majority of infected individuals reside in developing countries, where the eco- nomic and social impact of this disease will be greatest. Furthermore, in the ab- sence ,.of any curative drug or effective vaccine, it is likely that the AIDS epi- demic will continue to spread, killing 80% of the diagnosed AIDS patients with- in two years of diagnosis and exerting its effects on the people of all countries.
Many issues have been raised concern- ing the future of the AIDS epidemic. There are uncertainties about how many people within a given population are in- fected with HIY how many will progress to symptomatic AIDS, whether drug in- tervention will delay AIDS fatalities, and whether educational efforts aimed at pre- vention and control of HIV infection will have a dramatic impact on slowing the spread of HIV and AIDS. There are also
questions as to whether the epidemio- logic features of HIV witnessed over the past several years will change, and what effect such changes might have on the overall distribution of AIDS cases.
For example, there is some evidence that the HIV epidemic has slowed among homosexual men-due either to satura- tion of the susceptible population or ad- herence to preventive measures such as “safe sex” recommendations. Similarly, there is some evidence that HIV infection and AIDS have increased among intrave- nous drug abusers, raising yet another set of questions regarding heterosexual transmission of HIV to the sexual part- ners of these individuals, possible in- creases in the numbers of infected women spreading HIV infection to new- borns via perinatal transmission, and eventual establishment of HIV infection as a sexually transmitted disease like syphilis, gonorrhea, or herpesvirus infection-thereby increasing the risk for promiscuous heterosexuals.
All of these issues have generated a great deal of debate and speculation that only time may be able to address. How- ever, given nearly a decade of experience to date with this viral infection, it is pos- sible to examine the available epidemio- logic data from some countries with an eye to making some reasonably valid pro- jections of epidemic trends over the next several years. These projections are needed to guide intensive educational and preventive control programs among selected high-risk populations, to plan fi- nancial assistance for medical research in some areas, and to conduct health plan- ning designed to meet the AIDS- generated demand for medical care. Within that context, this article reviews the currently available data on HIV infec- tion and AIDS in the United States, and presents some projections of the future of the AIDS epidemic there.
EPIDEMIOLOGIC FEATURES
OF AIDS IN THE U.S.
As of 13 June 1988, a cumulative total of 64,896 AIDS cases had been reported to the U.S. Centers for Disease Control (CDC); of those afflicted, 36,480 (56%) had died. Also, 26,200 of these cases had been reported in the preceding 12 months, representing a 71% increase over the previous year. (AIDS ranked eighth among all diseases in 1986 with respect to years of potential life lost be- fore age 65-4).
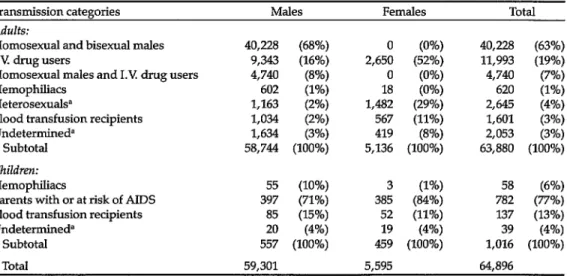
Most (63,880) of the 64,896 cases oc- curred among adults, 58,744 (92%) among men and 5,136 (8%) among women (Table 2). Homosexual and bisex- ual men accounted for 63% of these cases, intravenous drug users for 19%, and homosexual men who were also 1.V drug users for 7%. Three per cent of those afflicted had received blood trans- fusions contaminated with HIV, and 1% were hemophiliacs who had received in- fected factor 8 or factor 9 concentrates. Four per cent were heterosexuals who were either in sexual contact with people
who had AIDS or were at risk for AIDS, or else were born in countries where het- erosexual transmission of HIV is com- mon. The remaining 3% were patients for whom risk factor information was incomplete-because they had died, refused to be interviewed, were lost to follow-up, were still under investigation, were men reported to have had only het- erosexual contact with a prostitute, or were interviewed patients for whom no specific risk was identified.
Of the 1,016 children with AIDS, 77% were born to a parent who had AIDS or who was at risk of AIDS; 13% had re- ceived infected blood transfusions; and 6% were hemophiliacs who had received infected factor 8 or factor 9 concentrates. The remaining 4% included patients for whom risk information was incomplete.
Sixty-two per cent of the reported adult AIDS cases and 23% of the pediatric cases occurred among whites. Blacks ac- counted for 25% of the adult cases and 56% of the pediatric cases, while Hispan- ics accounted for 13% of the adult cases and 20% of the pediatric cases. Since blacks and Hispanics, respectively, ac-
Table 2. Cases of AIDS reported in the United States as of 13 June 1988, listed hierarchically.
Transmission categories Males Females Total
Adults:
Homosexual and bisexual males 40,228 (68%) 40,228 (63%)
1.V drug users 9,343 (16%)
2,65: (AZ;
11,993 (19%)
Homosexual males and 1.R drug users 4,740 (8%) 0 (0%) 4,740 (7%)
Hemophiliacs 602 (1%)
Heterosexuals? 1,163 (2%)
1,4ii (~~; 620 (1%)
2,645 (4%)
Blood transfusion recipients 1,034 (2%) 567 (11%) 1,601 (3%)
Undetermined” 1,634 (3%) 419 (8%) 2,053 (3%)
Subtotal 58,744 (100%) 5,136 (100%) 63,880 (100%)
Children:
Hemophiliacs 55 (10%)
Parents with or at risk of AIDS 397 (71%) 38; (ii:; 7:; ($E;
Blood transfusion recipients 85 (15%) 52 (11%) 137 (13%)
Undetermined” 20 (4%) 19 (4%) 39 (4%)
Subtotal 557 (100%) 459 (100%) 1,016 (100%)
Total 59,301 5,595 64,896
%e text for full description.
count for only 11.6% and 6.5% of the U.S. population, the percentages of AIDS cases among them are dispropor- tionately high, particularly for black and Hispanic women and children with AIDS. Overall, the relative risk of AIDS for blacks and Hispanics is two to ten times greater than for whites, suggesting that AIDS is becoming an increasing health problem for minorities-especially among inner-city populations where in- travenous drug abuse is common.
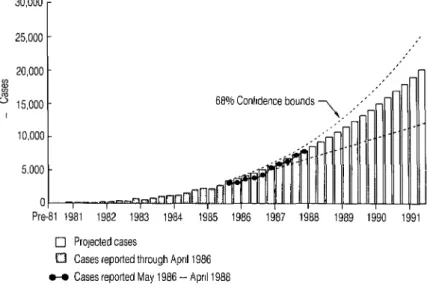
In 1986 the U.S. Public Health Service made a tentative projection of the num- ber of AIDS cases that might occur be- tween 1986 and 1991, a projection based on statistical extrapolation of trends and cases reported to the CDC through April 1986 (5). Specifically, it was predicted that a cumulative total of about 270,000 AIDS cases would be diagnosed by the end of 1991 using current surveillance cri- teria, and that these would have caused approximately 180,000 deaths (Figure 1). The actual number of cases diagnosed us-
30,000
1 25,000 -
20,000 - M I v 15,000 -
I
10,000
5.000 t 0
Pre-81 1981 1982 1983 1984 1985 1986 1987 1988 1989 1990 1991
0 ProJected cases
ing the foregoing criteria in 1986 and 1987 was 15,900 and 20,600, after adjusting for reporting delays. The total of these fig- ures amounted to 94% of the 15,800 and 23,000 cases that were foreseen by the projection (6). Incomplete reporting, re- porting delays, and recent changes in the AIDS case definition all affect the accu- racy of these projections, but it is clear that the projections closely approximated the actual number of cases reported through 1987. (Obviously, reporting de- lays, as well as changes in diagnostic practices and therapeutic regimens, must be carefully evaluated in interpreting fu- ture trends of reported AIDS cases.)
HIV INFECTION
While these AIDS case extrapolations are reliable for short-term projections, in seeking to make long-term projections it is important to understand the natural history of HIV infection and both the in- cidence and prevalence of HIV infection
68% Confidence bounds
q Cases reported through April 1986 O-O Cases reported May 1986 - April 1988
Figure 1. AIDS cases in the United States, showing projections through 1991 calculated from the known cases reported through April 1986 (adapted from ref. 6). Cases reported from May 1986 through April 1988 are shown for comparison.
7or
50
Years
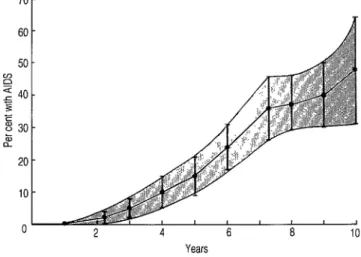
Figure 2. A Kaplan-Meier survival curve showing the pro- portions of homosexual men developing AIDS by esti- mated duration of HIV infection in the San Francisco City Cohort Study. The shaded area defines the 95% confidence interval (adapted from ref. 6).
in selected population groups. These sta- tistics are often hard to derive due to the complexities of screening and testing large populations for HlX as well as the difficulties involved in trying to follow these populations on an annual basis with repeated testing for HIV infection and AIDS case development.
However, properly conducted national seroprevalence surveys followed by se- roincidence surveys could provide im- portant information about many features relevant to the AIDS epidemic- including estimates of HIV infection rates and data on the relative importance of various kinds of transmission, types and frequencies of various sexual practices, and effects of various prevention and control efforts. More specifically focused serologic surveys could supplement these national surveys in order to more clearly define the natural history of HN the spread of HIV infection, and HIV risk factors in selected high-risk populations.
It is thought that retroviruses generally have long incubation periods between
the time of infection and the develop- ment of symptoms. In the case of HTV, the mean incubation period following in- fection from a blood transfusion has been estimated at 8.23 years for adults and 1.97 years for children under five years old (7). Another study (6) has estimated the mean incubation period of AIDS in homosexual men to be 7.8 years.
Perhaps the best cohort study from which incubation times can be extrapo- lated is the San Francisco City Clinic Co- hort Study. This investigation enrolled 6,700 homosexual and bisexual men in studies of hepatitis B virus infection be- tween 1978 and 1980. Since 1983 these men have been followed for the develop- ment of AIDS, and sera collected from them as early as 1978 have been analyzed retrospectively for HIV infection (8). It was found that after 88 months of known HIV infection, 36% of the infected study subjects had developed AIDS and over 40% had other signs and symptoms of HIV infection; only 20% remained com- pletely asymptomatic (Figure 2) (6).
It is clearly evident from this and other studies that the risk of disease progres- sion increases with the duration of infec- tion, and that a mean estimated incuba- tion period of eight years is probably conservative, an estimate closer to 10 years being more realistic.
A large number of serologic surveys on selected populations have provided im- portant information about the extent of HIV infection in these high-risk groups, and the CDC has recently reviewed the extent of HIV infection in the U.S. in an effort to estimate the number of infected individuals within the country (9). Many of the studies included in this CDC re- view differ in their sampling methods, in- clusion and exclusion criteria for study subjects, the rigor with which they ascer- tain risk information, and the resulting bias. Consequently, the results cannot al- ways be validly compared, and signifi- cant gaps exist in the information, How- ever, the review did manage to develop a description of the patterns and trends of HIV infection.
For homosexual men, over 50 surveys
in 22 cities in 15 states found HIV anti- body prevalences ranging from under 10% to 70%, with most prevalence rates being between 20% and 50% (Table 3) (9). The highest prevalences of HIV infection were found in cohorts of homosexual men in San Francisco; otherwise, the prevalences varied geographically, with- out major peaks in any one region.
The prevalence of HIV antibodies among 1.V drug users varied markedly by geographic region. Overall, 90 studies in 53 cities in 27 states and territories found rates ranging from 5040% of 1.V drug users in New York City, New Jersey, and Puerto Rico to less than 5% in most areas of the country not on the East Coast. Most data were obtained from sur- veys at drug abuse treatment facilities that treat mainly heroin addicts. Patients undergoing drug treatment are believed to represent only about 50% of the esti- mated 1.1 million 1.V drug users in the United States. While some evidence sug- gests that many of those not in treatment are habitual users who may have an even higher risk of HIV infection, an estimated
Table 3. U.S. Public Health Service estimates of HIV infection in the United States by population group, 1987.
Estimated size Approximate Estimated total
Population of population seroprevalence infected
People who are exclusively homosexual 2,500,OOO 20-25% 500,000-625,000
Others with homosexual contact, including
highly infrequent contact 2,500,000-7,500,OOO 5% 125,000-375,000
Regular I.V, drug users 900,000 25% 225,000
Occasional 1.V drug users 200,000 5% 10,000
People with hemophilia A 12,400 70% 8,700
People with hemophilia B 3,100 35% 1,100
Heterosexuals without specific identified
risks 142,000,000 0.021% 30,000
Others (heterosexual partners of people at high risk, heterosexuals born in Haiti and Central Africa, transfusion recipients,
etc.) 45,000-127,000a
Total 945,000-1,400,000
Source: Centers for Disease Control (9). See text for more details. =Five to ten percent of the total number infected in other groups.
200,000 intermittent users may have a lower prevalence of infection because of less frequent exposure to contaminated needles or equipment.
Regarding the estimated 15,500 per- sons with hemophilia, approximately 70% of the hemophilia A subjects tested and 35% of the hemophilia B subjects tested were seropositive.
Only a few studies have been per- formed that deal with people who are heterosexual partners of HIV-infected persons but who have no other identified risk factors for acquiring HIV infection. The prevalences of HIV infection ob- served among such groups range from under 10% to 60%. These wide ranges may reflect such things as different de- grees of infectiousness of the index in- fected partner, differences in the fre- quency or type of sexual exposure, the duration of infection in the index partner, coexisting infections such as genital ul- cers in one or both partners, or the clini- cal status of the index partner. Recent evidence suggests that infectiousness in- creases as the index partner’s immune system deteriorates (lo), and the relative efficiency of male-to-female versus female-to-male HIV transmission may also be an important factor in heterosex- ual infection. As yet there is insufficient information to definitively evaluate these differences (II).
Data from seroprevalence studies of the general U.S. population are even more limited, since these studies were only initiated in 1987. However, serologic screening of blood donors, civil appli- cants for military service, sexually trans- mitted disease (STD) clinic patients, new- born infants, women of reproductive age, and sentinel hospital patients has been under way for several years.
With respect to the highly selected po- pulation of blood donors, the prevalence of HIV infection was found to be 0.02% in
12.6 million American Red Cross blood donations made between April 1985 and May 1987 (9). (The overall level declined from 0.035% in mid-1985 to 0.012% in mid-1987, primarily as a result of elimi- nating previously identified seropositive people from the donor pool.) The overall prevalence among first-time donors in the period 1985-1987 was 0.043%.
Regarding military recruits, over 0.15% of 1,250,OOO military applicants screened between October 1985 and September 1987 were HIV seropositive (22). As in other surveys, HIV seroprevalence var- ied considerably with the subjects’ age, sex, racelethnicity, and geographic area of residence.
Concerning patients attending STD clinics, review of 23 studies from 16 states indicated that 1,047 (4.6%) of 22,624 clinic attendees were HIV seropositive (9). In general, the seropositivity rate was higher among men (6.6%) than among women (1.6%). Seropositivity rates ranged from 0.5% to 15.2%, reflecting in part the proportion of attendees who were homosexual or bisexual, 1.V drug users, or heterosexual partners of bisex- ual men or 1.V drug users.
In these studies, nearly 90% of all HIV- seropositive persons belonged to recog- nized risk groups. Surveys conducted in six cities found the seroprevalence in het- erosexual men and women without a his- tory of 1.V drug abuse or known sexual contact with persons at risk to range from 0% to 2.6%, depending upon the popula- tion studied and the interview method used (6, 9, 13).
To sample a non-self-selected general population, the CDC developed a net- work of sentinel hospitals in collabora- tion with the participating institutions in September 1986. Based on the first 8,668 test results, the overall prevalence of in- fection was 0.32% (9). Higher rates were documented in selected areas such as
Baltimore, Maryland, where over 5% of the emergency room patients studied were HIV-positive (14).
Another technique for determining lev- els of infection among sexually active women consists of filter-paper blood test- ing of newborns to measure maternal an- tibody passively transferred to the child. One study in Massachusetts found the weighted average prevalence of infection among 30,078 childbearing women to be 0.21% (9, 15), the prevalence varying from 0.09% for women delivering at sub- urban and rural hospitals to 0.80% for those delivering at inner-city hospitals. Additional information has been pro- vided by 27 studies of women in female health and childbearing settings. Among other things these studies (conducted in 19 cities in 12 states and territories) docu- mented infection in anywhere from 1% to 2.6% of study subjects in the New York City area and Puerto Rico.
Obviously, the epidemic of HIV infec- tion and AIDS cases is a composite of many individual, overlapping, smaller epidemics, each of which has its own dy- namics and time frame (6). Whereas the overall incidence of new infection as well as the incidence among certain sub- groups such as homosexual men and Red Cross blood donors may have declined slightly, in the absence of specific infor-
mation incidence rates cannot be as- sumed to have declined among all sub- groups or in all geographic areas. In fact, HIV infection rates among 1.V drug users and heterosexually active people appear to be increasing in localized areas such as inner cities, especially on the East Coast. (Two studies among originally seronega- tive 1.V drug users in the New York City area showed seroconversion in 3% and 19%, respectively, between 1985 and 1986.)
On the basis of the available data pre- sented in its review, the CDC estimated that the number of HIV-infected Ameri- cans ranged from 945,000 to 1,400,OOO (Table 3) (6). The major factors limiting the precision of this estimate are the un- known size of the population of homo- sexual and bisexual men, the unknown distribution by frequency and type of various risk-related practices within this population, and the unknown overall seroprevalence rate among the general heterosexual population without any specific identified risk (a rate estimated at 0.021% based on the rate of infection in military applicants with no identifiable risk factors).
While there is no substitute for care- fully obtained HIV antibody incidence and prevalence data, certain inferences can be derived from these past studies.
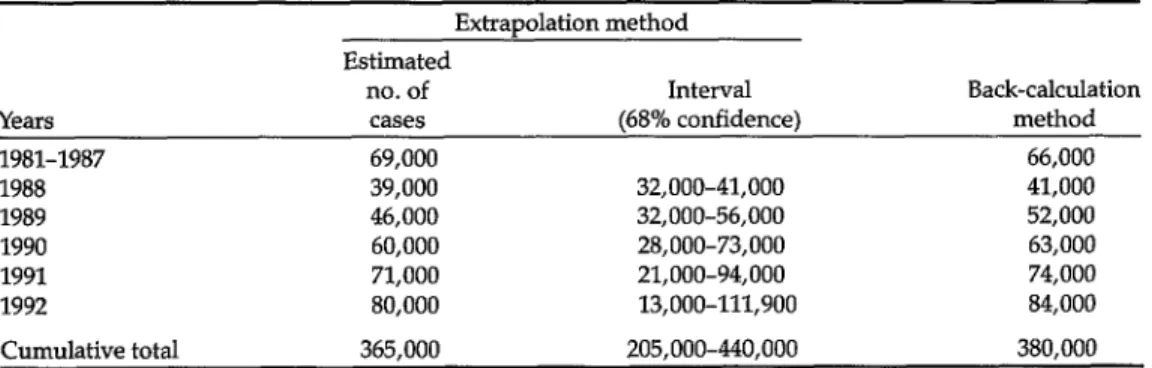
Table 4. AIDS case projections by year, 1988-1992.= Extiapolation method Estimated
no. of Interval Back-calculation
Years cases (68% confidence) method
1981-1987 69,000 66,000
1988 39,000 32,000-41,000 41,000
1989 46,000 32,000-56,000 52,000
1990 60,000 28,000-73,000 63,000
1991 71,000 21,000-94,000 74,000
1992 80,000 13,000-111,900 84,000
Cumulative total 365,000 205,000-440,000 380,000
aData provided by Mead Morgan, Ph.D., at the CDC (personal communication); and Ronald Brookmeyer, Ph.D , at Johns Hopkins University (personal communication).
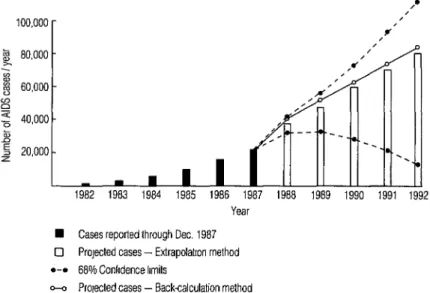
g 80,000 - -2
% cx 60,000 - P ; 40,000 - B
s 20,000 - z
Year
n Cases reported through Dec. 1967 0 Projected cases - Extrapolatron method
l -• 66% Confidence limits
- Projected cases - Back-calculation method
Figure 3. Revised projection of the number of AIDS cases anticipated in the United States through 1992, calculated from the known reported cases through 1987. The two projections shown were obtained using extrapolation and back-calculation (68% confidence limits for the pro- jection based on extrapolation are also shown). The expected numbers of cases predicted by the two methods are remarkably similar.
First, it seems clear that HIV infection is widely prevalent among selected high- risk groups in our society, such as homo- sexual and bisexual men, intravenous drug abusers, hemophiliacs, and hetero- sexual partners of these at-risk individ- uals. Second, while the incidence of HIV infection may be slowing in homosexual men, it is continuing to increase in intra- venous drug users and their heterosexual partners. Third, HIV infection rates ap- pear to be increasing among minority po- pulations, particularly in the inner cities along the Eastern Seaboard. Fourth, the natural history of HIV infection suggests that the mean incubation period from the time of infection to the time of develop- ing AIDS is at least eight to ten years.
Together, these facts indicate that the AIDS epidemic has not yet peaked, and that the number of AIDS cases is not likely to decline within the next several years. Rather, it appears that the number
of AIDS cases will continue to increase for at least five years and possibly longer. For even if we were 100% successful in preventing further transmission today, the number of AIDS cases would con- tinue to rise on an annual basis because of the large number of people already in- fected with HIV
AIDS PROJECTIONS
At a recent meeting of the U.S. Public Health Service, the number of AIDS cases were projected by year for 1988- 1992 using two methods. The first method, referred to as the extrapolation approach, statistically fit an empirical model to past trends and projected those trends into the future (5). This approach is reasonable because HIV’s long and variable incubation time yields a distribu- tion that will smooth trends and AIDS incidence even though the underlying
trends in HIV infection may be changing. The total number of cumulative cases projected through 1992 using the extrap- olation method was 365,000 (Table 4, Figure 3).
A second method, known as back- calculation, estimates future AIDS cases from the historical trends in HIV infec- tion, AIDS incidence data, and knowl- edge of the incubation time distribution assuming that those infected continue to develop AIDS according to that distribu- tion (16). Although the method as origi- nally proposed does not account for new infections (such as those occurring within two to three years), it gives reasonable near-term projections (two to three years) because of the long incubation time of HIV (Additional adjustments can also be made to allow for new infections.) Utiliz- ing the back-calculation method with the current estimate of infected people (Table 3), a cumulative total of 380,000 cases was estimated through 1992. It should be noted that the projected numbers of AIDS cases increased annually through- out the time period.
Each of these methods has certain lirni- tations. The extrapolation model is purely empirical and assumes that diag- nostic and reporting trends remain un- changed. The model does not depend upon or use quantitative data on the nat- ural history of HIV infection. Despite these limitations, over the past three years the model has performed well in projecting relatively short-term AIDS trends (e.g., the number of future cases arising in two years-Figure 1, 6).
In contrast, the back-calculation method requires accurate information about HIV’s incubation time distribution. Additional follow-up of selected cohorts is continually needed to more precisely estimate the shape of this distribution, and additional adjustments are required to account for new infections. While these matters have relatively little impact
on short-term projections, they become increasingly important over time irre- spective of the model used.
CONCLUSIONS
HIV infection and AIDS have become a major cause of morbidity and mortality in the United States. Since over a million U.S. residents are thought to be infected with HIV morbidity and mortality can be expected to increase over the next few years, and the number of AIDS cases will continue to rise. While the social and medical impact of this disease will be pro- found, with medical care alone costing billions of dollars, the greatest tragedy will be the loss of thousands upon thou- sands of lives.
Although this article concerns itself with the HIV/AIDS problem in the United States, that problem is common to all nations; and it is only through a united international effort that we can hope to control the disease and prevent further transmission. Basic control actions-including professional and pub- lic education, risk-behavior reduction in the high-risk groups, and screening of blood supplies-can be implemented, but the obstacles to complete control remain pervasive in our political societies. Fur- ther information about the magnitude of HIV infection and HIV incidence rates within many populations, and updating of projections of infection, disease, and mortality by the use of updated mathe- matical models should help convince po- litical and medical authorities, as well as the general public, about the overall im- pact of this disease on our society.
REFERENCES
1. Quinn, T. C., J. M. Mann, J. W. Curran, and I? Rot. AIDS in Africa: An epidemio- logic paradigm. Science 234:955-963,1986. 2. Rot, I’., F. A. Plummer, F. S. Mhalu, J. L.
Chin, and J. M. Mann. AIDS: An interna- human immunodeficiency virus (HIV) tional perspective. Science 239:573-579, (editorial). Ann Intern Med 107:763-768,
1988. 1987.
3. World Health Organization. Acquired im- munodeficiency syndrome (AIDS): CDCI WHO case definition for AIDS. Weekly Epidemiol Ret 61:69-73,1986.
4. United States Centers for Disease Con- trol. Table V: Estimated years of potential life lost (YELL) before age 65 and cause- specific mortality, by cause of death- United States, 1986. MMWR 37:163,1988. 5. Morgan, W. M., and J. W. Curran. Ac-
quired immunodeficiency syndrome: Current and future trends. Public Health Rep 101:459-465,1986.
11. Peterman, T. A., R. L. Stoneburner, J. R. AIIen, H. W. Jaffe, and J. W. Curran. Risk of HIV transmission from heterosexual adults with transfusion-associated infec- tions, JAMA 259:55-58,1988.
6. Curran, J. W., H. W. Jaffe, A. M. Hardy, W. M. Morgan, R. M. SeIik, and T. J. Don- dero. Epidemiology of HIV infection and AIDS in the United States. Science 239:610-616,1988.
12. Burke, D. S., J. F. Brundage, J. R. Her- bold, W. Bemer, L. I. Gardner, J. D. Gu- zenhauser, J. Voskovitch, and R. R. Red- field. Human immunodeficiency virus (HIV) infections among civilian applicants for United States military service, October 1985 to March 1986: Demographic factors associated with seropositivity. N Engl J Med 317:131-136,1987.
7. Medley, G. F., R. M. Anderson, D. R. Cox, and L. BiIIard. Incubation period of AIDS in atients infected via blood trans- fusion. J ature 328:719-721, 1987.
8. Jaffe, H. W., W. W. Darrow, D. F. Echen- berg, I? M. O’MaIIey, J. I? GetcheII, V S. KaIyanaraman, R. H. Byers, D. I? Dren- nan, E. H. Braff, and J. W. Curran. The acquired immunodeficiency syndrome in a cohort of homosexual men: A six-year follow-up study. Ann Intern Med 103:210- 214,1985.
13. Quinn, T. C., D. Glasser, R. 0. Cannon, 0. L. Matuszak, R. W. Dunning, R. L. Kline, C. H. Campbell, E. Israel, A. S. Fauci, and E. W. Hooks. Human immuno- deficiency virus infection among patients attending clinics for sexually transmitted diseases. N Engl T Med 318:197-203,1988. 14. Kelen, G. D., S. Fritz, B. Qadish, R.
Brookmeyer, J. L. Baker, R. L. Kline, R. M. Cuddy, T. K. Goessel, D. J. FIoccare, K. T Sivertson, S. Ahman, and T. C. Quinn. Unrecognized human immunode- ficiency virus infection in emergency de- partment patients. N Engl J Med 318:1645- 1650,1988.
9. United States Centers for Disease Con- trol. Human immunodeficiency virus in- fection in the United States: A review of current knowledge. MMWR 36:1-48, 1987.
10. Chamberland, M. E., and T. J. Dondero. Heterosexually acquired infection with
15. Marwick, C. HIV antibody prevalence data derived from study of Massachusetts infants. JAA4A 258:171-172,1987.
16. Brookmeyer, R., and M. H. Gail. A method for obtaining short-term projec- tions and lower bounds on the size of the AIDS epidemic. J Am Stat Assoc 83:301- 308,1988.