HESSD
11, 1777–1820, 2014Tarim River Basin of Western China
Z. Zhang et al.
Title Page
Abstract Introduction
Conclusions References
Tables Figures
◭ ◮
◭ ◮
Back Close
Full Screen / Esc
Printer-friendly Version Interactive Discussion
Discussion
P
a
per
|
D
iscussion
P
a
per
|
Discussion
P
a
per
|
Discuss
ion
P
a
per
|
Hydrol. Earth Syst. Sci. Discuss., 11, 1777–1820, 2014 www.hydrol-earth-syst-sci-discuss.net/11/1777/2014/ doi:10.5194/hessd-11-1777-2014
© Author(s) 2014. CC Attribution 3.0 License.
Hydrology and Earth System
Sciences
Open Access
Discussions
This discussion paper is/has been under review for the journal Hydrology and Earth System Sciences (HESS). Please refer to the corresponding final paper in HESS if available.
Groundwater Dynamics under Water
Saving Irrigation and Implications for
Sustainable Water Management in an
Oasis: Tarim River Basin of Western
China
Z. Zhang1, H. Hu1, F. Tian1,*, X. Yao2, and M. Sivapalan3
1
State Key Laboratory of Hydroscience and Engineering, Department of Hydraulic Engineering, Tsinghua University, Beijing 100084, China
2
Xinjiang Tarim River Basin Management Bureau, Bayangol Prefecture, Xinjiang 841000, China
3
Department of Civil and Environmental Engineering, Department of Geography and Geographic Information Science, University of Illinois at Urbana-Champaign, Urbana, IL 61801, USA
*
now at: State Key Laboratory of Hydroscience and Engineering,
HESSD
11, 1777–1820, 2014Tarim River Basin of Western China
Z. Zhang et al.
Title Page
Abstract Introduction
Conclusions References
Tables Figures
◭ ◮
◭ ◮
Back Close
Full Screen / Esc
Printer-friendly Version Interactive Discussion
Discussion
P
a
per
|
D
iscussion
P
a
per
|
Discussion
P
a
per
|
Discuss
ion
P
a
per
|
Received: 18 January 2014 – Accepted: 31 January 2014 – Published: 10 February 2014
Correspondence to: F. Tian ([email protected])
HESSD
11, 1777–1820, 2014Tarim River Basin of Western China
Z. Zhang et al.
Title Page
Abstract Introduction
Conclusions References
Tables Figures
◭ ◮
◭ ◮
Back Close
Full Screen / Esc
Printer-friendly Version Interactive Discussion
Discussion
P
a
per
|
D
iscussion
P
a
per
|
Discussion
P
a
per
|
Discuss
ion
P
a
per
|
Abstract
Water is essential for life. Specifically in the oases of inland arid basins, water is a critically limited resource, essential for the development of socio-economy and sustain-ability of eco-environmental systems. Due to the unique hydrological regime present in arid oases, a moderate groundwater table is the goal of sustainable water
manage-5
ment. A shallow water table induces serious secondary salinization and collapse of agriculture, while a deep water table causes deterioration of natural vegetation. From the hydrological perspective, the exchange flux between unsaturated vadose zone and groundwater reservoir is a critical link to understand regional water table dynamics. This flux is substantially influenced by anthropogenic activities. In Tarim River Basin of
10
western China, where agriculture consumes over 90 % of available water resources, the exchange flux is influenced strongly by irrigation. Recently, mulched drip irriga-tion, a very advanced water-saving irrigation method, has been widely applied in the Tarim River Basin, which greatly impacted the exchange flux and thus the regional groundwater dynamics. Capitalizing on recent progress in evaporation measurement
15
techniques, we can now close the water balance and directly quantify the exchange flux at the field scale, thus gain a better understanding of regional groundwater dy-namics. In this study, comprehensive observations of water balance components in an irrigated cropland were implemented in 2011 and 2012 in a typical oasis within Tarim River Basin. The water balance analysis showed that the exchange flux and
ground-20
water dynamics were significantly altered by the application of water-saving irrigation. The exchange flux is mostly downward (310.5 mm yr−1), especially during drip irrigation period and spring flush period, while the upward flux is trivial (−16.1 mm yr−1) due to the moderate groundwater table depth (annual average depth 2.9 m). Traditional sec-ondary salinization caused by intense phreatic evaporation (fed by upward exchange
25
HESSD
11, 1777–1820, 2014Tarim River Basin of Western China
Z. Zhang et al.
Title Page
Abstract Introduction
Conclusions References
Tables Figures
◭ ◮
◭ ◮
Back Close
Full Screen / Esc
Printer-friendly Version Interactive Discussion
Discussion
P
a
per
|
D
iscussion
P
a
per
|
Discussion
P
a
per
|
Discuss
ion
P
a
per
|
used in further growth of irrigated lands instead of supporting ecological system. This would lead to increasing risk of eco-environmental degradation and calls for improved governance schemes. The insights gained from this study can be potentially applied to other arid inland areas (e.g., central Asia, sub-Saharan Africa) which face similar water shortages and human development problems.
5
1 Introduction
According to the FAO (http://www.fao.org/docrep/t0122e/t0122e03.htm), one third of the world’s total land area is classified as arid. In these arid regions, the limits to water availability make water a critical factor in socio-economic development (Hanasaki et al., 2013). Agriculture in arid regions greatly relies on irrigation and in addition the delicate
10
natural ecosystem is also vulnerable due to exacerbation of water scarcity by human extraction (Shen and Chen, 2010). Recently, water scarcity is becoming more acute all over the world due to the effects of both climate change and population growth, further
aggravating the water problems, especially in arid regions (Xu et al., 2010). Water-saving irrigation, as one approach to mediate water conflicts between humans and
15
nature, has been popularized in many arid regions (Christen et al., 2007; Ibragimov et al., 2007; Scanlon et al., 2010). However, it is still not clear how water-saving irrigation alters overall water balance dynamics and, in the long term, affects the evolution of
human-water systems. There is also concern about whether sustainable development can be maintained by the application of water-saving irrigation, and what additional
20
steps we should take to implement better water management in the future. The Tarim River Basin in Western China provides an excellent case study to generate insights into all of the above questions.
The Tarim River Basin (TRB) is the largest inland basin of China. It is also a typi-cal hyper-arid basin in Central Asia, itself one of the biggest arid zones of the world.
25
HESSD
11, 1777–1820, 2014Tarim River Basin of Western China
Z. Zhang et al.
Title Page
Abstract Introduction
Conclusions References
Tables Figures
◭ ◮
◭ ◮
Back Close
Full Screen / Esc
Printer-friendly Version Interactive Discussion
Discussion
P
a
per
|
D
iscussion
P
a
per
|
Discussion
P
a
per
|
Discuss
ion
P
a
per
|
(>2000 mm yr−1) (Xu et al., 2010). As a home to an ancient human civilization dating back thousands of years, water has always played a key role in the growth and evolu-tion of human settlements within TRB (Xu et al., 2004). The Silk Road which connected the ancient Eastern and Western Worlds more than 2000 yr ago passed through TRB, and changing hydrologic conditions contributed to fluctuations of prosperity in the cities
5
scattered along its path. The Lolan civilization collapsed around the 7th century AD when the lower reaches of the Tarim River became dry (Liu et al., 2013). Lopliks, who were the native inhabitants of the TRB, and were dependent on fishing and grazing for their living, migrated many times with the river as it periodically changed its course. Nowadays, about 10 million people live in the oases located along the river banks and
10
in the alluvial plains downstream of the TRB (Zhang et al., 2010).
TRB remains an agricultural society, with agriculture accounting for more than 90 % of all water consumption (Shen and Chen, 2010). However, oases continue to play an important role in the societal and economic development within the TRB. Since the 1950s, the hydrologic system has been significantly disturbed by the expansion
15
of irrigation in this region (Xu et al., 2007; Zhang et al., 2012). An ambitious plan for wasteland reclamation within TRB was conducted by the Chinese central government and as a result the areal extent of the oases began to sharply increase (Bruelheide et al., 2003). Water consumption also rapidly increased, associated with the extensive wasteland reclamation and increased human population. More water had been
ex-20
tracted from the river for flood irrigation, a traditional form of irrigation, which resulted in negative long-term consequences. A continuous drying-up of the mainstream of the Tarim River has occurred since 1972 and natural vegetation has seriously degraded due to the drawdown of groundwater table within the riparian areas (Shen and Chen, 2010). Soil salinization induced by the intense phreatic evaporation under the shallow
25
HESSD
11, 1777–1820, 2014Tarim River Basin of Western China
Z. Zhang et al.
Title Page
Abstract Introduction
Conclusions References
Tables Figures
◭ ◮
◭ ◮
Back Close
Full Screen / Esc
Printer-friendly Version Interactive Discussion
Discussion
P
a
per
|
D
iscussion
P
a
per
|
Discussion
P
a
per
|
Discuss
ion
P
a
per
|
salinization (Ma et al., 2010). Mulched drip irrigation (MDI), a new micro-irrigation ap-proach incorporating surface drip irrigation and the film mulching technique, has been widely adopted by local farmers. It is therefore crucial to understand the impacts of irri-gation, including the transformation of irrigation methods from flood irrigation to water-saving drip irrigation, on the regional groundwater table dynamics, which is bound to
5
further influence agricultural development and ecological system health within TRB. The key control on regional water table dynamics is the Exchange Flux (EF), which is defined as the water flux into or out of the lower boundary of the soil control volume representing the vadose zone (Tang et al., 2007a; Timms et al., 2012). Since EF is substantially influenced by irrigation and the conversion from flood irrigation to drip
10
irrigation, any study of groundwater table dynamics in this region requires that EF be appropriately quantified under these different circumstances.
Water balance analysis is a widely adopted approach to quantify components of the water balance equation that cannot otherwise be directly measured (Evett et al., 2012; Tang et al., 2007b; Tennakoon and Milroy, 2003; Wilson et al., 2001). The method lends
15
itself to the estimation of EF between the vadose zone and the groundwater table. In general, EF can be directly quantified by water balance analysis, provided that all other components in the water balance equation are known. In the past it has been difficult
to obtain the rates of all components to close the water balance equation, especially evapotranspiration (Allen et al., 2011). However, due to the recent rapid progress in
20
measurement of evaporation, EF between the vadose zone and groundwater table can now be quantified directly by means of water balance analysis at the field scale, which can then be used to gain improved understanding of regional groundwater dynamics.
In this paper, we present the results of comprehensive measurements and water balance analyses carried out within the irrigated cropland area associated with the
25
HESSD
11, 1777–1820, 2014Tarim River Basin of Western China
Z. Zhang et al.
Title Page
Abstract Introduction
Conclusions References
Tables Figures
◭ ◮
◭ ◮
Back Close
Full Screen / Esc
Printer-friendly Version Interactive Discussion
Discussion
P
a
per
|
D
iscussion
P
a
per
|
Discussion
P
a
per
|
Discuss
ion
P
a
per
|
draw inferences regarding the impacts of anthropogenic activities, especially the con-version from flood irrigation to drip irrigation, on regional groundwater table dynamics.
This paper is organized as follows: Sect. 2 provides a detailed description of the Kaidu-Kongqi River Basin. The hydrologic characteristics and anthropogenic activities within this basin are introduced there. Section 3 presents the methods and instruments
5
used as part of the comprehensive measurement system. The methodology for anal-ysis of water balance and groundwater dynamics is then proposed. The results of the study are presented in Sect. 4, including seasonal and annual water balances and groundwater dynamics within the irrigated cropland. Based on the results, in Sect. 5 we discuss nature of human-water interactions within the oases of inland arid basins
10
and the anthropogenic effects on groundwater, with the conclusions being presented
in Sect. 6.
2 Description of Tarim River and Kaidu-Kongqi River Basins
In general, the TRB is comprised of 114 rivers, forming 9 drainage systems including the Aksu, Hetian, Yarkand, Qarqan, Keriya, Dina, Kaxgar, Weigan, and Kaidu-Kongqi
15
Rivers, with a total drainage area amounting to 1.02×10⁶km2(Chen et al., 2010). The mainstream of Tarim River is 1321 km long, flowing west to east along the northern edge of Taklimakan Desert, the largest desert of China. Since the 1950s, many tribu-taries have lost the surface hydraulic connection to the mainstream due to intense wa-ter extraction and consumption. At present, only four headwawa-ter streams, Aksu River,
20
Yarkand River, Hetian River, and Kaidu-Kongqi River, feed the mainstream of the Tarim River (Fig. 1). Except for the Kaidu-Kongqi River, the other three headwater streams di-rectly flow into the mainstream at the upper reaches of the Tarim River, with the annual surface runoffof 4.6×10⁹m3at the confluence.
The Kaidu-Kongqi River naturally fed into the mainstream of the Tarim River at
25
HESSD
11, 1777–1820, 2014Tarim River Basin of Western China
Z. Zhang et al.
Title Page
Abstract Introduction
Conclusions References
Tables Figures
◭ ◮
◭ ◮
Back Close
Full Screen / Esc
Printer-friendly Version Interactive Discussion
Discussion
P
a
per
|
D
iscussion
P
a
per
|
Discussion
P
a
per
|
Discuss
ion
P
a
per
|
with the mainstream, aggravating the ecosystem degradation in the lower reaches of the Tarim River (Xu et al., 2007). Recently, in an attempt to restore the degraded ecosystem downstream, the Chinese government initiated project “eco-water diver-sion”, aimed at conveyed water from the Kaidu-Kongqi River to the Tarim River by arti-ficial canals (Kuta Canal). Since 2000 this project has been activated 14 times, and to
5
date approximately 4.2×10⁹m3of water in total has been released into the Tarim River (http://tahe.gov.cn/zhuanti/shushui/shouye.html). As a result of the water conveyance project, the groundwater table along the Tarim River bank has risen from 6–8 m to now 2–4 m, and the natural vegetation in the riparian areas has begun to recover (Chen et al., 2010).
10
Hydrologically, the Kaidu-Kongqi River Basin (KKRB) is one of the typical inland basins, with a drainage area of 8.9×10⁴km2 (Gao et al., 2008; Xia et al., 2003) (Fig. 1b). Most of the water resources within KKRB originate from snow/glacier melt and rainfall in mountainous areas of the southern Tianshan Mountains. Glacier and snow melt are concentrated in the months of April and May (Zhang et al., 2007). Most
15
rainfall happens in the middle and lower mountainous areas with the annual value of 268 mm, and concentrated in the months of May to August, contributing to 57–70 % of the annual rainfall amount (Li et al., 2012). The precipitation decreases when the ele-vation decreases (Wang et al., 2012). Most rainfall and melting glacier/snow flow into the Kaidu River as surface water, while the remainder supplies the groundwater aquifer
20
and flows into the alluvial plains as subsurface flow. The Kaidu River flows through the middle and lower mountainous areas and alluvial plains, and finally reaches Bosten Lake. Annual runoffof the Kaidu River is 3.41×10⁹m3(Wang et al., 2013). The
contri-butions of rainfall and snow/glacier melt to the total runoffare 85 and 15 %, respectively
(Gao and Yao, 2005).
25
Bosten Lake is the largest inland freshwater lake in China, with the total volume of 8.8×10⁹m3(Wan et al., 2006). It is the final destination of the Kaidu River and also the source of the Kongqi River. The annual runoff of Kongqi River is 1.19×10⁹m3, 80 %
HESSD
11, 1777–1820, 2014Tarim River Basin of Western China
Z. Zhang et al.
Title Page
Abstract Introduction
Conclusions References
Tables Figures
◭ ◮
◭ ◮
Back Close
Full Screen / Esc
Printer-friendly Version Interactive Discussion
Discussion
P
a
per
|
D
iscussion
P
a
per
|
Discussion
P
a
per
|
Discuss
ion
P
a
per
|
Lop Nor before the 1950s, but the downstream dried up after large scale reclamation of wasteland within KKRB. Oases are clustered along the Kaidu and Kongqi Rivers in the alluvial plain and the annual precipitation is approximately 60 mm only. Humans settled down in these oases and extracted water from the river for agricultural, industrial and domestic use (Feng et al., 2000). In the desert areas precipitation is rarer and ranged
5
from 10 to 40 mm only. Annual evapotranspiration within the irrigated fields is about 630 mm based on the measurements carried out as part of this study.
In general, as in the case of other typical inland basins, the KKRB basin can be divided into three parts: the upstream part in the mountains can be regarded as the flow accumulation zone, the middle stream part in the alluvial plains is the primary zone of
10
water usage and consumption by anthropogenic activities, and the downstream desert part is where runoffdisappears through evaporation and infiltration (Wang and Cheng,
2000).
Within the KKRB, agriculture greatly depends on irrigation, which accounts for 96.2 % of all water consumption (Zhang, 2012). Irrigation water is mainly diverted from the
15
Kaidu-Kongqi River in the amount of 1.76×10⁹m3 in 2011 and the irrigated area is up to 206.3×10³ha in this year. Cotton is the most important economic crop grown within KKRB and cotton fields occupy more than 50 % of the total agricultural area (the statistical Yearbook of Tarim River Basin, Yearbook hereafter). In 2010, the fraction of water-saving irrigated area to the total irrigated area is more than 54 % within KKRB,
20
with mulched drip irrigation being the most extensive (Yearbook). The process of con-version from traditional flood irrigation to modern water-saving irrigation is still ongo-ing. With the wide application of water-saving irrigation, the irrigation quota during the growth period is 854 mm in 2011 (Yearbook). The fraction of area salinized to the total agricultural area is approximately 60 % (Xia et al., 2003; Zhang, 2012). To mitigate soil
25
HESSD
11, 1777–1820, 2014Tarim River Basin of Western China
Z. Zhang et al.
Title Page
Abstract Introduction
Conclusions References
Tables Figures
◭ ◮
◭ ◮
Back Close
Full Screen / Esc
Printer-friendly Version Interactive Discussion
Discussion
P
a
per
|
D
iscussion
P
a
per
|
Discussion
P
a
per
|
Discuss
ion
P
a
per
|
vegetation degradation and soil salinization are severe due to the large-scale irrigation in KKRB, which also applies to the whole Tarim River Basin (Zhang, 2012). Scien-tific and optimized water management should be conducted to maintain a moderate groundwater table depth in order to address these problems. Analysis of exchange flux and regional groundwater table dynamics analysis are possible approaches to
gener-5
ate valuable information and insights for further sustainable water management in this region.
3 Methods and materials
3.1 Field experimental site and cotton planting
The field experimental site (86◦12′E, 41◦36′N, 886 m a.s.l.; see Fig. 1a) is located in
10
one of the oases scattered in the alluvial plain of the Kaidu-Kongqi River Basin. The ex-perimental field has an area of 3.48 ha, and cotton (Gossypium hirsutum L.) is planted under mulched drip irrigation. The surrounding fields have the same cotton planting and irrigation conditions as the experimental field, which ensures the measurements can represent typical irrigated cropland conditions in this region. In the experimental
15
site, the mean annual precipitation is approximately 60 mm, whereas the mean annual potential evaporation measured by a Φ20 evaporation pan is 2788 mm. The annual
mean temperature is 11.48◦C, and the annual total sunshine duration is 3036 h, which is favorable for cotton growth.
Within KKRB, cotton is planted in April and harvested from September to November.
20
The style of cotton planting and drip pipe arrangement is referred to as the “one pipe, one film, and four rows of cotton arrangement” (Hu et al., 2011), which means that one drip pipe beneath the film is located in the middle of four rows of cotton. The width of film is 110 cm, and the inter-film zone is 40 cm. The cotton seeds are sown at 0.1 m intervals in each row to yield an anticipated population of 260 000 plants ha−1. But
HESSD
11, 1777–1820, 2014Tarim River Basin of Western China
Z. Zhang et al.
Title Page
Abstract Introduction
Conclusions References
Tables Figures
◭ ◮
◭ ◮
Back Close
Full Screen / Esc
Printer-friendly Version Interactive Discussion
Discussion
P
a
per
|
D
iscussion
P
a
per
|
Discussion
P
a
per
|
Discuss
ion
P
a
per
|
the emergence rates are usually about 60 % due to sandstorm and freezing damage, resulting in the actual plant density of only about 160 000 plants ha−1.
3.2 Data and measurements
The field experiment was conducted from April 2012 to September 2013. A stationary tower was erected in the middle of the experimental field to mount an eddy covariance
5
(EC) system, which is known as a reliable method for obtaining direct field ET mea-surements (Baldocchi et al., 2001). At this site, EC system consists of a fast response open-path infrared gas (H2O and CO2) analyzer (model EC150, Campbell Scientific Inc., Logan, UT, USA), a fast response 3D sonic anemometer (model CSAT3, Campbell Scientific Inc., Logan, UT, USA), an air temperature/humidity sensor (model HMP155A,
10
Vaisala Inc., Woburn, MA, USA), and a micro-logger (model CR3000, Campbell Scien-tific Inc., Logan, UT, USA). Since the maximum height of crop is 70 cm, the EC system was installed 2.25 m above the ground level to maintain the appropriate footprint. The CSAT3 sensor was oriented towards the predominant wind direction with an azimuth angle of 50 degrees from true north.
15
Energy balance closure is used to evaluate the reliability of eddy covariance (EC) measurements (Foken, 2008). Net radiation (Rn) was measured at a height of 2.25 m
(model LITE2, Kipp & Zonen, Delft, the Netherlands). Meanwhile, two soil heat flux plates (model HFP01SC, Hukseflux, The Netherlands) were placed 0.05 m below the ground surface in the film-mulched zone and inter-film zone, respectively, to obtain
20
the soil heat flux (G). Using all valid half-hourly data in 2012 and 2013 (data points, n=21 886), the slope between the available energy flux (Rn-G) and the sum of
sensi-ble (H) and latent heat fluxes (LE) for this site was 0.72, the intercept was 12.59 W m−2, and the coefficient of determination (r2) was 0.90. Based on the previously obtained
slope values of 0.53–0.99 for the energy closure (Wilson et al., 2002), these
perfor-25
HESSD
11, 1777–1820, 2014Tarim River Basin of Western China
Z. Zhang et al.
Title Page
Abstract Introduction
Conclusions References
Tables Figures
◭ ◮
◭ ◮
Back Close
Full Screen / Esc
Printer-friendly Version Interactive Discussion
Discussion
P
a
per
|
D
iscussion
P
a
per
|
Discussion
P
a
per
|
Discuss
ion
P
a
per
|
A rain gauge, a groundwater well, and two profiles for soil water content (SWC) measurements were set up around the tower. Precipitation was measured by a tip-ping bucket rain gauge (model TE525MM, Campbell Scientific Inc., Logan, UT, USA) which was mounted at 0.7 m above the ground. Groundwater table level was mea-sured using an automatic water depth sensor (model HOBO U20 Titanium Water Level
5
Data Logger, Onset Computer Corporation, Inc., Pocasset, MA, USA) installed in this groundwater well. More than 30 soil sensors (three models, i.e., Hydra Probe, Stevens Water Monitoring System, Inc., Beaverton, OR, USA; Digital TDT, Acclima Inc., Merid-ian, ID, USA; CS616, Campbell Scientific Inc., Logan, UT, USA) were placed in the film-mulched zone and inter-film zone in two profiles, respectively. The SWC were
10
measured at 0.05, 0.10, 0.15, 0.20, 0.30, 0.40 0.50 0.60 and 0.90 m depth below the ground by these sensors and stored every 1 h. In order to measure SWC in the zones deeper than 90 cm, soil samples were collected once a month with 10 replica-tions using an auger (model Auger Edelman combination 5cm, Eijkelkamp Agrisearch Equipment, Giesbeek, The Netherlands) from the boreholes. The samples were
ob-15
tained both from the film-mulched and inter-film zones, respectively at the depths of 100, 120, and 150 cm. The SWC for the soil sample was determined using the gravi-metric method.
The drip irrigation amount was measured by water meters installed on the branch pipes of the drip irrigation system whereas the periodic flush amounts were obtained
20
HESSD
11, 1777–1820, 2014Tarim River Basin of Western China
Z. Zhang et al.
Title Page
Abstract Introduction
Conclusions References
Tables Figures
◭ ◮
◭ ◮
Back Close
Full Screen / Esc
Printer-friendly Version Interactive Discussion
Discussion
P
a
per
|
D
iscussion
P
a
per
|
Discussion
P
a
per
|
Discuss
ion
P
a
per
|
3.3 Methodology
3.3.1 Water balance analysis
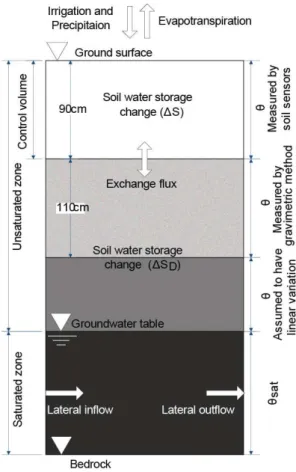
The water balance of a typical control volume within the irrigated cropland area (e.g., a cylindrical soil column of unit surface area and depth extending to the water table) can be written as follows (Evett et al., 2012):
5
I+P =ET+EF+R+FL+ ∆S (1)
whereI is irrigation;P is precipitation; ET is evapotranspiration; EF is exchange flux
(EF) at the lower boundary of the control volume;∆S is the change of soil water stor-age in the control volume and is calculated from the differences in soil water content
at the beginning and end of the period under consideration;R is the sum of runofffor
10
the control volume; andFL is the lateral flow in the control volume. I,P, ∆S, ET are
measured at this site as described in Sect. 3.2. Due to the rare precipitation and limited amount of drip irrigation, runoff R is expected to be zero to negligible during the
cal-culation.FL can also be ignored in this study because the control volume was always
above the groundwater table andFLwas trivial within the control volume.
15
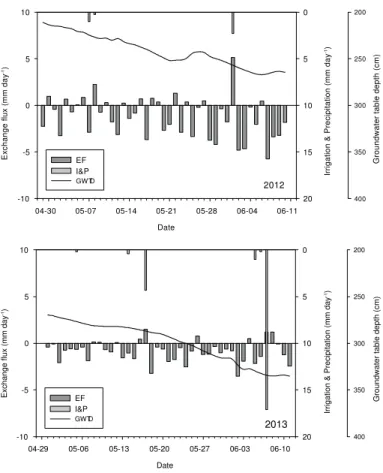
Based on the measurements from this study and using Eq. (1), daily EF at 90 cm depth can be calculated as rainfall and irrigation minus evapotranspiration and change in soil storage (Fig. 2). The seasonal and annual trends of EF were obtained based on the daily water balance analysis during the experimental period. This method is expected to provide reliable estimates of EF since the other four items of the water
20
balance equation were relatively well gauged at this site and this measurement site well represents the surrounding vegetated environment and water availability.
3.3.2 Groundwater table dynamics
Groundwater is replenished by both local recharge and regional (lateral) flow (Tang et al., 2007b). The local recharge includes the drainage directly from canals and rivers,
HESSD
11, 1777–1820, 2014Tarim River Basin of Western China
Z. Zhang et al.
Title Page
Abstract Introduction
Conclusions References
Tables Figures
◭ ◮
◭ ◮
Back Close
Full Screen / Esc
Printer-friendly Version Interactive Discussion
Discussion
P
a
per
|
D
iscussion
P
a
per
|
Discussion
P
a
per
|
Discuss
ion
P
a
per
|
and the EF within the irrigated croplands. The lateral flow refers to the subsurface inflow from mountainous areas and the subsurface outflow to the drainage canals or the desert areas. Because the groundwater always contains high level of salinity in this region, there is only small-scale groundwater withdrawal for human activities within KKRB (Gao and Yao, 2005; Zhang and Hu, 2008).
5
In the irrigated cropland, the groundwater dynamics can be written as follows (Tang et al., 2007b):
EF+LF=(θsat−θ′)∆z
wt+SD, (2)
where EF is EF at the bottom of the control volume (local recharge), LF is the net lateral flow (regional flow),θsat is the SWC at saturation,θ′ is the SWC within the range of
10
groundwater table changes, ∆zwt is the change of groundwater table depth, (θsat− θ′)∆z
wt is the water storage change associated with a falling or rising groundwater
table, and∆SDis the soil water storage change in the zone between bottom of control
volume and upper boundary of groundwater table variation.
Using Eq. (2), the groundwater dynamics was analyzed at this experimental site
15
(Fig. 2). The soil control volume was 90 cm in depth. As described in Sect. 3.3.1, the EF at 90 cm depth was obtained based on the measurement data. The SWC at the depth of 100, 120 and 150 cm were measured once a month, and assumed to apply to soil levels at 90–110, 110–130, and 130–200 cm, respectively. In addition,θwas assigned
to the layer between the 200 cm depth and the groundwater table, and assumed to
20
have a linear variation in this zone.θsat was determined from the porosity.
4 Results
In consideration of irrigation, cotton growth and climate variability, we divided the whole year into five analysis periods, i.e., Period 1 is the period after cotton is sown and before drip irrigation, Period 2 is the period of drip irrigation, Period 3 is the period after
25
HESSD
11, 1777–1820, 2014Tarim River Basin of Western China
Z. Zhang et al.
Title Page
Abstract Introduction
Conclusions References
Tables Figures
◭ ◮
◭ ◮
Back Close
Full Screen / Esc
Printer-friendly Version Interactive Discussion
Discussion
P
a
per
|
D
iscussion
P
a
per
|
Discussion
P
a
per
|
Discuss
ion
P
a
per
|
is the period of spring flush. The seasonal water balance and groundwater dynamics were analyzed during each of these five analysis periods, following which the annual characteristics were also explored.
4.1 Seasonal water balance analysis and exchange flux
4.1.1 Period after cotton is sown and before drip irrigation
5
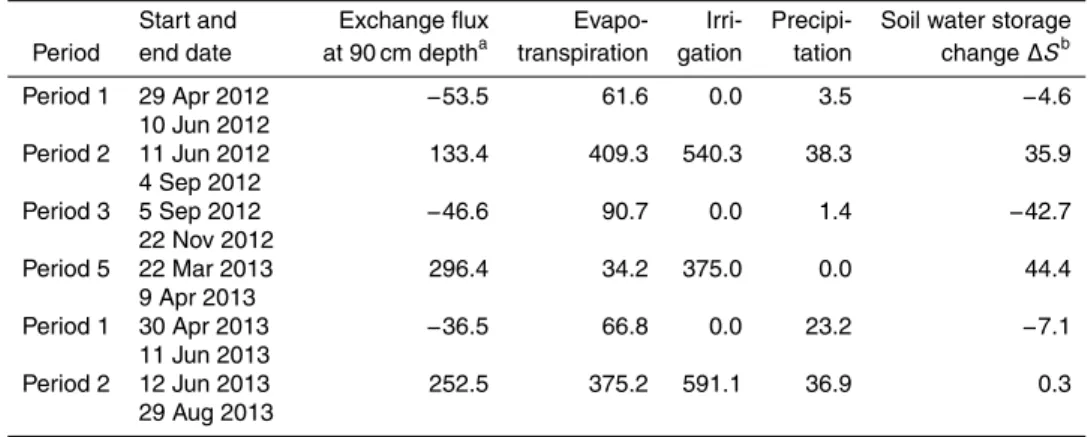
Cotton is usually planted in late April and drip irrigation starts in early June. This period after cotton is sown and before drip irrigation (Period 1) is the seedling stage of cotton growth. In 2012 and 2013, EFs at 90 cm depth derived from water balance analysis during Period 1 were−53.5 and−36.5 mm in total (Table 2), respectively, suggesting that the soil moisture went upward from deep soil zone and the groundwater table to
10
the land surface.
During Period 1, the potential evaporation was high due to higher temperature and net radiation. However, there was no irrigation during this period, and soil water storage and precipitation cannot completely satisfy the evapotranspiration water demand. On the other hand, the spring flush implemented about 40 days earlier led to the rising of
15
groundwater table and high soil water content in the deep soil zone, thus leading to the upward EF that was estimated. Most of the EF was consumed by evapotranspiration, while the soil storage contributed a small part to ET. It is worth to noting that precipi-tation impacted the EF significantly. The precipiprecipi-tation was higher in 2013 than in 2012 during Period 1, with the result that the EF was lower in 2013. The sum of
precipita-20
tion and EF was almost the same for these two years, indicating a water demand for evapotranspiration during Period 1.
The daily EF is presented in Fig. 3. Most days during Period 1 experienced upward fluxes while there were some exceptions during the rainy days because of infiltration. EF gradually became larger as time went by indicating that more water was required
25
HESSD
11, 1777–1820, 2014Tarim River Basin of Western China
Z. Zhang et al.
Title Page
Abstract Introduction
Conclusions References
Tables Figures
◭ ◮
◭ ◮
Back Close
Full Screen / Esc
Printer-friendly Version Interactive Discussion
Discussion
P
a
per
|
D
iscussion
P
a
per
|
Discussion
P
a
per
|
Discuss
ion
P
a
per
|
analyzed in more detail in Sect. 4.2. The results above were consistent during both years.
4.1.2 Period of drip irrigation
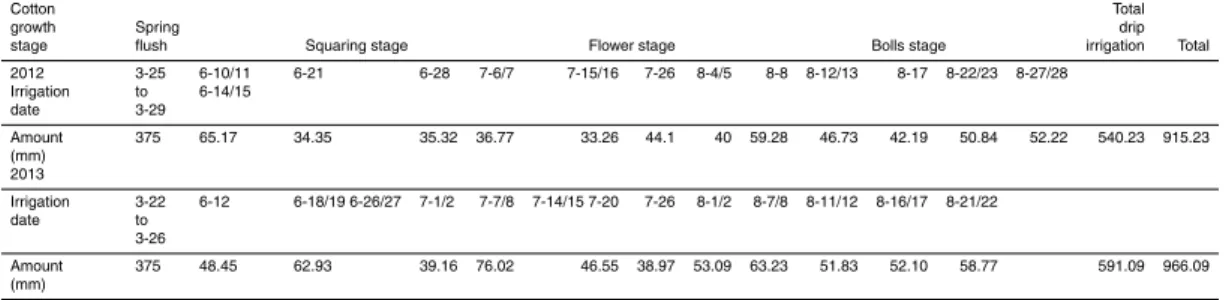
The drip irrigation schedules during the study period are shown in Table 1. The period of drip irrigation (Period 2) covered the flower, square, and bolling stages of cotton
5
growth. The total EFs were 133.4 and 252.5 mm in 2012 and 2013 during Period 2, respectively. The downward EFs were induced by drip irrigation conducted during this period and more irrigation amount in 2013 led to more leakage.
On the one hand, the irrigation water was sufficient to cause the leakage; on the
other hand, some upward EF still occurred just before the next irrigation event when
10
the interval between irrigation events was long (Fig. 4). The irrigation frequency was lower in 2012 than in 2013, resulting in more upward EFs to satisfy the water require-ment of plant transpiration and soil evaporation. The results indicate that more scientific irrigation schedules can further improve irrigation efficiency. In fact, the
evapotranspi-ration values were 375–400 mm during Period 2 (Table 2), far less than the sum of
15
irrigation and precipitation which was approximately 600 mm. There is therefore still great potential for water saving under current irrigation conditions.
However, compared with flood irrigation, the downward EF was remarkably reduced due to its limited irrigation amount each time. In fact, the irrigation amount each time under flood irrigation is about 300 mm in this region, leading to notable leakage and
20
groundwater table rise, whereas the irrigation amount is only 30–80 mm under drip irrigation, and the groundwater table is relatively stable during the irrigation periods (Fig. 4).
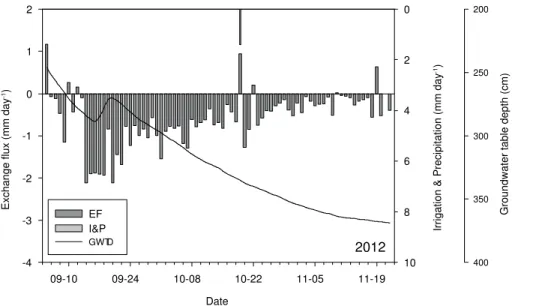
4.1.3 Period after drip irrigation and before soil freezing
The period after drip irrigation and before soil freezing (Period 3) is the open boll stage
25
HESSD
11, 1777–1820, 2014Tarim River Basin of Western China
Z. Zhang et al.
Title Page
Abstract Introduction
Conclusions References
Tables Figures
◭ ◮
◭ ◮
Back Close
Full Screen / Esc
Printer-friendly Version Interactive Discussion
Discussion
P
a
per
|
D
iscussion
P
a
per
|
Discussion
P
a
per
|
Discuss
ion
P
a
per
|
evaporation and declining groundwater table. The EF during Period 3 was −46.6 in 2012 (Table 2) and contributed to more than 50 % of the evapotranspiration during this period. Meanwhile, the soil water content rapidly decreased and provided the remain-der of the water demand for evapotranspiration.
Since the evaporative demand rapidly decreased during this period due to the
cli-5
matic condition, the upward EFs were significant in September and became smaller in October and November, as shown in Fig. 5. The sharply declined groundwater table was another reason for decreased upward EFs. In fact, the soil water storage change within the 90 cm depth was also concentrated in September with the total value of −45.3 mm. In October and November the soil storage even increased by 2.6 mm.
10
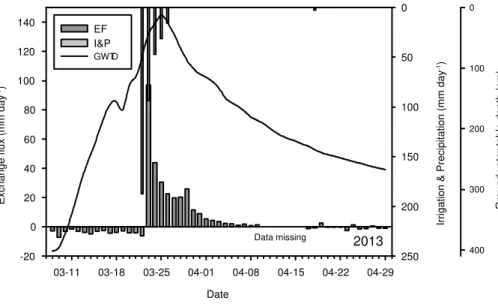
4.1.4 Period of winter and spring flush
The hydrologic processes slowed down in winter (Period 4). No irrigation and only rare precipitation (less than 5 mm) occurred during this period. The soil was frozen up to 100 cm depth and soil moisture was immovable in the frozen zone. Groundwater table declined to below 4.5 m. The evapotranspiration was very low and the total value was
15
only 9.4 mm for 105 days from 23 November 2012 to 7 March 2013. Since the soil sensors cannot provide accurate measurement in frozen soil, we cannot obtain soil water storage change to close the water balance. Therefore, the detailed analysis was not conducted in Period 4.
The spring flush is usually conducted in March for the purpose of leaching soil salt
20
and enhancing soil moisture (Period 5). In 2013, the spring flush was conducted in the period 22 to 26 March at the experimental site. The groundwater table increased before March 22 due to the spring flush in the surrounding fields (Fig. 6). Data was missing during 10 to 16 April because of sowing. The total EF during Period 5 (22 March to 9 April) was 296.4 mm, accounting for 79 % of the amount of water flushed (Table 2).
25
HESSD
11, 1777–1820, 2014Tarim River Basin of Western China
Z. Zhang et al.
Title Page
Abstract Introduction
Conclusions References
Tables Figures
◭ ◮
◭ ◮
Back Close
Full Screen / Esc
Printer-friendly Version Interactive Discussion
Discussion
P
a
per
|
D
iscussion
P
a
per
|
Discussion
P
a
per
|
Discuss
ion
P
a
per
|
4.2 Seasonal groundwater table dynamics
Based on the exchange fluxes obtained in Sect. 4.1, the variation of groundwater table and soil water storage change in the zone between the bottom of the control volume and the groundwater table, the seasonal groundwater dynamics are analyzed in this section. Since the available soil moisture data is quite limited in the deep unsaturated
5
zone, only the seasonal trends were analyzed rather than the daily trends, and the results are shown in Table 3.
The EF above the groundwater table was downward in all periods except Period 1 in 2012, indicating that salinization caused by phreatic evaporation had been con-trolled under the current irrigation condition. The groundwater table rose during Period
10
2 and Period 5, while it always declined during the other periods. The rate of decline was highest during Period 5 due to the groundwater plateau formed by spring flush. Groundwater plateau was also formed during Period 2 because of drip irrigation. The rate of decline was as high as 36.3 mm day−1 during the first 10 days of Period 3 just after the drip irrigation period in 2012. During Period 1, since the plateau effects caused
15
by spring flush were attenuated, the rates of decline were not so high, with the value of −12.8 to−15.8 mm day−1.
The net lateral flow was obtained by groundwater balance analysis using Eq. (2) and the value was negative during all the analysis periods, indicating that groundwa-ter plateau caused by irrigation existed within the irrigated croplands. To present the
20
regional groundwater balance clearly, representative sketches of seasonal groundwa-ter dynamics are presented in Fig. 7. When irrigation was implemented during Period 2 and Period 5, the groundwater table rose significantly. Then the groundwater table declined after irrigation periods and the rates gradually decreased when the water ta-ble became lower, which has been shown in Figs. 5 and 6. The lateral flow out of the
25
HESSD
11, 1777–1820, 2014Tarim River Basin of Western China
Z. Zhang et al.
Title Page
Abstract Introduction
Conclusions References
Tables Figures
◭ ◮
◭ ◮
Back Close
Full Screen / Esc
Printer-friendly Version Interactive Discussion
Discussion
P
a
per
|
D
iscussion
P
a
per
|
Discussion
P
a
per
|
Discuss
ion
P
a
per
|
was also significant. In fact, snowmelt happened during spring and summer, and the precipitation is also concentrated in the summer period in the mountainous areas. They resulted in significant subsurface flow into this zone during Period 2 (Fig. 7). Similarly, snowmelt in spring led to the subsurface flow into this zone, resulting in the fact that the net lateral flow was larger during Period 3 than during Period 1.
5
4.3 Annual water balance and groundwater dynamics
Annual water balance and groundwater dynamics were analyzed based on the data col-lected from 29 April 2012 to 28 April 2013. The evapotranspiration was 637.5 mm for the whole year and precipitation was 48.9 mm. The total irrigation amount was 915.3 mm, which was composed of drip irrigation (540.3 mm) and spring flush (375 mm). Soil
wa-10
ter storage increased by 16.2 mm in the unsaturated zone during this year. Therefore, the total EF above the groundwater table was 310.5 mm. The downward flux recharged the groundwater, which eventually flowed into the desert or drained to the Bosten Lake. Groundwater table declined by 540.1 mm from 29 April 2012 to 28 April 2013, resulting in −45.1 mm groundwater storage change. Therefore, after taking the EF
15
of 310.5 mm into account, the annual net lateral flow at the experimental site was −355.6 mm, flowing out of this zone to the desert or the lake. Groundwater table slightly declined during this year mainly due to the limited irrigation amount.
5 Discussion
In this study, water balance and groundwater table dynamics under water-saving
irriga-20
tion in an oasis within the Tarim River Basin were analyzed based on comprehensive measurements that helped to close the water balance. The study region represents the typical social and hydrologic system of oases in inland basins. In most inland basins of the world, just as in the case of the Tarim River Basin, water resources are generated in the mountainous area due to snowmelt and rainfall there. Rivers flow out of mountains
HESSD
11, 1777–1820, 2014Tarim River Basin of Western China
Z. Zhang et al.
Title Page
Abstract Introduction
Conclusions References
Tables Figures
◭ ◮
◭ ◮
Back Close
Full Screen / Esc
Printer-friendly Version Interactive Discussion
Discussion
P
a
per
|
D
iscussion
P
a
per
|
Discussion
P
a
per
|
Discuss
ion
P
a
per
|
and across the alluvial plain, supporting natural vegetation in the riparian areas which heavily relies on groundwater. The oases are distributed along rivers and people ex-tract water from the rivers used for different purposes, for instance, irrigation. Due to
limited water resources, the competition for water by nature and humans has always existed in the oases and is becoming more acute recently (Scott et al., 2013; Shen and
5
Chen, 2010). To address the water challenges in these regions, one of the most impor-tant approaches is to popularize the use of water-saving irrigation, as is happening in the Tarim River Basin. Therefore, the conclusions drawn in this study can be potentially applied to other arid inland areas (e.g., in central Asia, sub-Saharan Africa) which face similar water shortage and development problems (Christen et al., 2007).
10
5.1 Three stages of human-water system development
Due to the unique hydrological regime in oases, a moderate groundwater table is the desired goal of sustainable water management (El Bastawesy et al., 2013; Zhu et al., 2004). The groundwater table is significantly affected by anthropogenic activities,
es-pecially irrigation (Tang et al., 2007a). To discuss the irrigation effects on groundwater
15
table, we can divide the evolution of the human-water system in these inland basins into three stages in terms of water use, i.e., the natural stage before the 20th cen-tury; the exploitation stage in the 20th cencen-tury; and the balanced development stage in 21th century. As shown in this study, Tarim River Basin presents us with a good case study to gain insights into the effects of irrigation on groundwater table dynamics, and
20
associated human development.
5.1.1 Natural stage: limited anthropogenic impacts on groundwater
During the natural stage, the anthropogenic activities had limited impacts on water re-sources. The groundwater table did not change much and the water table was relatively deep in the irrigated districts (Fig. 8). Oases were restricted along the river and isolated
25
HESSD
11, 1777–1820, 2014Tarim River Basin of Western China
Z. Zhang et al.
Title Page
Abstract Introduction
Conclusions References
Tables Figures
◭ ◮
◭ ◮
Back Close
Full Screen / Esc
Printer-friendly Version Interactive Discussion
Discussion
P
a
per
|
D
iscussion
P
a
per
|
Discussion
P
a
per
|
Discuss
ion
P
a
per
|
development (Liu et al., 2013). Rivers had sufficient water to support the natural
veg-etation in the riparian areas. The water resources formed in the mountainous area flowed across the alluvial plains by both surface flow and subsurface flow, and finally drained into the desert. The relationship between surface water and groundwater was quite weak during this stage.
5
5.1.2 Exploitation stage: salinization and natural vegetation degradation
During the exploitation stage during the 20th century, water balance and groundwater dynamics were significantly altered by anthropogenic activities, especially by the rapid development of agriculture (Cui and Shao, 2005; El Bastawesy et al., 2013). Ground-water tables significantly rose in the irrigated districts due to flood irrigation and canal
10
leakage, resulting in severe soil salinization. Within the KKRB, groundwater table in most irrigated croplands had risen to less than 1 m below the surface due to long-term flood irrigation in the late 1990s (Cui and Shao, 2005). More than 60 % of the irrigated croplands suffered severe salinization due to intense phreatic evaporation induced by
high groundwater table. As the area of irrigated cropland greatly expanded, more
wa-15
ter drained into Bosten Lake from the irrigated district. During the period 1958 to 2002, 1.9×10⁸m3yr−1saline water from the irrigated district directly drained into the Bosten Lake, contributing to 9 % of the total influx of this lake (Gao and Yao, 2005). The salinity of the lake increased from 0.38 g L−1in 1956 to 1.32 g L−1in 2005 (Xie et al., 2011) as a result. The water quality in the lake changed from fresh water into brackish water as
20
a consequence. At the same time, the ecosystem of the lake suffered severe
degra-dation. The area covered by reeds within the lake decreased from 558 km2 in 1958 to 300 km2in 1998 (Wan et al., 2006).
During the exploitation stage, when the groundwater table sharply rose in the irri-gated districts, the water table in riparian areas in the lower reaches obviously
de-25
HESSD
11, 1777–1820, 2014Tarim River Basin of Western China
Z. Zhang et al.
Title Page
Abstract Introduction
Conclusions References
Tables Figures
◭ ◮
◭ ◮
Back Close
Full Screen / Esc
Printer-friendly Version Interactive Discussion
Discussion
P
a
per
|
D
iscussion
P
a
per
|
Discussion
P
a
per
|
Discuss
ion
P
a
per
|
rapidly from 39.9×10³ha to 101.2×10³ha from 1950 to 1979, while the water use for agriculture increased faster from 0.6×10⁹m3to 1.83×10⁹m3(Table 4). The irrigation quota reached the peak of 1811.3 mm in 1979. During the period 1979 to 1999, irriga-tion quota decreased to 1037.7 mm benefiting from the improved canal systems and reduced leakage. However, the cropland area still rapidly expanded and the annual
wa-5
ter withdrawal did not decrease too much and remained at the value of 1.78×10⁹m3 (Gao and Yao, 2005; Wang et al., 2002; Xia et al., 2003; Zhou et al., 2001). The natural ecosystem in the lower reaches suffered severe degradation due to the drawdown of
the groundwater table. Thus, irrigation dramatically altered the natural hydraulic river regimes and regional hydrologic cycle in inland basins during the exploration stage.
10
5.1.3 Balanced development stage: drawdown of groundwater table and
efficiency paradox
In order to mitigate soil salinization within the irrigated croplands, groundwater table should be lowered to an appropriate depth. In order to leave more water in the river for ecologic use, water extraction from the river should be reduced. Since agriculture
15
consumes more than 90 % of water in most inland basins, water-saving irrigation is the best choice to realize the two goals above. In fact, water-saving irrigation has been popularized in many inland basins in recent years of the 21th century (Ibragimov et al., 2007; Rajak et al., 2006; Zhang et al., 2012). After the 2000s, the government began to promote the development of water-saving irrigation through the employment of
sub-20
sidies (Ma et al., 2010). Water-saving irrigation not only improved water use efficiency,
but also significantly enhanced crop yield, and thus it was quickly and enthusiastically adopted by local farmers (Liu et al., 2013; Wang et al., 2011).
Groundwater tables significantly declined with the implementation of water-saving irrigation during the balanced development stage. Within the KKRB, as we showed in
25
HESSD
11, 1777–1820, 2014Tarim River Basin of Western China
Z. Zhang et al.
Title Page
Abstract Introduction
Conclusions References
Tables Figures
◭ ◮
◭ ◮
Back Close
Full Screen / Esc
Printer-friendly Version Interactive Discussion
Discussion
P
a
per
|
D
iscussion
P
a
per
|
Discussion
P
a
per
|
Discuss
ion
P
a
per
|
non-growth season flush. The annual recharge to groundwater was only 310.5 mm due to the limited irrigation amount, accounting for 32 % of the total amount of irrigation and precipitation. It should also be noted that the daily downward fluxes were small during the drip irrigation period, avoiding a significant rise of groundwater table. The long-term series data observed in Yanqi County within KKRB showed that the groundwater
5
table in this region continually declined in the past decade and has been managed to the favorable depth needed for the plant growth, which is in the range of 2–4 m (Fig. 9). The relatively stable groundwater table under mulched drip irrigation helped to reduce the intense phreatic evaporation, which was common after every flood irrigation event before (El Bastawesy et al., 2013; Tang et al., 2007a). The seasonal analysis in
10
this study showed that the upward EFs from the groundwater only happened during spring with a trivial amount. Since the groundwater is 4-6 times more saline than the irrigated water from the canal, the reduced upward EFs are a significant benefit towards salinization control as well. Thus, the purpose of soil salinization mitigation is realized to a large extent by the implementation of water-saving irrigation.
15
The yearbook shows that the irrigation quota dropped from 1037.7 mm in 1999 to 853.7 mm in 2011 following the adoption of the new irrigation methods within KKRB (Table 4). If the water savings gained by the replacement of flood irrigation with water-saving irrigation remained in the river for ecological use, the recovery of ecosystem and environment could be easily realized (Scheierling et al., 2006). However, the water
20
“saved” can also lead to increased use of the water through irrigation area expan-sion (Ward and Pulido-Velazquez, 2008). This phenomenon which is known as “effi
-ciency paradox” has also happened in many other regions, such as Spain, Chile and the United states (Scott et al., 2013). Within KKRB, subsidies provided by the gov-ernment not only popularized water-saving irrigation, but also stimulated farmers to
25
HESSD
11, 1777–1820, 2014Tarim River Basin of Western China
Z. Zhang et al.
Title Page
Abstract Introduction
Conclusions References
Tables Figures
◭ ◮
◭ ◮
Back Close
Full Screen / Esc
Printer-friendly Version Interactive Discussion
Discussion
P
a
per
|
D
iscussion
P
a
per
|
Discussion
P
a
per
|
Discuss
ion
P
a
per
|
paradox”, water saving irrigation indeed resulted in more (not less) water usage in this basin.
In fact, as shown in this study, high irrigation efficiency under water-saving
irriga-tion means high water consumpirriga-tion by evapotranspirairriga-tion and reduced recharge to the groundwater (Perry, 2011). Then the groundwater table will continuously decline in the
5
whole region. Drawdown of groundwater table is good for salinization control in irrigated districts. However, it is also the main reason for the disappearance of natural vegeta-tion and desert expansion. Therefore, the water savings gained through advanced drip irrigation should remain within the river basin to recharge the riparian groundwater and support the natural vegetation in future.
10
Meanwhile, soil salinization under the water-saving irrigation has threatened sustain-able development. The mechanism of salinization is different from that caused by flood
irrigation. Intense phreatic evaporation induced by shallow groundwater table is the main reason for salinization under flood irrigation. However, under water-saving irriga-tion, the salinization is mainly caused by deficient leaching of water. For instance, under
15
mulched drip irrigation, the dissolved salts accumulate at the periphery of the wetted soil mass and increase with distance from the emitters in the soil profile (Palacios-Diaz et al., 2009; Wang et al., 2011). This kind of salinization is serious especially when brackish water is used for irrigation (Phocaides, 2007). Since precipitation is rare in inland basins, irrigation plays an important role flushing and draining the salt from the
20
surface soil to the groundwater. Therefore, a more comprehensive treatment of water and salt balances is essential in these regions.
5.2 Future: water-saving irrigation with restriction of reclamation
To avoid further deterioration of the environment and maintain sustainable develop-ment in oases in inland basins, water managedevelop-ment which takes ecosystem and
en-25
HESSD
11, 1777–1820, 2014Tarim River Basin of Western China
Z. Zhang et al.
Title Page
Abstract Introduction
Conclusions References
Tables Figures
◭ ◮
◭ ◮
Back Close
Full Screen / Esc
Printer-friendly Version Interactive Discussion
Discussion
P
a
per
|
D
iscussion
P
a
per
|
Discussion
P
a
per
|
Discuss
ion
P
a
per
|
on the other hand, the agriculture field expansion should be strictly controlled. Most of the water savings which derive from increasing irrigation efficiency should remain in
the river to recharge the groundwater in the lower reaches. The application of water-saving irrigation and restriction of cultivated land area will dramatically reduce water extraction from the river. The groundwater table in irrigated districts will then
continu-5
ally decline and salinization will be mitigated. The water shortage of the ecosystem in the lower reaches can be addressed and the riparian vegetation can gradually recover from degradation. The lake can also be fed by more fresh water from the river rather than by saline water from the irrigated croplands, and the salinity level of the lake water will thus decrease.
10
The new salinization under water-saving irrigation can be partly mitigated by non-growth season flush. In this study, we analyzed the seasonal groundwater dynamics in irrigated cropland within the Tarim River Basin. The results show that the subsurface flow into the irrigated districts from mountainous areas was larger in summer than in spring and autumn. Both subsurface flow from mountainous areas and irrigation are the
15
cause of groundwater table rise within irrigated croplands. Therefore, it is good for the groundwater table control that the flush with large water amount is implemented in the seasons that subsurface flow is relatively small. In spring and autumn, the groundwater table can decline soon after flush to maximize salt leaching efficiency. The non-growth
season flush is highly recommended for salt leaching in inland basins. However, the
20
frequency and amount of flushing still should be optimized, which requires more study. In this study, the exchange fluxes between the unsaturated zone and the groundwa-ter table were obtained by wagroundwa-ter balance analysis based on comprehensive field mea-surements. The wide application of eddy covariance provided the possibility to perform this kind of analysis to quantify the exchange fluxes. The exchange flux as the linkage
25
HESSD
11, 1777–1820, 2014Tarim River Basin of Western China
Z. Zhang et al.
Title Page
Abstract Introduction
Conclusions References
Tables Figures
◭ ◮
◭ ◮
Back Close
Full Screen / Esc
Printer-friendly Version Interactive Discussion
Discussion
P
a
per
|
D
iscussion
P
a
per
|
Discussion
P
a
per
|
Discuss
ion
P
a
per
|
Anthropogenic activities significantly affect water balance and groundwater table
dy-namics in the oases located in inland basins. The study showed that the water saving not only needs advanced irrigation technology, but also enlightened scientific manage-ment. It is important to understand the human-water system to maintain sustainable development. This study can be regarded as one of the quantitative study of process
5
socio-hydrology, and can generate insight into huwater system and water man-agement in inland basin (Sivapalan et al., 2012). The anthropogenic effects on
human-water system should be clarified by both field observations and monitoring and through integrated model.
6 Conclusions
10
In this study the seasonal water balance and groundwater dynamics under water-saving irrigation have been quantified based on comprehensive measurements con-ducted in an oasis within Tarim River Basin. The effects of conversion of irrigation
meth-ods on human-water systems were discussed to maintain sustainable water manage-ment in the future. In general, anthropogenic activities have significantly affected the
15
water balance and groundwater dynamics in this arid area. After application of water-saving irrigation, some problems such as salinization induced by shallow groundwater table are mitigated, while new challenges also emerge. The water savings resulting from water-saving irrigation have not remained in the river to recharge the groundwa-ter for ecologic use. In fact, they have instead been reused towards the expansion of
20
irrigation croplands, resulting in even more water consumption. The continued decline of the groundwater table will contribute to the destruction of the natural vegetation that relies on the groundwater and this will lead to ecosystem degradation. In addition, the salinization risk still exists due to the insufficient leaching water under water-saving
irrigation. To address the water challenges in the arid area, improved irrigation effi
-25
HESSD
11, 1777–1820, 2014Tarim River Basin of Western China
Z. Zhang et al.
Title Page
Abstract Introduction
Conclusions References
Tables Figures
◭ ◮
◭ ◮
Back Close
Full Screen / Esc
Printer-friendly Version Interactive Discussion
Discussion
P
a
per
|
D
iscussion
P
a
per
|
Discussion
P
a
per
|
Discuss
ion
P
a
per
|
significant. Using socio-hydrology, the dynamics of interactions between people and water will be clarified, and sustainable development will be achieved.
Acknowledgements. This research was funded by the National Science Foundation of China
(NSFC 51190092, 51109110, and 51222901), SRF for ROCS, SEM, and the Foundation of the State Key Laboratory of Hydroscience and Engineering of Tsinghua University
(2012-KY-5
03). We also thank the staffat Tsinghua University-Korla Oasis Eco-hydrology Experimental Research Station for their excellent work.
References
Allen, R. G., Pereira, L. S., Howell, T. A., and Jensen, M. E.: Evapotranspiration information reporting: I. Factors governing measurement accuracy, Agr. Water Manage., 98, 899–920,
10
2011a.
Baldocchi, D., Falge, E., Gu, L. H., Olson, R., Hollinger, D., Running, S., Anthoni, P., Bernhofer, C., Davis, K., Evans, R., Fuentes, J., Goldstein, A., Katul, G., Law, B., Lee, X. H., Malhi, Y., Meyers, T., Munger, W., Oechel, W., Paw U, K. T., Pilegaard, K., Schmid, H. P., Valentini, R., Verma, S., Vesala, T., Wilson, K., and Wofsy, S.: FLUXNET: a new tool to study the
15
temporal and spatial variability of ecosystem-scale carbon dioxide, water vapor, and energy flux densities, B. Am. Meteorol. Soc., 82, 2415–2434, 2001.
Bruelheide, H., Jandt, U., Gries, D., Thomas, F. M., Foetzki, A., Buerkert, A., Gang, W., Zhang, X., and Runge, M.: Vegetation changes in a river oasis on the southern rim of the Taklamakan Desert in China between 1956 and 2000, Phytocoenologia, 33, 801–818, 2003.
20
Chen, Y., Chen, Y., Xu, C., Ye, Z., Li, Z., Zhu, C., and Ma, X.: Effects of ecological water con-veyance on groundwater dynamics and riparian vegetation in the lower reaches of Tarim River, China, Hydrol. Process., 24, 170–177, 2010.
Christen, E., DeLange, S., Patti, T., and Hornbuckle, J.: Soil salinity in drip irrigated vineyards of the MIA, Irrigation Research & Extension Committee Farmers’ Newsletter, 176, 54–57,
25
2007.
HESSD
11, 1777–1820, 2014Tarim River Basin of Western China
Z. Zhang et al.
Title Page
Abstract Introduction
Conclusions References
Tables Figures
◭ ◮
◭ ◮
Back Close
Full Screen / Esc
Printer-friendly Version Interactive Discussion
Discussion
P
a
per
|
D
iscussion
P
a
per
|
Discussion
P
a
per
|
Discuss
ion
P
a
per
|
El Bastawesy, M., Ramadan Ali, R., Faid, A., and El Osta, M.: Assessment of waterlogging in agricultural megaprojects in the closed drainage basins of the Western Desert of Egypt, Hydrol. Earth Syst. Sci., 17, 1493–1501, doi:10.5194/hess-17-1493-2013, 2013.
Evett, S. R., Kustas, W. P., Gowda, P. H., Anderson, M. C., Prueger, J. H., and Howell, T. A.: Overview of the bushland evapotranspiration and agricultural remote sensing experiment
5
2008 (BEAREX08): a field experiment evaluating methods for quantifying ET at multiple scales, Adv. Water Resour., 50, 4–19, doi:10.1016/j.advwatres.2012.03.010, 2012.
Feng, Q., Cheng, G. D., and Masao, M. K.: Trends of water resource development and utilization in arid north-west China, Environ. Geol., 39, 831–838, 2000.
Foken T.: The energy balance closure problem: An overview, Ecol. Appl., 18, 1351–1367, 2008.
10
Gao, H. and Yao, Y.: Quantitative effect of human activities on water level change of Bosten
Lake in recent 50 years, Scientia Geographica Sinica, 25, 3305–3309, 2005 (in Chinese with English abstract).
Gao, Q., Wang, R., and Giese, E.: Impact of climate change on surface runoffof Tarim River originating from the south slopes of the Tianshan Mountains, J. Glaciol. Geocryol., 30, 1–11,
15
2008 (in Chinese with English abstract).
Hanasaki, N., Fujimori, S., Yamamoto, T., Yoshikawa, S., Masaki, Y., Hijioka, Y., Kainuma, M., Kanamori, Y., Masui, T., Takahashi, K., and Kanae, S.: A global water scarcity assessment under Shared Socio-economic Pathways – Part 2: Water availability and scarcity, Hydrol. Earth Syst. Sci., 17, 2393–2413, doi:10.5194/hess-17-2393-2013, 2013.
20
Hu, H., Tian, F., and Hu, H.: Soil particle size distribution and its relationship with soil water and salt under mulched drip irrigation in Xinjiang Province of China, Sci. China Tech. Sci., 54, 1–7, 2011.
Ibragimov, N., Evett, S. R., Esanbekov, Y., Kamilov, B. S., Mirzaev, L., and Lamers, J. P. A.: Water use efficiency of irrigated cotton in Uzbekistan under drip and furrow irrigation, Agr. 25
Water Manage., 90, 112–120, 2007.
Li, Q., Li, L., and Bao, A.: Snow cover change and its impact on streamflow in Kaidu River Basin, Resour. Sci., 34, 91–97, 2012 (in Chinese with English abstract).
Liu, Y., Tian, F., Hu, H., and Sivapalan, M.: Socio-hydrologic perspectives of the co-evolution of humans and water in the Tarim River Basin, Western China: the Taiji-Tire Model, Hydrol.
30