Worldwide trends in blood pressure from 1975 to 2015:
a pooled analysis of 1479 population-based measurement
studies with 19·1 million participants
NCD Risk Factor Collaboration (NCD-RisC)*
Summary
Background
Raised blood pressure is an important risk factor for cardiovascular diseases and chronic kidney disease.
We estimated worldwide trends in mean systolic and mean diastolic blood pressure, and the prevalence of, and
number of people with, raised blood pressure, defi ned as systolic blood pressure of 140 mm Hg or higher or diastolic
blood pressure of 90 mm Hg or higher.
Methods
For this analysis, we pooled national, subnational, or community population-based studies that had
measured blood pressure in adults aged 18 years and older. We used a Bayesian hierarchical model to estimate trends
from 1975 to 2015 in mean systolic and mean diastolic blood pressure, and the prevalence of raised blood pressure for
200 countries. We calculated the contributions of changes in prevalence versus population growth and ageing to the
increase in the number of adults with raised blood pressure.
Findings
We pooled 1479 studies that had measured the blood pressures of 19·1 million adults. Global age-standardised
mean systolic blood pressure in 2015 was 127·0 mm Hg (95% credible interval 125·7–128·3) in men and 122·3 mm Hg
(121·0–123·6) in women; age-standardised mean diastolic blood pressure was 78·7 mm Hg (77·9–79·5) for men and
76·7 mm Hg (75·9–77·6) for women. Global age-standardised prevalence of raised blood pressure was 24·1%
(21·4–27·1) in men and 20·1% (17·8–22·5) in women in 2015. Mean systolic and mean diastolic blood pressure
decreased substantially from 1975 to 2015 in high-income western and Asia Pacifi c countries, moving these countries
from having some of the highest worldwide blood pressure in 1975 to the lowest in 2015. Mean blood pressure also
decreased in women in central and eastern Europe, Latin America and the Caribbean, and, more recently, central
Asia, Middle East, and north Africa, but the estimated trends in these super-regions had larger uncertainty than in
high-income super-regions. By contrast, mean blood pressure might have increased in east and southeast Asia,
south Asia, Oceania, and sub-Saharan Africa. In 2015, central and eastern Europe, sub-Saharan Africa, and south Asia
had the highest blood pressure levels. Prevalence of raised blood pressure decreased in high-income and some
middle-income countries; it remained unchanged elsewhere. The number of adults with raised blood pressure
increased from 594 million in 1975 to 1·13 billion in 2015, with the increase largely in low-income and middle-income
countries. The global increase in the number of adults with raised blood pressure is a net eff ect of increase due to
population growth and ageing, and decrease due to declining age-specifi c prevalence.
Interpretation
During the past four decades, the highest worldwide blood pressure levels have shifted from
high-income countries to low-income countries in south Asia and sub-Saharan Africa due to opposite trends, while
blood pressure has been persistently high in central and eastern Europe.
Funding
Wellcome Trust.
Copyright
© The Author(s). Published by Elsevier Ltd. This is an Open Access article under the CC BY license.
Introduction
Raised blood pressure is the leading global risk factor for
cardiovascular diseases and chronic kidney disease.
1One
of the global non-communicable disease (NCD) targets
adopted by the World Health Assembly in 2013 is to lower
the prevalence of raised blood pressure, defi ned as systolic
blood pressure of 140 mm Hg or higher or diastolic blood
pressure of 90 mm Hg or higher, by 25% compared with
its 2010 level by 2025.
2Consistent global information is
needed to understand how countries compare on blood
pressure levels and trends, and where interventions to
curtail the rise in blood pressure are most needed.
The prevalence of raised blood pressure measures the
number of high-risk people irrespective of treatment
status, and is the indicator used in the global NCD target.
However, blood pressure has a log-linear association with
cardiovascular diseases and chronic kidney disease that
continues well below the threshold for raised blood
pressure, and treatment provides similar proportional risk
reductions irrespective of pretreatment blood pressure.
3,4Trends in mean population blood pressure measure how
blood pressure distribution has shifted over time.
We pooled population-based data to estimate national,
regional, and global trends from 1975 to 2015 in mean
Lancet 2017; 389: 37–55
Published Online November 15, 2016 http://dx.doi.org/10.1016/ S0140-6736(16)31919-5
SeeComment page 3 *NCD Risk Factor Collaboration members are listed at the end of the paper
systolic and mean diastolic blood pressure, and in the
prevalence of raised blood pressure, for adults aged
18 years and older in 200 countries and territories. We
also estimated trends in the number of adults with raised
blood pressure, and calculated how much these trends
are attributable to changes in prevalence versus changes
in population size and age structure.
Methods
Study design and data sources
For this pooled analysis, we included data collected from
samples of a national, subnational (ie, covering one or
more subnational regions), or community (one or a small
number of communities) population in which
participants’ blood pressure had been measured. Our
methods for identifying and accessing data sources are
described in the appendix (pp 2–6). When a study
measured blood pressure more than once in participants
(1053 [86%] of 1220 studies for which information about
number of measurements was available), we discarded
the fi rst measurement, and used the average of the
remainder.
292 (20%) of the 1479 data sources we analysed
(2298
[16%] of 14 391 age-sex-study-specifi c data points)
that were from a previous global pooling
5or extracted
from publications did not have data on one or more of
our primary outcomes. We used regressions to convert
available data in these sources to the missing primary
outcomes because the various blood pressure outcomes
are correlated.
6Details of conversion (or so-called
cross-walking) regressions and their coeffi
cients are
presented in the appendix (pp 7, 8, 44–152).
Statistical analysis
The statistical model used to estimate means and
prevalence by country, year, and age is described in detail
in a statistical paper and related substantive papers.
5,7,8In
summary, we organised countries into 21 regions, mainly
on the basis of geography and national income, which
we further aggregated into nine “super-regions”
(appendix pp 14, 15). The model had a hierarchical
structure in which estimates for each country and year
were informed by its own data, if available, and by data
from other years in the same country and from other
countries, especially countries in the same region with
data for similar time periods. The hierarchical structure
shares information to a greater extent when data are
non-existent or weakly informative (eg, have a small sample
size or are not national), and to a lesser extent for
data-rich countries and regions.
The model incorporated non-linear time trends and age
patterns. It allowed the age association of blood pressure
Research in context
Evidence before this study
We searched MEDLINE (via PubMed) for articles published in
English, Spanish, Portuguese, Chinese, Italian, French, or
Farsi between Jan 1, 1950, and Feb 19, 2014, using the search
terms (“blood pressure”[Mesh:NoExp] OR
“hypertension”[Mesh:NoExp]) AND (“Humans”[Mesh]).
We screened articles according to the inclusion and exclusion
criteria described in the appendix.
Some studies, including the MONICA Project, have reported
on blood pressure change or trends in one or more countries.
Two previous global analyses, done more than a decade ago,
pooled data from diff erent countries and reported mean
systolic blood pressure or prevalence of hypertension in the
year 2000 for the world and its major regions. A more recent
analysis published in 2016 pooled 135 studies to estimate
global and regional hypertension prevalence in 2000 and
2010, but did not report changes in mean blood pressure,
which refl ect shifts in the population distribution of blood
pressure. None of these studies provided consistent estimates
for all countries or accounted for the fact that the data used
were collected in diff erent years. The only analysis of trends at
the country level reported mean systolic blood pressure from
1980 to 2008 but did not report mean diastolic blood
pressure or prevalence of raised blood pressure, which is of
clinical relevance and needed for monitoring progress towards
the global target.
Added value of this study
This study provides the most complete picture of trends in
adult blood pressure for all countries in the world with the
longest observation period of any global blood pressure study
to our knowledge, and includes trends in mean diastolic blood
pressure and prevalence of raised blood pressure, which were
not included in previous studies and are of clinical, public
health, and health systems signifi cance. We also estimated
trends in the number of adults with raised blood pressure, and
how much these trends are driven by changes in prevalence
versus population size and age structure.
Implications of all the available evidence
During the past four decades, the highest levels of blood
pressure worldwide have shifted from high-income countries to
low-income and middle-income countries in south Asia and
sub-Saharan Africa, while blood pressure has been persistently
high in central and eastern Europe. The global target of reducing
raised blood pressure prevalence by 25% by 2025 is unlikely to be
achieved in these regions. The number of people with raised
blood pressure has risen worldwide, with the increase happening
mainly in low-income and middle-income countries.
Population-based interventions throughout the life-course and
pharmacological treatment for people with high absolute risk or
people with substantially raised blood pressure should be a part
of any eff ort to address the global burden of non-communicable
diseases, especially in the poorest countries.
to vary across populations, and the rise in means and
prevalence over age to be steeper where blood pressure is
higher.
9,10The model accounted for the possibility that
blood pressure in subnational and community studies
might systematically diff er from nationally representative
ones, and might also have larger variation than in national
studies; the model also accounted for rural–urban
diff erences in blood pressure, and used it to adjust
rural-only and urban-only studies. The statistical model
included covariates that help predict blood pressure,
including mean number of years of education, proportion
of national population living in urban areas, and a
summary measure of availability of diff erent food types
for human consumption (appendix pp 9, 10).
We fi tted the statistical model with the Markov chain
Monte Carlo algorithm, and obtained 5000 post-burn-in
samples from the posterior distribution of model
parameters, which were in turn used to obtain
the posterior distributions of primary outcomes. The
reported credible intervals (CrI) represent the
2·5th to 97·5th percentiles of the posterior distributions.
Each primary outcome was analysed separately, and all
analyses were done separately by sex to allow blood
pressure, its trends, and age associations to diff er among
outcomes and between men and women.
We calculated mean change in mean blood pressure
and the prevalence of raised blood pressure across the
41 years of analysis (reported as change per decade). We
also report the posterior probability (PP) that an estimated
trend represents a true increase or decrease. We generated
age-standardised estimates using the WHO standard
population,
11by taking weighted means of age–sex-specifi c
estimates, with use of age weights from the standard
population. We tested how our statistical model predicted
mean blood pressure and the prevalence of raised blood
pressure when a country-year did not have data
(appendix pp 11–13), which showed that the model
performed well in its predictive validity.
We calculated the contribution of population growth
and ageing to the change in the number of adults with
raised blood pressure by fi xing age-specifi c prevalence at
its 1975 levels while allowing age-specifi c population to
change as it did. We calculated the contribution of change
in prevalence by fi xing age-specifi c population at its
1975 level while allowing age-specifi c prevalence to
change as it did. The interaction between the two
contributions is the residual change in the number of
adults with raised blood pressure after accounting for the
two forementioned components.
Role of funding source
The funder of the study had no role in study design, data
collection, data analysis, data interpretation, or writing of
the report. Country and Regional Data Group members
and BZ had full access to the data in the study. The
corresponding author had fi nal responsibility for the
decision to submit for publication.
Results
We included 1479 population-based measurement surveys
and studies, with 19·1 million participants aged 18 years
and older for whom blood pressure was measured. We
had at least one data source for 174 (87%) of the
200 countries we made estimates for, covering 97·5% of
the world’s population in 2015 (appendix pp 193, 194), and
at least two data sources for 122 (61%) countries. Of these
1479 sources, 517 (35%) were from national samples,
249 (17%) covered one or more subnational regions, and
the remaining 713 (48%) were from one or a small number
of communities. Regionally, data availability ranged
from 0·83 data sources per country in central Africa
to 37 sources per country in high-income Asia Pacifi c.
543 (37%) data sources were from years before 1995 and
another 936 (63%) were from 1995 and later.
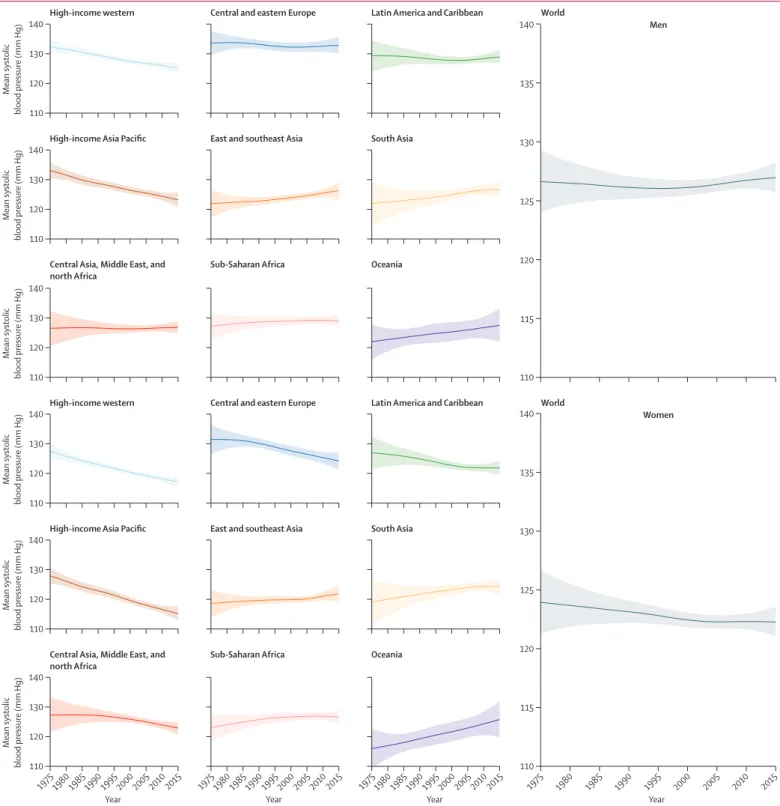
Globally, age-standardised adult mean systolic blood
pressure remained virtually unchanged from 1975 to
2015 in men (126·6 mm Hg [95% CrI 124·0 to 129·3]
in 1975 and 127·0 mm Hg [125·7 to 128·3] in 2015; an
increase of 0·07 mm Hg per decade [–0·59 to 0·74]; PP of
being a true increasing trend is 0·5808) and decreased
slightly in women (123·9 mm Hg [121·3 to 126·6] in 1975
and 122·3 mm Hg [121·0 to 123·6] in 2015; a decrease of
0·47 mm Hg per decade [–0·20 to 1·15]; PP=0·9210;
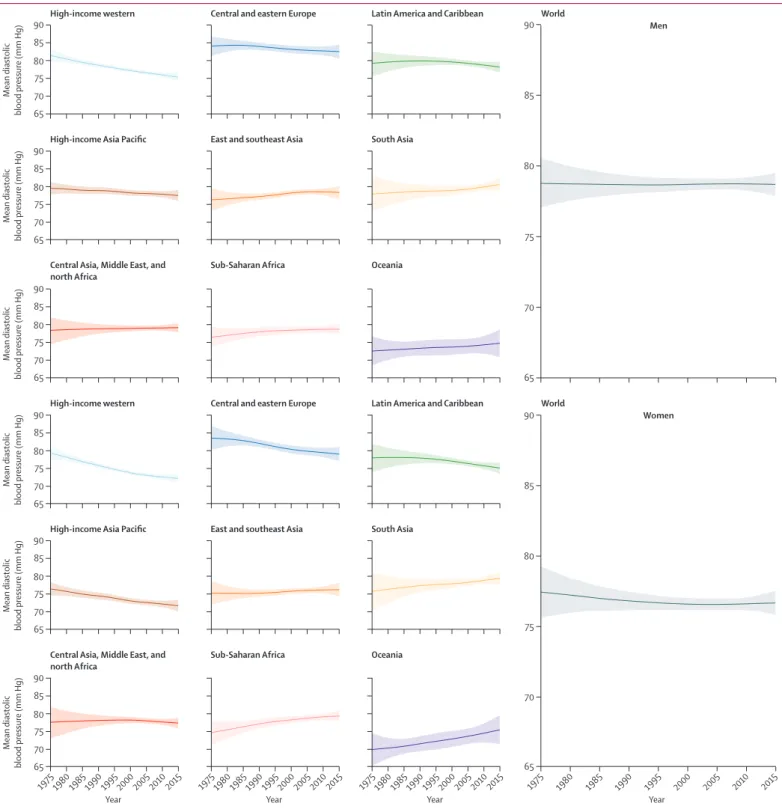
fi gure 1). Trends in age-standardised mean diastolic
blood pressure, which was 78·7 mm Hg (77·9 to 79·5) for
men and 76·7 mm Hg (75·9 to 77·6) for women in 2015,
were similar (fi gure 2).
Mean systolic and mean diastolic blood pressure
decreased substantially during these four decades in
high-income western and high-income Asia Pacifi c
super-regions, moving these two super-regions from
being among those with the highest blood pressure
in 1975 to the lowest in 2015 (fi gures 1, 2). The largest
decrease in mean systolic blood pressure, which occurred
in high-income Asia Pacifi c, was 3·2 mm Hg per decade
(95% CrI 2·4–3·9) for women and 2·4 mm Hg per decade
(1·6–3·1) for men (PP>0·9999). The largest decrease in
mean diastolic blood pressure, which was in the
high-income western super-region, was 1·8 mm Hg
per decade (1·4–2·3) for women and 1·5 mm Hg
per decade (1·0–1·9) for men (PP>0·9999). Mean systolic
blood pressure also seems to have decreased in women
in central and eastern Europe, Latin America and the
Caribbean, and, more recently, central Asia, Middle East,
and north Africa, but the estimated trends in these
super-regions had larger uncertainty than those in
high-income super-regions; mean diastolic blood
pressure showed a similar, but less pronounced, decrease
in these super-regions (fi gures 1, 2). Little or no change
in mean systolic or mean diastolic blood pressure
occurred in men in these super-regions.
blood pressure (fi gures 1, 2). Central and eastern Europe,
sub-Saharan Africa, and south Asia had the highest
mean blood pressures in 2015.
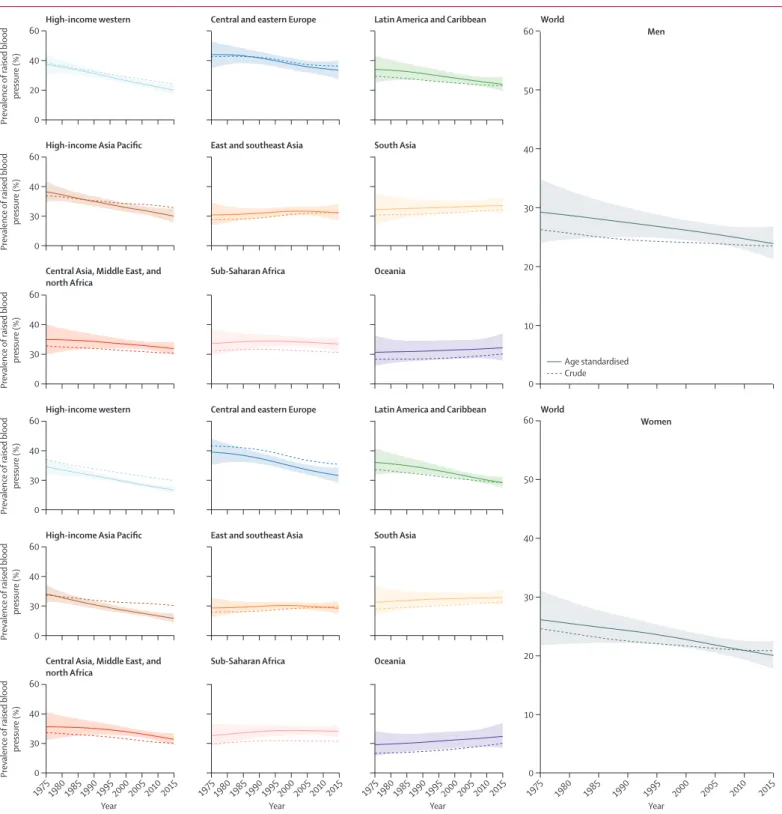
Age-standardised prevalence of raised blood pressure
decreased globally from 1975 to 2015, from
29·5% (95% CrI 24·2–35·0) to 24·1% (21·4–27·1) in
men (PP=0·9482) and from 26·1% (21·7–31·1) to
20·1% (17·8–22·5) in women (PP=0·9884). The largest
decrease was seen in high-income super-regions,
followed by Latin America and the Caribbean, central
Figure 1: Trends in age-standardised mean systolic blood pressure by sex and super-region in people aged 18 years and older The lines show the posterior mean estimates and the shaded areas show the 95% CrI. See appendix (pp 199–266) for trends by country.
1975 1980 1985 1990 1995 2000 2005 2010 2015
110 120 130 140
Mean systolic
blood pressure (mm Hg)
Year
1975 1980 1985 1990 1995 2000 2005 2010 2015
Year
1975 1980 1985 1990 1995 2000 2005 20102015 1975 1980 1985 1990 1995 2000 2005 2010 2015
Year Year
110 120 130 140
Mean systolic
blood pressure (mm Hg)
110 120 130 140
Mean systolic
blood pressure (mm Hg)
110 120 130 140
Mean systolic
blood pressure (mm Hg)
Central Asia, Middle East, and north Africa
Sub-Saharan Africa Oceania
World
Men
Women
110 120 130 140
Mean systolic
blood pressure (mm Hg)
High-income Asia Pacific East and southeast Asia South Asia
110 120 130 140
Mean systolic
blood pressure (mm Hg)
High-income western Central and eastern Europe Latin America and Caribbean
Central Asia, Middle East, and north Africa
Sub-Saharan Africa Oceania
High-income Asia Pacific East and southeast Asia South Asia
High-income western Central and eastern Europe Latin America and Caribbean
110 115 120 125 130 135 140
World
and eastern Europe, and central Asia, Middle East,
and north Africa (fi gure 3). Elsewhere, age-standardised
prevalence of raised blood pressure remained
unchanged. Crude prevalence de
creased more
slowly than age-standardised prevalence, especially
where there has been substantial ageing (eg, in
high-income super-regions and Latin America and the
Caribbean).
South Korea and Canada had the lowest
age-standardised mean systolic blood pressure in 2015 for
Figure 2: Trends in age-standardised mean diastolic blood pressure by sex and super-region in people aged 18 years and older The lines show the posterior mean estimates and the shaded areas show the 95% CrI. See appendix (pp 199–266) for trends by country.
1975 1980 1985 1990 1995 2000 2005 2010 2015
Mean diastolic
blood pressure (mm Hg)
Year
1975 1980 1985 1990 1995 2000 2005 2010 2015
Year
1975 1980 1985 1990 1995 2000 2005 20102015 1975 1980 1985 1990 1995 2000 2005 2010 2015
Year Year
Mean diastolic
blood pressure (mm Hg)
Mean diastolic
blood pressure (mm Hg)
Mean diastolic
blood pressure (mm Hg)
Central Asia, Middle East, and north Africa
Sub-Saharan Africa Oceania
World
Mean diastolic
blood pressure (mm Hg)
High-income Asia Pacific East and southeast Asia South Asia
65 75
70 80 90
85
65 75
70 80 90
85
65 75
70 80 90
85
65 75
70 80 90
85
65 75
70 80 90
85
65 75
70 80 90
85
Mean diastolic
blood pressure (mm Hg)
High-income western Central and eastern Europe Latin America and Caribbean
Central Asia, Middle East, and north Africa
Sub-Saharan Africa Oceania
High-income Asia Pacific East and southeast Asia South Asia
High-income western Central and eastern Europe Latin America and Caribbean
65 70 75 80 85 90
65 70 75 80 85 90
World
Men
both men (117–118 mm Hg) and women (about
111 mm Hg; fi gure 4). The highest mean systolic blood
pressures in men were seen in some countries in central
and eastern Europe (eg, Slovenia, Lithuania, and Croatia),
Oceania, central Asia, and sub-Saharan Africa, with
age-standardised mean systolic blood pressure reaching
137·5 mm Hg (95% CrI 131·2–143·8) in Slovenia.
Women in a few countries in sub-Saharan Africa
(eg, Niger, Guinea, Malawi, and Mozambique) had the
highest levels of mean systolic blood pressure, surpassing
1975 1980 1985 1990 1995 2000 2005 2010 2015
Prevalence
of raised blood
pressure (%)
Year
1975 1980 1985 1990 1995 2000 2005 2010 2015
Year
1975 1980 1985 1990 1995 2000 2005 20102015 1975 1980 1985 1990 1995 2000 2005 2010 2015
Year Year
Prevalence
of raised blood
pressure (%)
Prevalence
of raised blood
pressure (%)
Prevalence
of raised blood
pressure (%)
Central Asia, Middle East, and north Africa
Sub-Saharan Africa Oceania
World
Prevalence
of raised blood
pressure (%)
High-income Asia Pacific East and southeast Asia South Asia
0 40
20 60
0 40
30 60
0 40
30 60
0 40
30 60
0 40
30 60
0 40
30 60
Prevalence
of raised blood
pressure (%)
High-income western Central and eastern Europe Latin America and Caribbean
Central Asia, Middle East, and north Africa
Sub-Saharan Africa Oceania
High-income Asia Pacific East and southeast Asia South Asia
High-income western Central and eastern Europe Latin America and Caribbean
0 10 20 30 50
40 60
0 10 20 30 50
40 60
World
Age standardised Crude
Men
Women
Figure 3: Trends in age-standardised and crude prevalence of raised blood pressure by sex and super-region in people aged 18 years and older
Figure 4: Age-standardised mean systolic blood pressure, mean diastolic blood pressure, and prevalence of raised blood pressure by sex and country in 2015 in people aged 18 years and older Interactive versions of these maps and downloadable numerical results are available online.
Mean systolic blood pressure, men 2015
110 115 120 125 130 135 140 Caribbean Caribbean
Mean systolic blood pressure, women 2015
Age-standardised mean systolic blood pressure (mm Hg) Age-standardised mean systolic blood pressure (mm Hg) 110 115 120 125 130 135 140 Caribbean Caribbean
Mean diastolic blood pressure, men 2015
70 75 80 85
Mean diastolic blood pressure, women 2015
Age-standardised mean diastolic blood pressure (mm Hg) 70 75 80 85 Age-standardised mean diastolic blood pressure (mm Hg) Caribbean Caribbean
Raised blood pressure, men 2015
5% 15% 25% 35% 45% 55%
Raised blood pressure, women 2015
132 mm Hg. Countries with the lowest mean diastolic
blood pressure were Peru and several high-income
countries including Canada, Australia, the UK,
New Zealand, and Singapore. Diastolic blood pressure
was high throughout central and eastern Europe,
south Asia, and sub-Saharan Africa, with age-standardised
mean surpassing 85 mm Hg in Lithuanian men. Mean
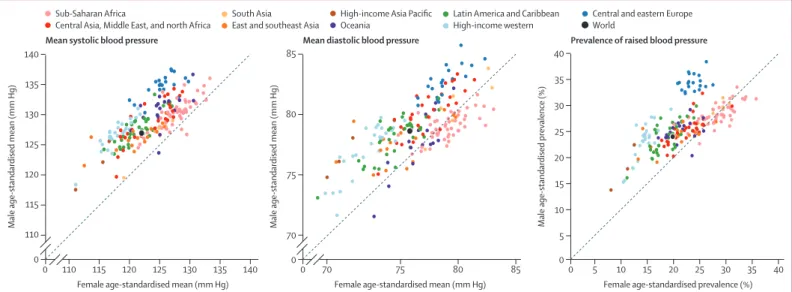
systolic and mean diastolic blood pressure were
correlated across countries (correlation coeffi
cients of
0·69 for men and 0·86 for women in 2015). However,
men and women in countries in south Asia, central and
eastern Europe, and central Asia, Middle East, and
north Africa had higher diastolic blood pressure than
expected on the basis of their systolic blood pressure and
the systolic blood pressure–diastolic blood pressure
association (fi gure 5); the opposite was seen for men and
women in Oceania.
South Korea, Canada, the USA, Peru, the UK,
Singapore and Australia had the lowest prevalence of
raised blood pressure in 2015 for both sexes, with an
age-standardised prevalence of less than 13% in women and
less than 19% in men (fi gure 4). At the other extreme,
age-standardised prevalence surpassed 35% in men in
some countries in central and eastern Europe including
Croatia, Latvia, Lithuania, Hungary, and Slovenia;
prevalence was more than 33% in women in a few
countries in west Africa.
In 2015, men had higher age-standardised mean systolic
blood pressure than women in most countries (fi gure 6).
Men also had higher diastolic blood pressure and
prevalence of raised blood pressure than women in most
countries, except in sub-Saharan Africa, where the sex
pattern was reversed in most countries, and a few countries
in Oceania and Asia. The male–female diff erences in
age-standardised means and prevalence were virtually all
due to diff erences in people younger than 50 years; among
people aged 50 years and older, on average men and
women had similar mean systolic and diastolic blood
pressure and prevalence of raised blood pressure, with
countries divided into some with lower and others with
higher male blood pressure (results not shown). The
male–female diff erence in blood pressure in 2015 was
largest in high-income countries and countries in central
and eastern Europe. Compared with 1975, the male excess
in mean blood pressure increased in high-income
super-regions, central and eastern Europe, Latin America
and the Caribbean, and central Asia, Middle East, and
north Africa but decreased (and in the case of diastolic
blood pressure reversed) in sub-Saharan Africa, Oceania,
and south Asia (results not shown).
The estimated number of adults with raised blood
pressure increased from 594 million in 1975 to 1·13 billion
in 2015 (fi gure 7), comprising 597 million men and
529 million women. At the global level, this increase was
attributable to population growth and ageing, off set
partly by falling age-specifi
c prevalence. In the
high-income western super-region, the absolute number
of people with raised blood pressure has decreased
steadily since 1975 because the steep decrease in
prevalence outweighed the eff ect of population growth
and ageing. Nonetheless, 141 million adults in the
constituent countries had raised blood pressure in 2015.
Similarly, in central and eastern Europe, the number of
people with raised blood pressure peaked in 1988 and
went below its 1975 levels in 2002, driven by decreasing
prevalence. In high-income Asia Pacifi c, the number of
people with raised blood pressure has decreased since
2007 but is still higher than it was in 1975. In other
For interactive maps andnumerical results see www.ncdrisc.org
Figure 5: Relation between age-standardised mean systolic and mean diastolic blood pressure in men and women aged 18 years and older in 2015 The dotted line shows the linear association between the two outcomes. DBP=diastolic blood pressure. SBP=systolic blood pressure.
Sub-Saharan Africa
Central Asia, Middle East, and north Africa South Asia
East and southeast Asia High-income Asia Pacific Oceania
Latin America and Caribbean High-income western Central and eastern Europe
70 75 80 85
Age-standardised mean DBP (mm Hg)
110 115 120 125 130 135
Age-standardised mean SBP (mm Hg)
Men
110 115 120 125 130 135
Age-standardised mean SBP (mm Hg)
low-income and middle-income super-regions, the
number of people with raised blood pressure is still
increasing. In Latin America and the Caribbean and
central Asia, the Middle East, and north Africa, this rise
is a net eff ect of increase due to population growth and
ageing and decrease due to lower age-specifi c prevalence.
In Oceania, south Asia, east and southeast Asia, and
sub-Saharan Africa, three quarters
or more of the rise is
attributable to population growth and ageing, and the
remainder is due to an increase in prevalence (fi gure 7).
In 2015, 258 million (23%) of the 1·13 billion adults with
raised blood pressure lived in south Asia (199 million of
whom in India) and another 235 million (21%) lived in
east Asia (226 million of whom in China).
Discussion
Raised blood pressure has transitioned from a risk factor
largely aff ecting high-income countries to one that is
now most prevalent in low-income countries in
south Asia and sub-Saharan Africa, while being a
persistent health issue in central and eastern Europe.
Although favourable trends continue in high-income
countries, and might also be happening in some
middle-income regions, other low-middle-income and middle-middle-income
regions are aff ected by rising, or at best stable but high,
blood pressure. The number of people with raised blood
pressure in the world has increased by 90% during these
four decades, with the majority of the increase occurring
in low-income and middle-income countries, and largely
driven by the growth and ageing of the population.
At the global level, we estimated lower mean systolic
blood pressure in the 1980s, and hence a smaller
reduction over time, than reported by Danaei and
colleagues,
5possibly because we had more data than
their earlier analysis. At the regional level, the additional
data from low-income and middle-income countries
included in our analysis gave more confi dence to our
fi nding of a rise in mean systolic blood pressure in Asia
and sub-Saharan Africa than the trends estimated by
Danaei and colleagues.
5Our results cannot be directly
compared with the studies by Kearney and colleagues
12and Mills and colleagues
13because these studies included
people who used antihypertensive medicines when
calculating prevalence. Despite this diff erence in the
reported metric, the reports are broadly consistent in
identifying central and eastern Europe, central Asia, and
sub-Saharan Africa as regions at the highest risk. Lawes
and colleagues
14also reported the highest mean systolic
blood pressure in central and eastern Europe and central
Asia, as we did, but unlike our study they found lower
mean systolic blood pressure in south Asia than in most
regions. This diff erence is largely because blood pressure
in south Asia has increased since 2000, the reporting
year of Lawes and colleagues’ study; the diff erence might
also be attributable to us having substantially more data
from south Asia than Lawes and colleagues.
The estimated decrease in blood pressure in
high-income countries in our analysis is consistent with
fi ndings of country studies and the MONICA Project.
15–34Fewer studies have analysed blood pressure trends in
low-income and middle-income countries than in
high-income countries. The available studies suggest
reductions in blood pressure in central and possibly
eastern Europe,
35–38the Middle East and north Africa,
39and Latin America,
40and increases in south Asia and
sub-Saharan Africa,
41–43and possibly in east and
southeast Asia.
44,45We also found that the prevalence of raised blood
pressure decreased in some regions where mean blood
pressure did not change, and remained unchanged
where the mean increased. Some other studies
32,46have
also found a larger decrease in the upper tail of blood
Figure 6: Comparison of age-standardised mean systolic blood pressure, mean diastolic blood pressure, and prevalence of raised blood pressure in men and women aged 18 years and older in 2015 Sub-Saharan Africa
Central Asia, Middle East, and north Africa
High-income Asia Pacific Oceania
South Asia East and southeast Asia
Latin America and Caribbean High-income western
Central and eastern Europe World
115 120 125 130 135
110
0 140
Male age-standardised mean (mm Hg)
110 115 120 125 130 135 140 Female age-standardised mean (mm Hg)
Mean systolic blood pressure
70
0 75 80 85
Male age-standardised mean (mm Hg)
70 0
0 75 80 85
Female age-standardised mean (mm Hg)
Mean diastolic blood pressure
5
0 10 15 20 25 30 35 40
Male age-standardised prevalence (%)
5 10 15 20 25 30 35 40
0
Female age-standardised prevalence (%)
0 200 400 600 800 1000 1200 1400
Number
of adults
with raised blood pressure (millions)
Number of
adults with
raised
blood pressure (millions)
Number
of adults
with raised
blood pressure (millions)
Number of
adults with
raised
blood pressure (millions)
1975 1980 1985 1990 1995 2000 2005 2010 2015 –400
–200 0 200 400 600 800 1000 1200 1400 1600
B
A
C
Year 1975 1980 1985 1990 1995 2000 2005 2010 2015
Year
1975 1980 1985 1990 1995 2000 2005 2010 2015
Year
1975 1980 1985 1990 1995 2000 2005 2010 2015
Year
1975 1980 1985 1990 1995 2000 2005 2010 2015
Year 0
40 80
Central Asia, Middle East, and north Africa Sub-Saharan Africa Oceania
0
–25 25 50
High-income Asia Pacific East and southeast Asia South Asia
–100 100
0 200
0 30 60 90 0 100 200 300 0 50 100
0 0·25 0·75
0·50 1·00 1·25 0 100 200 –50 0 50 150
100
High-income western Central and eastern Europe Latin America and Caribbean
West Africa Central Africa Southern Africa East Africa Middle East and north Africa Central Asia South Asia Southeast Asia East Asia High-income Asia Pacific Melanesia
Polynesia and Micronesia Caribbean
Andean Latin America Central Latin America Southern Latin America
High-income English-speaking countries Northwestern Europe
Southwestern Europe Central Europe Eastern Europe
Change due to change in prevalence
Change due to interaction between change in prevalence and change in population size and age structure
Change due to change in population size and age structure Number of adults with raised blood pressure in 1975
pressure distribution than in its mean. In the MONICA
Project,
16the upper percentiles of blood pressure
distribution decreased more than the mean in some
communities but not in others. Although the changing
shape of the distribution is partly due to antihypertensive
drugs, it has also occurred in younger adult ages when
medication use is uncommon.
32,46To investigate the
drivers of the changing distribution would require
historical data on multiple determinants of blood
pressure throughout the life course. Finally, our fi nding
of a higher mean blood pressure in men than in women,
especially in premenopause ages, is consistent with
previous studies.
47The strengths of our study include its scope in making
consistent and comparable estimates of trends in both
mean and raised blood pressure over four decades for all
the countries in the world. We used a large amount of
population-based data covering countries in which more
than 97% of the global adult population lives. We used
only data from studies that had measured blood pressure
to avoid bias in self-reported data. We analysed data
according to a consistent protocol, and NCD Risk Factor
Collaboration members verifi ed the characteristics of
data from each country through repeated checks. We
pooled data using a statistical model that took into
account the epidemiological features of blood pressure,
including non-linear time trends and age associations.
Our statistical model used all available data while giving
more weight to national data than to subnational and
community sources.
Similar to all global analyses, our study is aff ected by
some limitations. First, some countries had no or few
data sources, especially those in sub-Saharan Africa and
the Caribbean. Estimates for these countries relied
mostly or entirely on the statistical model. The absence
or scarcity of data is refl ected in wider uncertainty
intervals of our estimates for these countries and regions,
emphasising the importance of national NCD-oriented
surveillance. Second, we had fewer data sources for the
years before 1990 in most regions, which was refl ected in
the larger uncertainty for these years. In a sensitivity
analysis, we analysed trends starting in 1990 with an
identical model, and compared the post-1990 estimates
with estimates from the main analysis (which included
data from 1975 onwards). The estimates were very similar
with correlation coeffi
cients between the estimates from
the main and sensitivity analyses being 0·94 or higher in
1990 and 0·98 or higher in 2015 (appendix pp 197, 198).
Third, only 53% of sources included people older than
70 years, necessitating the use of data in these older ages
elsewhere to infer an age pattern and make estimates in
older ages. In view of the ageing trends throughout the
world, inclusion of older people in health surveys should
be emphasised. Fourth, our model accounted and
adjusted for systematic and random errors in subnational
and community data. However, the adjustments are not
country-specifi c because estimation of country-specifi c
adjustments would require national and subnational or
community data in the same country and year. Therefore,
the correction for each single country remains uncertain.
Fifth, although data held by NCD Risk Factor
Collaboration members were analysed to provide all the
primary outcomes, individual participant data could not
be accessed for 20% of data sources. To overcome this
issue, we systematically used the reported metrics to
estimate all of our primary outcomes; the cross-walking
regressions used for this purpose had good predictive
accuracy but increased the uncertainty of our estimates.
Sixth, over time, standard mercury sphygmomanometers
have been replaced by random-zero sphygmomanometers
and more recently digital oscillometric devices in health
surveys. Similarly, studies diff ered on whether they used
multiple cuff sizes or one cuff size. We note that the
eff ect of measurement device and protocol on population
mean and prevalence depends on the circumstances of
each survey. For example, an automated digital device
with a standard cuff , although not the traditional
gold-standard in a clinical setting, avoids observer bias and
increases compliance, and possibly even response rate,
compared with a standard mercury sphygmomanometer
with multiple cuff s.
48Nonetheless, measurements from
diff erent devices are not fully comparable,
49–51which
might have aff ected the estimated trends. When we
included device type as study-level covariate in our
statistical model, studies using random-zero
sphygmomanometers, which were used commonly in
the late 1980s and 1990s, had lower mean blood pressure
(by about 4·5 mm Hg for systolic blood pressure and by
about 3 mm Hg for diastolic blood pressure) and
prevalence of raised blood pressure than studies using
standard mercury sphygmomanometers. The mean
diff erence between studies using digital devices and
mercury sphygmomanometers was about 2 mm Hg for
systolic blood pressure and about 0·2 mm Hg for
diastolic blood pressure. Finally, blood pressure had been
measured only once in some of our data sources. In
those sources with multiple measurements, the median
diff erence between the fi rst measurement and the
average of subsequent ones was 1·5 mm Hg for systolic
blood pressure and 0·0 mm Hg for diastolic blood
pressure, suggesting that mean blood pressure and
prevalence of raised blood pressure might be slightly
overestimated in some of our sources.
Blood pressure is a multifaceted trait, aff ected by
nutrition, environment, and behaviour throughout the
life course, including fetal and early childhood nutrition
and growth,
52adiposity,
53,54specifi c components of diet,
especially sodium and potassium intakes,
53alcohol
use,
54,55smoking,
56physical activity,
54air pollution,
57lead,
58decrease seems to have begun before or in the absence of
specifi c interventions for risk factors and scale-up of
treatment, and is only partly accounted for by the
measured risk factors and treatment.
17,19–21,34,35,46,60–70In
particular, the decrease in high-income and some
middle-income countries has happened despite
increasing body-mass index.
71The partly unexplained nature of these favourable
trends necessitates speculation about their drivers, which
might include unmeasured improvements in early
childhood nutrition and year-round availability of fruits
and vegetables, which might increase the amount and
regularity of their consumption. Our results show that
similar decreasing trends in mean blood pressure and
prevalence of raised blood pressure might have begun in
some middle-income regions, although at a slower rate
than trends in high-income regions, but not in the
poorest populations, including those in south Asia and
sub-Saharan Africa, and in populations aff ected by major
social and economic changes in central and eastern
Europe. These populations have low consumption of
fresh fruits
72and, in many cases, high consumption
of salt.
73South Asia and sub-Saharan Africa have the
highest prevalence of maternal undernutrition,
71,74preterm and small-for-gestational age births, and child
undernutrition;
75,76they have also had some of the
smallest gains in adult height,
74which is associated with
lower risk of cardiovascular diseases. Many cases of
raised blood pressure go untreated in these regions.
13,77The absence of these favourable determinants of low
blood pressure, coupled with rising body-mass index,
71might be causing the increase in mean blood pressure
in these regions. Therefore, if governments and
multinational organisations are to address the large and
inequitable burden of cardiovascular diseases and kidney
disease associated with high blood pressure, they need to
take a multifaceted approach using both
population-based strategies throughout the life course and individual
lifestyle management and treatment through primary
care systems.
78Contributors
ME designed the study and oversaw research. Members of the Country and Regional Data Group collected and reanalysed data, and checked pooled data for accuracy of information about their study and other studies in their country. BZ and MDC led data collection. BZ and JB led the statistical analysis. BZ prepared results. Members of the Pooled Analysis and Writing Group collated data, checked all data sources in consultation with the Country and Regional Data Group, analysed pooled data, and prepared results. BZ and ME wrote the fi rst draft of the report with input from other members of the Pooled Analysis and Writing Group. Members of the Country and Regional Data Group commented on the draft report.
NCD Risk Factor Collaboration (NCD-RisC)
Pooled Analysis and Writing (* equal contribution)—Bin Zhou (Imperial
College London, UK); James Bentham (Imperial College London, UK)*; Mariachiara Di Cesare (Middlesex University, UK)*; Honor Bixby (Imperial College London, UK); Goodarz Danaei (Harvard T H Chan School of Public Health, USA); Melanie J Cowan (World Health Organization, Switzerland); Christopher J Paciorek (University of California, Berkeley, USA); Gitanjali Singh (Tufts University, USA);
Kaveh Hajifathalian (Harvard T H Chan School of Public Health, USA); James E Bennett (Imperial College London, UK); Cristina Taddei (Imperial College London, UK); Ver Bilano (Imperial College London, UK); Rodrigo M Carrillo-Larco (Universidad Peruana Cayetano Heredia, Peru); Shirin Djalalinia (Tehran University of Medical Sciences, Iran); Shahab Khatibzadeh (Brandeis University, USA); Charles Lugero (Mulago Hospital, Uganda); Niloofar Peykari (Tehran University of Medical Sciences, Iran); Wan Zhu Zhang (Mulago Hospital, Uganda); Yuan Lu (Yale University, USA); Gretchen A Stevens (World Health Organization, Switzerland); Leanne M Riley (World Health Organization, Switzerland); Pascal Bovet (University of Lausanne, Switzerland; Ministry of Health, Seychelles); Prof Paul Elliott (Imperial College London, UK); Prof Dongfeng Gu (National Center for Cardiovascular Diseases, China); Nayu Ikeda (National Institute of Health and Nutrition, Japan); Prof Rod T Jackson (University of Auckland, New Zealand); Prof Michel Joff res (Simon Fraser University, Canada); Prof Andre Pascal Kengne (South African Medical Research Council, South Africa); Prof Tiina Laatikainen (National Institute for Health and Welfare, Finland); Prof Tai Hing Lam (University of Hong Kong, China); Prof Avula Laxmaiah (National Institute of Nutrition, India); Jing Liu (Capital Medical University Beijing An Zhen Hospital, China); J Jaime Miranda (Universidad Peruana Cayetano Heredia, Peru); Prof Charles K Mondo (Mulago Hospital, Uganda);
Hannelore K Neuhauser (Robert Koch Institute, Germany);
Prof Johan Sundström (Uppsala University, Sweden); Prof Liam Smeeth (London School of Hygiene & Tropical Medicine, UK); Maroje Sorić (University of Zagreb, Croatia); Prof Mark Woodward (University of Sydney, Australia; University of Oxford, UK); Prof Majid Ezzati (Imperial College London, UK)
Country and Regional Data (* equal contribution; listed alphabetically)—
Leandra Abarca-Gómez (Caja Costarricense de Seguro Social, Costa Rica)*; Ziad A Abdeen (Al-Quds University, Palestine)*;
Hanan Abdul Rahim (Qatar University, Qatar)*; Niveen M Abu-Rmeileh (Birzeit University, Palestine)*; Benjamin Acosta-Cazares (Instituto Mexicano del Seguro Social, Mexico)*; Robert Adams (The University of Adelaide, Australia)*; Wichai Aekplakorn (Mahidol University, Thailand)*; Kaosar Afsana (BRAC, Bangladesh)*;
Carlos A Aguilar-Salinas (Instituto Nacional de Ciencias Médicas y Nutricion, Mexico)*; Charles Agyemang (University of Amsterdam, Netherlands)*; Alireza Ahmadvand (Non-Communicable Diseases Research Center, Iran)*; Wolfgang Ahrens (Leibniz Institute for Prevention Research and Epidemiology—BIPS, Germany)*;
Rajaa Al Raddadi (Ministry of Health, Saudi Arabia)*; Rihab Al Woyatan (Ministry of Health, Kuwait)*; Mohamed M Ali (World Health Organization Regional Offi ce for the Eastern Mediterranean, Egypt)*; Ala’a Alkerwi (Luxembourg Institute of Health, Luxembourg)*; Eman Aly (World Health Organization Regional Offi ce for the Eastern Mediterranean, Egypt)*; Philippe Amouyel (Lille University and Hospital, France)*; Antoinette Amuzu (London School of Hygiene & Tropical Medicine, UK)*; Lars Bo Andersen (Sogn and Fjordane University College, Norway)*; Sigmund A Anderssen (Norwegian School of Sport Sciences, Norway)*; Lars Ängquist (Bispebjerg and Frederiksberg Hospitals, Denmark)*; Ranjit Mohan Anjana (Madras Diabetes Research Foundation, India)*; Daniel Ansong (Komfo Anokye Teaching Hospital, Ghana)*; Hajer Aounallah-Skhiri (National Institute of Public Health, Tunisia)*; Joana Araújo (University of Porto, Portugal)*; Inger Ariansen (Norwegian Institute of Public Health, Norway)*; Tahir Aris (Ministry of Health Malaysia, Malaysia)*; Nimmathota Arlappa (National Institute of Nutrition, India)*; Krishna Aryal (Nepal Health Research Council, Nepal)*; Dominique Arveiler (Strasbourg University and Hospital, France)*; Felix K Assah (University of Yaoundé 1, Cameroon)*;
(University of Palermo, Italy)*; Alberto Barceló (Pan American Health Organization, USA)*; Amina Barkat (Université Mohammed V de Rabat, Morocco)*; Aluisio J D Barros (Federal University of Pelotas, Brazil)*; Mauro V Barros (University of Pernambuco, Brazil)*; Iqbal Bata (Dalhousie University, Canada)*; Anwar M Batieha (Jordan University of Science and Technology, Jordan)*; Louise A Baur (University of Sydney, Australia)*; Robert Beaglehole (University of Auckland, New Zealand)*; Habiba Ben Romdhane (University Tunis El Manar, Tunisia)*; Mikhail Benet (University Medical Science, Cuba)*; Lowell S Benson (University of Utah School of Medicine, USA)*; Antonio Bernabe-Ortiz (Universidad Peruana Cayetano Heredia, Peru)*; Gailute Bernotiene (Lithuanian University of Health Sciences, Lithuania)*; Heloisa Bettiol (University of São Paulo, Brazil)*; Aroor Bhagyalaxmi (B J Medical College, India)*; Sumit Bharadwaj (Chirayu Medical College, India)*; Santosh K Bhargava (SL Jain Hospital, India)*; Yufang Bi (Shanghai Jiao-Tong University School of Medicine, China)*; Mukharram Bikbov (Ufa Eye Research Institute, Russia)*; Peter Bjerregaard (University of Southern Denmark, Denmark; University of Greenland, Greenland)*; Espen Bjertness (University of Oslo, Norway)*; Cecilia Björkelund (University of Gothenburg, Sweden)*; Anneke Blokstra (National Institute for Public Health and the Environment, Netherlands)*; Simona Bo (University of Turin, Italy)*; Martin Bobak (University College London, UK)*; Heiner Boeing (German Institute of Human Nutrition, Germany)*; Jose G Boggia (Universidad de la República, Uruguay)*;
Carlos P Boissonnet (CEMIC, Argentina)*; Vanina Bongard (Toulouse University School of Medicine, France)*; Pascal Bovet (University of Lausanne, Switzerland; Ministry of Health, Seychelles)*;
Lutgart Braeckman (Ghent University, Belgium)*; Imperia Brajkovich (Universidad Central de Venezuela, Venezuela)*; Francesco Branca (World Health Organization, Switzerland)*; Juergen Breckenkamp (Bielefeld University, Germany)*; Hermann Brenner (German Cancer Research Center, Germany)*; Lizzy M Brewster (University of Amsterdam, Netherlands)*; Graziella Bruno (University of Turin, Italy)*; H B(as) Bueno-de-Mesquita (National Institute for Public Health and the Environment, Netherlands)*; Anna Bugge (University of Southern Denmark, Denmark)*; Con Burns (Cork Institute of Technology, Ireland)*; Michael Bursztyn (Hadassah-Hebrew University Medical Center, Israel)*; Antonio Cabrera de León (Universidad de La Laguna, Spain)*; Joseph Cacciottolo (University of Malta, Malta)*; Christine Cameron (Canadian Fitness and Lifestyle Research Institute, Canada)*; Günay Can (Istanbul University, Turkey)*;
Ana Paula C Cândido (Universidade Federal de Juiz de Fora, Brazil)*; Vincenzo Capuano (Cardiologia di Mercato S Severino, Italy)*; Viviane C Cardoso (University of São Paulo, Brazil)*; Axel C Carlsson (Karolinska Institutet, Sweden)*; Maria J Carvalho (University of Porto, Portugal)*; Felipe F Casanueva (Santiago de Compostela University, Spain)*; Juan-Pablo Casas (University College London, UK)*; Carmelo A Caserta (Associazione Calabrese di Epatologia, Italy)*; Snehalatha Chamukuttan (India Diabetes Research Foundation, India)*; Angelique W Chan (Duke-NUS Medical School, Singapore)*; Queenie Chan (Imperial College London, UK)*;
Himanshu K Chaturvedi (National Institute of Medical Statistics, India)*; Nishi Chaturvedi (University College London, UK)*; Chien-Jen Chen (Academia Sinica, Taiwan)*; Fangfang Chen (Capital Institute of Pediatrics, China)*; Huashuai Chen (Duke University, USA)*; Shuohua Chen (Kailuan General Hospital, China)*; Zhengming Chen (University of Oxford, UK)*; Ching-Yu Cheng (Duke-NUS Medical School, Singapore)*; Imane Cherkaoui Dekkaki (Université Mohammed V de Rabat, Morocco)*; Angela Chetrit (The Gertner Institute for Epidemiology and Health Policy Research, Israel)*; Arnaud Chiolero (Lausanne University Hospital, Switzerland)*; Shu-Ti Chiou (Ministry of Health and Welfare, Taiwan)*; Adela Chirita-Emandi (Victor Babeș University of Medicine and Pharmacy Timisoara, Romania)*; Belong Cho (Seoul National University College of Medicine, South Korea)*; Yumi Cho (Korea Centers for Disease Control and Prevention, South Korea)*; Jerzy Chudek (Medical University of Silesia, Poland)*; Renata Cifkova (Charles University in Prague, Czech Republic)*; Frank Claessens (Katholieke Universiteit Leuven, Belgium)*; Els Clays (Ghent University, Belgium)*; Hans Concin (Agency for Preventive and Social
Medicine, Austria)*; Cyrus Cooper (University of Southampton, UK)*; Rachel Cooper (University College London, UK)*; Tara C Coppinger (Cork Institute of Technology, Ireland)*; Simona Costanzo (IRCCS Istituto Neurologico Mediterraneo Neuromed, Italy)*; Dominique Cottel (Institut Pasteur de Lille, France)*; Chris Cowell (Westmead University of Sydney, Australia)*; Cora L Craig (Canadian Fitness and Lifestyle Research Institute, Canada)*; Ana B Crujeiras (CIBEROBN, Spain)*; Juan J Cruz (Universidad Autónoma de Madrid, Spain)*;
Graziella D’Arrigo (National Council of Research, Italy)*; Eleonora d’Orsi (Federal University of Santa Catarina, Brazil)*; Jean Dallongeville (Institut Pasteur de Lille, France)*;
Albertino Damasceno (Eduardo Mondlane University, Mozambique)*; Goodarz Danaei (Harvard T H Chan School of Public Health, USA)*; Rachel Dankner (The Gertner Institute for Epidemiology and Health Policy Research, Israel)*; Thomas M Dantoft (Research Centre for Prevention and Health, Denmark)*; Luc Dauchet (Lille University Hospital, France)*; Guy De Backer (Ghent University, Belgium)*; Dirk De Bacquer (Ghent University, Belgium)*; Giovanni de Gaetano (IRCCS Istituto Neurologico Mediterraneo Neuromed, Italy)*;
Stefaan De Henauw (Ghent University, Belgium)*; Delphine De Smedt (Ghent University, Belgium)*; Mohan Deepa (Madras Diabetes Research Foundation, India)*; Abbas Dehghan (Erasmus Medical Center Rotterdam, Netherlands)*; Hélène Delisle (University of Montreal, Canada)*; Valérie Deschamps (French Public Health Agency, France)*; Klodian Dhana (Erasmus Medical Center Rotterdam, Netherlands)*; Augusto F Di Castelnuovo (IRCCS Istituto Neurologico Mediterraneo Neuromed, Italy)*; Juvenal Soares Dias-da-Costa (Universidade do Vale do Rio dos Sinos, Brazil)*; Alejandro Diaz (National Council of Scientifi c and Technical Research, Argentina)*; Ty T Dickerson (University of Utah School of Medicine, USA)*; Shirin Djalalinia (Non-Communicable Diseases Research Center, Iran)*; Ha T P Do (National Institute of Nutrition, Vietnam)*; Annette J Dobson (University of Queensland, Australia)*; Chiara Donfrancesco (Istituto Superiore di Sanità, Italy)*;
Medical Center Rotterdam, Netherlands)*; Guillermo Frontera (Hospital Universitario Son Espases, Spain)*; Flavio D Fuchs (Hospital de Clinicas de Porto Alegre, Brazil)*; Sandra C Fuchs (Universidade Federal do Rio Grande do Sul, Brazil)*; Yuki Fujita (Kindai University, Japan)*; Takuro Furusawa (Kyoto University, Japan)*; Zbigniew Gaciong (Medical University of Warsaw, Poland)*; Dickman Gareta (University of KwaZulu-Natal, South Africa)*; Sarah P Garnett (University of Sydney, Australia)*; Jean-Michel Gaspoz (Geneva University Hospitals, Switzerland)*; Magda Gasull (CIBER en Epidemiología y Salud Pública, Spain)*; Louise Gates (Australian Bureau of Statistics, Australia)*; Diana Gavrila (Murcia Regional Health Council, Spain)*; Johanna M Geleijnse (Wageningen University, Netherlands)*; Anoosheh Ghasemian (Endocrinology and Metabolism Research Institute, Iran)*; Anup Ghimire (B P Koirala Institute of Health Sciences, Nepal)*; Simona Giampaoli (Istituto Superiore di Sanità, Italy)*; Francesco Gianfagna (University of Insubria, Italy)*; Jonathan Giovannelli (Lille University Hospital, France)*; Rebecca A Goldsmith (Ministry of Health, Israel)*; Helen Gonçalves (Federal University of Pelotas, Brazil)*; Marcela Gonzalez Gross (Universidad Politécnica de Madrid, Spain)*; Juan P González Rivas (The Andes Clinic of Cardio-Metabolic Studies, Venezuela)*; Frederic Gottrand (Université de Lille 2, France)*; Sidsel Graff -Iversen (Norwegian Institute of Public Health, Norway)*; Dušan Grafnetter (Institute for Clinical and Experimental Medicine, Czech Republic)*; Aneta Grajda (The Children’s Memorial Health Institute, Poland)*; Ronald D Gregor (Dalhousie University, Canada)*; Tomasz Grodzicki (Jagiellonian University Medical College, Poland)*; Anders Grøntved (University of Southern Denmark, Denmark)*; Grabriella Gruden (University of Turin, Italy)*; Vera Grujic (University of Novi Sad, Serbia)*; Dongfeng Gu (National Center for Cardiovascular Diseases, China)*; Ong Peng Guan (Singapore Eye Research Institute, Singapore)*; Vilmundur Gudnason (University of Iceland, Iceland)*; Ramiro Guerrero (Universidad Icesi, Colombia)*; Idris Guessous (Geneva University Hospitals, Switzerland)*; Andre L Guimaraes (State University of Montes Claros, Brazil)*; Martin C Gulliford (King’s College London, UK)*; Johanna Gunnlaugsdottir (Icelandic Heart Association, Iceland)*; Marc Gunter (Imperial College London, UK)*; Prakash C Gupta (Healis-Sekhsaria Institute for Public Health, India)*; Oye Gureje (University of Ibadan, Nigeria)*; Beata Gurzkowska (The Children’s Memorial Health Institute, Poland)*; Laura Gutierrez (Institute for Clinical Eff ectiveness and Health Policy, Argentina)*; Felix Gutzwiller (University of Zurich, Switzerland)*; Farzad Hadaegh (Shahid Beheshti University of Medical Sciences, Iran)*; Jytte Halkjær (Danish Cancer Society Research Centre, Denmark)*; Ian R Hambleton (The University of the West Indies, Barbados)*; Rebecca Hardy (University College London, UK)*; Rachakulla Harikumar (National Institute of Nutrition, India)*; Jun Hata (Kyushu University, Japan)*; Alison J Hayes (University of Sydney, Australia)*; Jiang He (Tulane University, USA)*; Marleen Elisabeth Hendriks (Academic Medical Center Amsterdam, Netherlands)*; Ana Henriques (University of Porto, Portugal)*; Leticia Hernandez Cadena (National Institute of Public Health, Mexico)*; Herqutanto (Universitas Indonesia, Indonesia)*; Sauli Herrala (Oulu University Hospital, Finland)*; Ramin Heshmat (Chronic Diseases Research Center, Iran)*; Ilpo Tapani Hihtaniemi (Imperial College London, UK)*; Sai Yin Ho (University of Hong Kong, China)*; Suzanne C Ho (The Chinese University of Hong Kong, China)*; Michael Hobbs (University of Western Australia, Australia)*; Albert Hofman (Erasmus Medical Center Rotterdam, Netherlands)*; Gonul Horasan Dinc (Celal Bayar University, Turkey)*;
Claudia M Hormiga (Fundación Oftalmológica de Santander, Colombia)*; Bernardo L Horta (Universidade Federal de Pelotas, Brazil)*; Leila Houti (University of Oran 1, Algeria)*; Christina Howitt (The University of the West Indies, Barbados)*; Thein Thein Htay (University of Public Health, Myanmar)*; Aung Soe Htet (Ministry of Health, Myanmar)*; Yonghua Hu (Peking University, China)*; José María Huerta (CIBER en Epidemiología y Salud Pública, Spain)*; Abdullatif S Husseini (Birzeit University, Palestine)*; Inge Huybrechts (International Agency for Research on Cancer, France)*; Nahla Hwalla (American University of Beirut, Lebanon)*; Licia Iacoviello (IRCCS Istituto Neurologico Mediterraneo Neuromed, Italy)*; Anna G Iannone (Cardiologia di Mercato S. Severino, Italy)*; M Mohsen Ibrahim (Cairo
University, Egypt)*; Nayu Ikeda (National Institute of Health and Nutrition, Japan)*; M Arfan Ikram (Erasmus Medical Center Rotterdam, Netherlands)*; Vilma E Irazola (Institute for Clinical Eff ectiveness and Health Policy, Argentina)*; Muhammad Islam (Aga Khan University, Pakistan)*; Vanja Ivkovic (UHC Zagreb, Croatia)*; Masanori Iwasaki (Niigata University, Japan)*; Rod T Jackson (University of Auckland, New Zealand)*; Jeremy M Jacobs (Hadassah University Medical Center, Israel)*; Tazeen Jafar (Duke-NUS Medical School, Singapore)*; Konrad Jamrozik (University of Adelaide, Australia; deceased)*; Imre Janszky (Norwegian University of Science and Technology, Norway)*; Grazyna Jasienska (Jagiellonian University Medical College, Poland)*; Bojan Jelakovic (University of Zagreb School of Medicine, Croatia)*; Chao Qiang Jiang (Guangzhou 12th Hospital, China)*; Michel Joff res (Simon Fraser University, Canada)*; Mattias Johansson (International Agency for Research on Cancer, France)*; Jost B Jonas (Ruprecht-Karls-University of Heidelberg, Germany)*;
Torben Jørgensen (Research Centre for Prevention and Health, Denmark)*; Pradeep Joshi (World Health Organization Country Offi ce, India)*; Anne Juolevi (National Institute for Health and Welfare, Finland)*; Gregor Jurak (University of Ljubljana, Slovenia)*; Vesna Jureša (University of Zagreb, Croatia)*; Rudolf Kaaks (German Cancer Research Center, Germany)*; Anthony Kafatos (University of Crete, Greece)*; Ofra Kalter-Leibovici (The Gertner Institute for Epidemiology and Health Policy Research, Israel)*; Nor Azmi Kamaruddin (Universiti Kebangsaan Malaysia, Malaysia)*; Amir Kasaeian (Tehran University of Medical Sciences, Iran)*; Joanne Katz (Johns Hopkins Bloomberg School of Public Health, USA)*; Jussi Kauhanen (University of Eastern Finland, Finland)*; Prabhdeep Kaur (National Institute of Epidemiology, India)*; Maryam Kavousi (Erasmus Medical Center Rotterdam, Netherlands)*; Gyulli Kazakbaeva (Ufa Eye Research Institute, Russia)*; Ulrich Keil (University of Münster, Germany)*; Lital Keinan Boker (Israel Center for Disease Control, Israel)*; Sirkka Keinänen-Kiukaanniemi (Oulu University Hospital, Finland)*; Roya Kelishadi (Research Institute for Primordial Prevention of Non-Communicable Disease, Iran)*; Han C G Kemper (VU University Medical Center, Netherlands)*; Andre Pascal Kengne (South African Medical Research Council, South Africa)*; Mathilde Kersting (Research Institute of Child Nutrition, Germany)*; Timothy Key (University of Oxford, UK)*;
Yousef Saleh Khader (Jordan University of Science and Technology, Jordan)*; Davood Khalili (Shahid Beheshti University of Medical Sciences, Iran)*; Young-Ho Khang (Seoul National University, South Korea)*; Kay-Tee Khaw (University of Cambridge, UK)*; Stefan Kiechl (Medical University of Innsbruck, Austria)*; Japhet Killewo (Muhimbili University of Health and Allied Sciences, Tanzania)*; Jeongseon Kim (National Cancer Center, South Korea)*; Jurate Klumbiene (Lithuanian University of Health Sciences, Lithuania)*; Elin Kolle (Norwegian School of Sport Sciences, Norway)*; Patrick Kolsteren (Institute of Tropical Medicine, Belgium)*; Paul Korrovits (Tartu University Clinics, Estonia)*; Seppo Koskinen (National Institute for Health and Welfare, Finland)*; Katsuyasu Kouda (Kindai University, Japan)*;
Slawomir Koziel (Polish Academy of Sciences Anthropology Unit in Wroclaw, Poland)*; Peter Lund Kristensen (University of Southern Denmark, Denmark)*; Steinar Krokstad (Norwegian University of Science and Technology, Norway)*; Daan Kromhout (University of Groningen, Netherlands)*; Herculina S Kruger (North-West University, South Africa)*; Ruzena Kubinova (National Institute of Public Health, Czech Republic)*; Renata Kuciene (Lithuanian University of Health Sciences, Lithuania)*; Diana Kuh (University College London, UK)*; Urho M Kujala (University of Jyväskylä, Finland)*; Krzysztof Kula (Medical University of Łodz, Poland)*; Zbigniew Kulaga (The Children’s Memorial Health Institute, Poland)*; R Krishna Kumar (Amrita Institute of Medical Sciences, India)*; Pawel Kurjata (The Cardinal Wyszynski Institute of Cardiology, Poland)*; Yadlapalli S Kusuma (All India Institute of Medical Sciences, India)*; Kari Kuulasmaa (National Institute for Health and Welfare, Finland)*; Catherine Kyobutungi (African Population and Health Research Center, Kenya)*;