A Work Project, presented as part of the requirements for the Award of a Masters Degree in Economics from the NOVA – School of Business and Economics.
Fossil Fuel Dependence and Interfuel Substitution in the
Electricity Sector of Western European Countries between
1990-2011
ANA LUÍSA ROBALO CORREIA
Student Number 558
A Project carried out on Applied Policy Analysis, under the supervision of:
Maria Antonieta da Cunha e Sá
Fossil Fuel Dependence and Interfuel Substitution in the Electricity Sector
of Western European Countries between 1990-2011
Abstract 1
This paper investigates (i) the diversity of fuel mix for power generation in the European Union measured by the Shannon-Weiner Index (SWI) computed for the 28 member-states between 1990 and 2010, and (ii) the degree of interfuel substitution in the electricity system of eight Western European countries where liberalization and other public policies have been implemented since the 1990s. We find evidence of high concentration of fuels for power generation, with fossil fuel sources still dominating the fuel-mix in spite of concerns over energy security supply and compliance with the EU target to reduce CO2 emissions to 20% below 1990 levels by 2020. A Linear Logit Model was built to compute the elasticities of substitution between coal, natural gas and oil, accounting for electricity market liberalization and the creation of the Emissions Trading Scheme (ETS) in the Western power sector for 1990-2011. The findings suggest that natural gas has been regarded as a transition fuel to a low-carbon area, mostly at the expense of oil. Liberalization has also generated more flexibility for fuel-switching.
Keywords: Electricity production, fossil fuel dependence, interfuel substitution, CO2
emissions, liberalization
1. Introduction
Worldwide, energy demand is on the rise. According to BP Statistical Review 2013, in 2012 primary energy consumption reached 12476.6 million tonnes of oil
equivalent (Mtoe). In the European Union this value was of 1673.4 Mtoe for the same year and electricity generation accounted for 327.73 Mtoe, that is, around 20% of total generation (Enerdata, 2013).
1
New challenges have taken place in the global energy market. The expected rise in energy demand is very likely to imply higher prices charged to all sectors of the economy. External events, like the Fukushima nuclear disaster, motivated the phase-out of some nuclear stations around the globe that were crucial for energy generation. Moreover, differences in prices across the world have been affecting competitiveness significantly. For instance, unconventional gas (namely shale gas) in the United States has been responsible for the decrease of gas and electricity prices in the country, while in the EU both prices have been increasing. Also, considering that the flexibility for electricity generation is highly dependent on several aspects such as fuel price changes and new technological arrangements, and that there is a widely-known prominent link between CO2 emissions and power generation from fossil fuels, minimizing the risks associated with the electricity sector should be regarded as a key priority in the agenda for energy sustainability.
As a result, the EU has defined three main pillars to deal with this new paradigm (Fig A1, pg.1, Appendix) - competitiveness, security of energy supply and sustainability-. One way of addressing these three dimensions is through the European energy liberalization that promotes the development of an internal market for electricity and natural gas and hence stimulates both competition and efficiency by harmonizing regulations and promoting integration of energy networks and systems. The European Commission´s Energy Roadmap 2050 highlights the need for member states to commit
Emissions Trading Scheme (ETS). Other energy issues raising concerns at the EU level include the net oil and gas rising import dependence (Fig A2, pg.1, Appendix). In particular, gas supply is very dependent on a small number of suppliers thus posing additional problems in terms of security of energy supply.
The goal of this work project is twofold. First, to analyze the degree of fuel-dependence for electricity generation in the EU28, and second to focus on fuel switching behaviour in the Western European electricity system as well as on the impact of specific policies targeted at altering the degree of interfuel substitution. We find that overall the fuel-mix in the EU countries for power generation is very concentrated on a few sources and that it is still dominated by fossil fuels despite their negative environmental impact. Nevertheless, this impact has been minimized since 1990 with natural gas being regarded as the transition fuel for a low-carbon future in the region. This paper claims that in the presence of fossil-fuel dependence and environmental regulations to reduce CO2 emissions, understanding the behaviour of fuel-switching is crucial for policy purposes, as stated in the Energy Roadmap 2050.
2. Literature Review
A profusion of studies concerning the relevance of inter-fuel substitution has cropped up in the literature since the 1970s. There are three main methodological approaches to deal with this issue, namely by making use of the Translog cost function, the Generalized Leontief cost function and the Linear Logit model.
In a survey of econometric analysis, Söderholm (1998b) noted that the most common approach to deal with inter-fuel substitution is dual theory based on a flexible translog cost function assuming weak separability of inputs. Hence a minimization problem of the variable costs is used to find the optimal choice of fuel inputs which is crucial for the computation of fuel demands and elasticities of substitution. The translog specification is preferred to the Constant Elasticity of Substitution (CES) or Cobb-Douglas production functions because it imposes fewer restrictions on the functional form thus allowing for the computation of more general elasticities of substitution (Paterson, 2012). Atkinson and Halvorsen (1976) developed and applied a translog functional form to the US electric power industry to study the displacement between oil, natural gas and coal in the country.
First, the linear logit model restricts the cost shares to be between zero and one, while in the translog case it is only possible to estimate the cost shares for that interval over a limited set of prices. Therefore, in contrast to the linear logit model that ensures that monotonicity is always verified, the translog technique violates this principle whenever the estimated cost shares are negative. Second, Considine (1989a) noted that the linear logit model generates more coherent own-price elasticities than the translog form and that the former ensures a more stable method to model cost-shares than the latter since the concavity of the cost function tends to be always preserved. However, one argument against the logit model is that symmetry cannot be verified globally for all cost shares.
The Generalized Leontief (GL) cost function is another common flexible functional form cost function suggested in the first place by Diewert (1971). The main advantage of this approach is that if certain coefficient restrictions are imposed on the GL cost function, it is equivalent to the traditional Leontief cost function with a fixed technology. Söderholm et al. (2011) employed a GL specification to model fossil-fuel switching in the Western European power sector. Nevertheless, most researchers still favor the linear logit and the translog models to the GL functional form due to, for example, the latter´s cumbersome construction of the elasticities of substitution and more frequent violations of concavity that provide less reasonable own-price elasticities.
The inclusion of climate and energy regulatory variables has also been highly present in research papers. Söderholm (1999) used a ‘regulatory intensity’ variable to
3. Discussion
This section aims at contributing toraise the awareness on energy dependence in the European Union. In fact, there is a generalized concern that Member States which have not diversified their electricity generation sources might face a large risk of exposure to external events, such as fuel price volatility and energy security supply problems. The analysis will focus more deeply on the characteristics of fuel-switching behaviour in the Western power sector as well as on the impact of certain policies on the undertaken fuel choices. Hence, a Dynamic Linear Logit model of fossil fuel choice is estimated for the period 1990-2011.
3.1. Fuel dependence in the EU 28 electricity systems
As mentioned before, energy security supply has been regarded by the EU as mandatory for avoiding disastrous economic and social consequences related to energy shortages and price volatility. In this context, we examine first the evolution of the diversity in the fuel-mix for power generation for each member state as described by Table A1(pg.2, Appendix) for 1990 and 2010. Indeed, except for a few countries, the majority of the member states still rely mostly on fossil fuels for electricity production thus inducing a serious problem of dependence on them. Also, countries like Austria and Latvia face a risky situation as hydroelectric production is a major source of power generation that has not been sufficiently complemented by other energy sources. By computing the Shannon-Weiner Index (SWI) (Bhattacharyya, 2009) for each member
state we can infer how fuel-mix has changed for each of them.
Additionally, this index is often used to analyze import diversification but for the purpose of this work only diversification of the fuel-mix is considered under the assumption that any electric system will respond better and with less damage to external shocks the wider the range of fuel options available (Costello, 2007). Hence, the SWI is computed as follows:
(1)
where xirepresents each fuel-share for electricity generation.
Based on Bhattacharyya (2009) we introduced a negative sign before the equation to transform it in a positive value. By inspection of (1), we observe that when SWI is zero it indicates that all electricity in the country comes from a single fuel. As the fuel-mix is expanded the index will also increase. However, one problem of this index is that its functional form does not allow for an objective and direct interpretation of its values. In spite of that, researchers have agreed that a value lower than 1.0 indicates a combination of one or two different fuels whereas a value above 2.0 refers to a diversified fuel-mix for power generation.
The following figures illustrate the evolution of the SWI for the EU 28 countries by region according to the United Nations Statistical Division of European regions for the period 1990-2012 (the Baltic member states were separated from the other Northern countries to make the reading of the graphs easier).2 Data were collected from the World Bank “World Development Indicators”. With respect to Southern countries the critical situation of Malta stands out as the country has relied on oil to produce almost all electricity meaning that the SWI is very close to zero. Greece has moved to a more
favourable situation in this period and nowadays is very close to the other southern countries that have a moderate diversification of the fuel-mix. Furthermore, the Baltic nations have a considerable concentrated fuel-mix and especially in Estonia this index has been deteriorating across time. Northern European countries have values between 1.0 and 1.8. In what concerns Eastern member states, with the exception of Poland and the Czech Republic, those countries present an acceptable degree of diversification, with values ranging between 1.0 and 1.7. Finally, Western countries (with the exception of Luxembourg that has an over-reliance on oil nowadays) exhibit a pattern similar to Eastern countries.
Fig.1. SWI of electricity generation mix in Southern member states
Fig.2. SWI of electricity generation mix in Baltic member states
0 0.3 0.6 0.9 1.2 1.5 1.8
1990 1993 1996 1999 2002 2005 2008 2011
SWI
Year
Spain Portugal Italy Greece Malta Cyprus Slovenia Croatia
0 0.3 0.6 0.9 1.2
1990 1993 1996 1999 2002 2005 2008 2011
SWI
Year
Fig.3. SWI of electricity generation mix in Northern EU member states
Fig.4.SWI of electricity generation mix in Eastern EU member states
Fig.5. SWI of electricity generation mix in Western EU member states
3.2. Interfuel substitution in the Western electricity system
The purpose of this sub-section is to present the econometric methodology used for the estimation of a fuel demand function relating inputs prices and the level of output. The estimated parameters were used for the computation of own-price and cross-price elasticities from which we can infer the degree of interfuel substitution in the Western region- Austria, Belgium, Germany, Ireland, Italy, Netherlands and the
0.3 0.6 0.9 1.2 1.5 1.8
1990 1993 1996 1999 2002 2005 2008 2011
SWI
Year
Sweden Finland Denmark UK Ireland
0 0.4 0.8 1.2 1.6
1990 1993 1996 1999 2002 2005 2008 2011
SWI
Year
Czech Republic Hungary Poland Slovakia Bulgaria Romania
0.2 0.5 0.8 1.1 1.4
1990 1993 1996 1999 2002 2005 2008 2011
SWI
Year
United Kingdom- between 1990 and 2011. In addition to this, some policy variables were included to assess their impact on fossil-fueled electric generation.
3.2.1 A Dynamic Linear Logit Model
Despite being commonly associated with discrete choice problems, logit models are of great use whenever the desired outcomes need to be non-negative and sum to the unity, such as the case of cost shares. Besides, the logistic distribution provides a close approximation to the cumulative normal distribution and enables easier computations because “a closed form solution of the multivariate normal integral does not exist”.3 The
logit model also deals well with restrictions imposed by economic theory and reports more accurately the adjustment of the unobserved capital stocks to any change in input prices.
The empirical model adopted in this paper analyzes the substitution between three broad classes of fossil fuels - coal, natural gas and oil- in power plants. We assume that an energy aggregate involving all fuel inputs can be created and that they are weakly separable from capital and labor.4 This leads to the following general cost function (Chambers, 1988) (suppressing time and country indexes):
(2)
where PE is a vector of factor prices and PC, PO, PG are the fuel input prices of coal, oil
and natural gas, respectively. PL is the price of labor and PK is the price of capital.
3 Berkson (1944)
4 The assumption of separability implies that the marginal rate of technical substitution between fuel
Based on Considine and Mount (1984) a linear logit model is considered assuming that each input´s share (Si) can be modeled as a logistic function of both the
input prices and the level of output (fi), as follows:
, for i =1,2,…N (3)
and (4)
where e is the exponential operator, Pi is the price of input i, Pj is the price of input j, Ei
is the fossil-fuel use of the ith fuel and Q stands for the electric output level. The terms
ηiare the intercepts and represent the “baseline” cost shares that appear in each input´s
equation. The coefficients ϕij indicate how the cost share associated with input i changes
when the price of an input j varies. Finally, the coefficients αij give the effect of a
change in total electricity generation on each cost share.
Hence the logit model converts the share equations represented by equation (2) into linear functions. This specification results in three main advantages. First, the structure of the exponential form of the logit model restricts the predicted shares to be positive and add up to one. Second, the non-additive error term structure of ԑit is more
appropriate to verify the normality assumptions. Third, the logit specification does not place any restrictions on the autoregressive process of the structural error term.
The first condition is satisfied by construction as a logistic approximation guarantees the non-negativity of the cost-shares. Moreover, zero- degree homogeneity in prices (i.e. if all prices change in the same proportion, there will be no effect on relative cost shares) can be guaranteed by imposing , where d is an
arbitrary constant usually set to be zero (Considine and Mount, 1984). Regarding the last property, while we can impose a priori the symmetry restrictions, the negative
semi-definiteness of the Hessian matrix is not possible. Hence the concavity of the cost function can only be checked after the estimation of the model by looking at the sign of the own-price elasticities. To impose symmetry restrictions the coefficients have to be redefined as
, where are the full-equilibrium (time-invariant) cost shares
for fuel inputs, meaning that price coefficients are weighted by their average cost shares. Symmetry conditions are satisfied and imply that .
Considine and Mount (1984) recognized the incoherence of the static model assumption according to which demand adjusts instantaneously to long-run equilibrium levels. In fact, there are both price expectations and adjustment costs that require a gradual response by power producers to changes in relative input prices. For this reason, a dynamic aspect is introduced in this empirical model.
A system of equations for all inputs is estimated simultaneously. However, one cost share equation has to be dropped from the system to avoid a singular matrix. The other two equations are normalized by the respective coefficients and values from the dropped equation.5 Accounting for the constraints previously imposed, including a
5 Maximum likelihood estimates of a cost shares system are invariant to the selection of the base input
lagged consumption variable for each fossil fuel i to capture the dynamics and using
similar notation as in EIA (2012), we can write the system of cost-share equations as follows:
(5)
(6)
where Sc,t, So,t and Sg,t are the coal, oil and gas shares of total generation cost at time t.
Pc,t, Po,t and Pg,t are the fuel input prices for coal, oil and natural gas, respectively. Ec,t,
Eo,tand Eg,t refer to the amount of coal, oil and natural gas used for power generation
during period t, and Qt is total fossil-fueled electric power output. The coefficient λ
measures the speed of dynamic adjustment at each time period so that the desired fuel consumption is achieved.
For the computation of the elasticities of substitution we can use the estimated parameters obtained in equations (5) and (6) as shown by Considine and Mount (1984). The short-run cross-price elasticity between any two fuels i and j (i ≠ j) is thus given by:
(7)
and it is measured using the sample means of fuel cost shares for the entire time period for the other fuel j ( . In what concerns own-price elasticities, these can be computed
using the estimated coefficients as well:
The coefficients are obtained indirectly from the remaining coefficients using the homogeneity condition, as follows:
(9)
This implies that and can be derived in the following way:
(10)
(11)
(12)
It is also possible to derive the long-run price elasticities of input demand using the generator´s rate of adjustment λ(Steinbuks and Narayanan, 2013):
(13)
According to Eq.(13) the value of λ should lie between zero and one. If the parameter is close to zero then the adjustment process is done quickly, whereas a value close to one indicates a slow adjustment.
Fig.A3 (pg.3, Appendix) illustrates the evolution of the mean cost shares aggregated for the eight countries over 1990-2011, showing that natural gas is, on average, the most used fossil-fuel by the power generators.
3.2.2 Data description
Data for fossil-fuel prices – price of coal, gas and oil- used for electricity generation are the total price in US$ p/toe meaning that taxes and subsidies are also accounted for.6 This information was extracted from OECD/International Energy Agency (IEA) statistics (Energy Prices). As data were missing for some years for all,
data for the price charged for industrial consumers and data related to the CIF (cost, insurance and freight import) price of each fuel charged to each country were also collected from OECD/IEA statistics (Energy Prices) and OECD Factbook 2010: Economic, Environmental and Social Statistics- Energy production and prices,
respectively. More specifically, the idea was to fill-in the missing data assuming that fossil fuel prices followed the same variation as in the prices charged to the industry and, alternatively, when that information was missing too, that they had followed the trend registered by CIF import prices. Additionally, data concerning fossil fuel inputs (Ecoal, Eoil, Egas) in Million tonnes of oil equivalent (Mtoe) were extracted from
Söderholm et al. (2011) covering the time period 1990-2004. For the following years, IEA´s Electricity Information reports (2005, 2007, 2008, 2009, 2010, 2012, 2013)
provided the needed information.
Relatively to the fossil-fueled electric power (Q) in Terawatt (TWh) data was collected from Söderholm et al. (2011) for 1990-2002 and for the remaining years from IEA´s Electricity Information reports (2007, 2008, 2009, 2010, 2012, 2013).
Moreover, since the aim of this paper is also to analyze the impact of some policies undertaken in fossil-fuel switching, dummy variables were created to take into account the effect of liberalization and deregulation directives in the electricity sector
6
and the introduction of the Emissions Trading Scheme (ETS). Indeed, liberalization efforts started in the 1990s in the European Union with the goal of raising competition,
removing barriers to “prevent alternative suppliers from importing or producing
energy”7 and to allow consumers to choose among suppliers. As a result, Söderholm
(1999) showed that power plant owners, understanding the need to increase returns from their investments due to fierce competition, have searched ways to minimize the costs of their operations which commonly implied a decrease in fuel costs and hence might alter fuel-switching behaviour. Hence, the consequence was the promotion of Combined Cycle Gas Turbine (CCGT) plants. Therefore, the dummy variable, DLIB, will equal one
for the post-liberalization period verified in each country and zero for the preceding years. The EU ETS is a paramount tool to reduce industrial greenhouse emissions in a cost-effective way and constitutes one of the main EU pillars for the fight against climate change. “Within the cap, companies receive or buy emission allowances which they can trade with one another as needed”.8 Moreover, if a high carbon price is reached, could be assumed that countries will invest in cleaner technologies and energy sources with a low-carbon content associated. A possible result could be, for instance, that plant owners would be willing to substitute a larger amount of coal and oil for natural gas, which is a low-carbon alternative for the other fossil fuels in the electricity system. Brown et al. (2010) found that natural gas can help reach a low-carbon future, conditional on adequate low-carbon policies being simultaneously in place. For this reason, DETSequals to one for the period 2005-2011 and zero for 1990-2004.9
7
http://ec.europa.eu/competition/sectors/energy/overview_en.html
8
http://ec.europa.eu/clima/policies/ets/
9
3.2.3 Model estimation
In this sub-section a more detailed explanation of the model estimated is presented. In particular, the model allows for country-specific effects. Besides, some policy variables affecting fossil-fueled electric power are included, as well as a time trend that reflects non-neutral technical change or efficiency gains.
3.2.3.1 Fixed Effects
It seems reasonable to assume that often the variables that capture the time-invariant individual-specific effects are unobserved. What the fixed-effects (FE) model
does is hence to allow for heterogeneity among individuals by attributing to each of them its own intercept. Also, despite the fact that the intercept may be different across countries, it does not vary over time (time-invariant property). Hence, we follow the dummy variable approach proposed by Wooldbridge (2013) for FE estimation:10
(14)
Furthermore, as noted by Jones (1995), a deterministic time-trend t contributes
to a reduction in the number of concavity violations. For this reason, t is also added to
each share equation. The dummy variables accounting for liberalization/deregulation of the electricity sector and the ETS are also included in each equation.
For estimation purposes, the Iterative Full Information Maximum Likelihood (FIML) method was used to estimate the parameters of the system thus assuming that the disturbance vector is multivariate normally distributed with mean zero and a constant (non-singular) covariance matrix. Moreover, since the system of equations was
10 One dummy is dropped to avoid the problem of multicollinearity, implying that all other intercepts are
estimated simultaneously by the method of maximum likelihood, the results are unaffected by the choice of the share to be dropped. Hence, the final system of equations to be estimated simultaneously is given by:
(15)
(16)
where is assumed to comprise normally distributed normally random disturbances and , , , are the new variables added to (5) and (6). 11
3.2.4 Results
Before estimating the system of equations, we test the hypothesis that there is neutral technical change (i.e. βi,t = 0) to obtain a more adequate functional form. A
likelihood ratio test is conducted and the null hypothesis is not rejected so we assume a cost function with neutral technical change by imposing the restriction that βi,t = 0.12
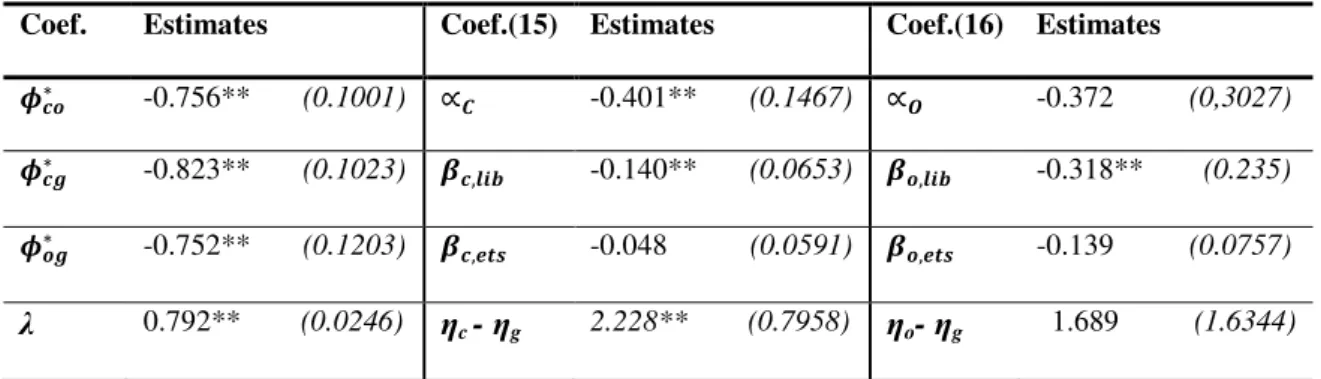
Tables 1 and 2 summarize the main parameter estimates and some statistical indicators.
11 Considine and Mount (1984) showed that the inclusion of noneconomic regressors does not affect the
manner in which symmetry and homogeneity are imposed or the property that shares to add to the unity.
12 Log-likelihood ratio=2*(LL
ur-LLr)=(304.83-304.80)=0.03 with 1 degree of freedom. Assuming a
significance level of 5%, the critical value is χ2=3.841 and hence H
Table 1. Parameter estimates
Coef. Estimates Coef.(15) Estimates Coef.(16) Estimates
-0.756** (0.1001) -0.401** (0.1467) -0.372 (0,3027)
-0.823** (0.1023) -0.140** (0.0653) -0.318** (0.235)
-0.752** (0.1203) -0.048 (0.0591) -0.139 (0.0757)
λ 0.792** (0.0246) ηc - ηg 2.228** (0.7958) ηo- ηg 1.689 (1.6344)
(** indicates statistical significance at 5% level; standard errors are in parenthesis)
Table 2. Summary statistics for the cost-share equations (15) and (16)
Summary Statistics
Equation (15) Equation (16)
Durbin-Watson 1.78 Durbin-Watson 2.06
Adjusted R2 0.97 Adjusted R2 0.95
Log-likelihood 304.799
In what concerns the overall fit of the model, Table 2 indicates a very good fit of the data with the Ajusted R2 taking the value of 0,97 for equation (15) and 0,95 for (16).13 Moreover, the Durbin-Watson statistics confirm the (almost) absence of autocorrelation in the residuals in both share equations.14
Table 1 shows that all the estimates of the price coefficients , and are statistically significant for this empirical specification. Also, as mentioned before, the adjustment parameter λ identifies how fast power generators respond to variations in fuel prices. Typically, the rates of adjustment (1-λ) vary from a fast rate in regions where many power plants are dual-fired (or even multi-fired) to a slow rate in those
13 The Adj. R2 reveals the proportion of variation in the dependent variable accounted by the regressors,
adjusting for the number of terms only when a new explanatory variable improves the model.
regions where switching between fuels tend to involve building new capacity. However, the mean rate of adjustment for the Western European region is 0.21, which might suggest two different conclusions. Either dual-fired capacity is still not sufficiently developed, or it has been expanding but long-run contracts still dominate in the region. Hence, they constitute an example of a contractual regulation that might undermine short-run fuel switching in favor of more flexibility in the long-run.15
In order to disentangle the previous results, we created two groups of countries among the eight Western European countries.16 The first is composed by those countries where base load generation is heavily influenced by nuclear and hydropower - Austria, Belgium and Spain-. The remaining five countries, namely, Germany, Italy, Ireland, the Netherlands and the United Kingdom are those where fossil-fuels still serve both base and peak load needs. In what concerns the rate of adjustment, the first group switches more rapidly between fossil-fuels (1-λ=0.37) than the second (1-λ=0.21). Eventually, this may be because the former group relies on fossil-fuel sources only at peak load periods, thus benefiting from more flexibility in the short-run due to the diversification from non-fossil fuel sources in base load generation.
Regarding the two policy variables –liberalization and ETS- only the first seems
to have a (negative) statistically significant impact on the coal-gas and oil-gas shares. This is consistent with Söderholm´s (1999) view that power producers facing increased competition from liberalization will use more natural gas for power generation. As a result, CCGT plants have been spreading in the region. The fact that we could not find statistical significance in the impact of the ETS can be explained by those two
15 Other examples of constraints to short-run fuel-switching include total available capacity, local
transmission and reliability constraints, and environmental regulations.
arguments. First, carbon pricing started effectively in 2004/2005 meaning that it might be too soon to capture its impact. Also, the steep rise in overall electricity production motivated by an increase in electricity demand has counteracted part of the fuel-switching from natural gas to coal as well as some of its potential environmental benefits. In particular, forced to raise electrical output to respond to more demand, even in the presence of the ETS, power generators in some countries had to use more coal (which is cheaper than natural gas but also more pollutant). In addition, carbon prices in the EU ETS market have been very low (close to zero) due to sluggish demand caused by the economic recession. Therefore, the internalization of the environmental costs from using coal under carbon pricing turned out to be relatively cheap, thus increasing competitiveness of this source relative to the other fossil fuels.
Table 3 provides a list of the estimated short-run and long-run own-and cross-price fuel elasticities aggregated for the Western European region, measured at the sample means.
Table 3. Estimated short-run and long-run own-and cross price elasticities
OWN-PRICE ELASTICITY
Fossil fuel Short-run Long-run
Coal -0.13 -0.59
Oil -0.20 -0.91
Natural Gas -0.1 -0.46
CROSS-PRICE ELASTICITY
Fossil fuels Short-run Long-run
Coal - Oil 0.04 0.18
Coal - Gas 0.09 0.41
Oil - Gas 0.13 0.57
Gas - Coal 0.06 0.27
Gas - Oil 0.04 0.18
Considering that negative own-price elasticities are necessary conditions for concavity, the results suggest that this requirement is fulfilled for both the short- and the long-term. Considine and Mount’s (1984) property that the sum of N price elasticities
should be zero for each input is verified for the three fuels. Additionally, we expect the signs of the cross-price elasticities to be non-negative (i.e. fuels to be substitutes in electricity generation), which is also obtained. The Le Chatelier principle is also
verified in this estimation as short-run cross-price elasticities are lower than long-run elasticities as flexibility typically increases in the long-run.
We find that among the three fossil fuels used for power generation, oil, the fuel with the lowest mean cost share (17%), is the most own-price responsive owing to its use primarily as a peaking fuel, followed by coal and (very closely) by natural gas.
markets, but also by the implementation of environmental regulations such as the Large
Combustion Plant Directive and EU regulations to adopt technologies to reduce CO2
emissions.
4. Conclusion
This paper focuses on two main dimensions of the electricity sector in the European Union, namely energy dependence and the degree of interfuel substitution in the Western region. Through the computation of the Shannon-Weiner Index, we found that member states have not sufficiently diversified the composition of their fuel-mix.
A linear logit model was built to analyze fuel-switching in the Western power sector. Oil was found to have the largest own-price elasticity, and the highest cross-price elasticity was observed between oil and gas mostly due to the existence of dual- or multi-fired power plants where producers can flexibly opt for the cheapest fossil fuel. Above all, countries that have an over-reliance on fossil-fuels for electricity generation face at least three main threats. The first is that they will struggle to comply with the ETS and the Directive 2009/28/EC, among others. Second, they are more vulnerable to
the volatility of fossil fuel prices exposing their economies also to energy shocks, thus raising concerns especially in a situation of economic stagnation/ recession in the EU countries. Finally, the high level of import dependence creates problems of energy security of supply.
References
Atkinson, Scott, Halvorsen, Robert. 1976. “Interfuel susbstitution in steam electric power generation”, Journal of Political Economy 84(5), 959-978
Barroso, José.2013.”Energy Priorities for Europe-Presentation to the European Council”
Berkson, Joseph. 1944.“Application of the Logistic function to Bio-assay”.Journal of
the American Statistical Association (9), 357-365
Bhattacharyya, Subhes. 2009. “Fossil-fuel dependence and vulnerability of electricity generation: Case of selected European countries”. Journal of Energy Policy (37)
2411-2420
Brown, Stephen, Gabriel, Steven, Egging, Ruud.2010. “Abundant Shale Gas Resources: Some Implications for Energy Policy”.Resources For the Future, Washington DC
BP Statistical Review of World Energy 2013, UK
Chambers, Robert. 1988. “Applied production analysis: a dual approach”. Cambridge University Press
Considine, Timothy, Mount, Timothy.1984. “The use of linear logit models for dynamic input demand systems”. The Review of Economics and Statistics 66 (3), 434-443
Considine, Timothy. 1989a.“Separability, Functional Form and Regulatory Policy in Models of Interfuel Substitution.”Energy Economics, 11 (2), 82-94
Costello, Ken. 2007. “Diversity of generation technologies: implications for decision-making and public policy”.Electricity Journal 20 (5), 10-21
Diewert, Walter. 1971.”An Application of the Shephard Duality Theorem: A Generalized Leontief Production Function”. Journal of Political Economy 79 (3),
481-507
European Commision, 2012.”Making the internal energy market work”, Brussels
IEA (annual). Electricity Information Annual Report. OECD, Paris
Jones, Clifton. 1995. “A dynamic analysis of interfuel substitution in US industrial demand”. Journal of Business and Economic Statistics 13 (4), 459-465
OECDiLibrary Database. “IEA energy prices and taxes- energy end-use prices”
Paterson, Nelson. 2012. “Elasticities of substitution in computable general equilibrium models”. Working Paper 2012‐02
Söderholm, Patrick. 1998b. “The modeling of fuel use in the power sector: a survey of econometric analyses”. Journal of Energy Literature 4 (2), 3-27.
Söderholm, Patrick. 1999. “Power generation in a deregulated market. Implications for fuel choice behaviour in Europe”. In: Jameson, R. (Ed.)
Söderholm, Patrick, Lundmark, Robert, Petterson, Fredrik. 2011. “Fuel switching and climate and energy policies in the European power generation sector: A generalized Leontief model”. Journal of Energy Economics 34 1064-1073
Steinbuks, Jevgenijs, Badri, Narayanan. 2013. “Fossil fuel producing economies have greater potential for Interfuel substitution”. GTAP Working Papers 4220
Tuthill, Lindsay. 2008. “Interfuel Substitution and Technical Change in the US Electricity Generating Industry Under the Tradable Sulphur Allowance Scheme: 1990–2004”.Oxford Institute for Energy Studies
U.S.Energy Information Administration (EIA), 2012. “Fuel Competition in Power Generation and Elasticities of Substitution”. Washington, D.C
Varian, Hal. 1992. “Microeconomic Analysis”. W. W. Norton & Company, Inc