A Work Project, presented as part of the requirements for the Award of a Masters Degree in Finance from the Faculdade de Economia da Universidade Nova de Lisboa.
PROXY STATEMENT PROPOSALS AFTER THE
2008 FINANCIAL CRASH
BERNARDO MANUEL SILVA MALTEZ SANTOS
Student number 370
A Project carried out with the supervision of
Professor Ana Marques
1 Abstract
In traumatic financial times, both shareholders and the media promptly blame companies for lack of decent corporate governance mechanisms. Proxy statement proposals have increasingly been used by the more active shareholders as to vindicate
managers to correct anomalies and restore financial markets’ confidence. I examine the
proposals of the largest companies in the S&P 500 index after the Lehmann Brothers crash and their effect on stock prices. Proposals initiated by shareholders negatively
impact the company’s stock price, particularly if the proposers are unions, pension funds and institutional investors. Also, I find corporate governance proposals to harm
firm’s market performance, unlike compensation and social policy proposals whose effects are intangible. The exception to these disappointing attempts to improve
2 Introduction
President Barack Obama signed the American Recovery and Reinvestment Act of 2009 (ARRA) on February 17, 2009. The economic stimulus package was a response to the recession triggered by the Lehmann Brothers bankruptcy a few months earlier, and contemplated corporate governance legislation, essentially say on pay resolutions. After this event did companies revise their directives in this sense? Proxy statements may mention the implementation of several reforms and it is important to identify not only what concerns investors have but also who submits proposals. In uneasy times, shareholders historically tend to cease the public mediatization on corporate governance flaws to propose incisive altercations via proxy statement (Byrne and Hawkins, 1993).
Academic researchers recurrently refer the dissemblance in profitability between shareholders and managers of corporations during depressed economic periods. The approval of ARRA imposed say on pay legislation, setting up a corporate framework with guidelines attempting to reduce the agency problem. The governmental efforts to empower the corporate governance system, and ultimately the improvement seeking on the overall corporate sphere should be taken to great consideration. It is important to evaluate how both parties respond to the executive compensation enticed policy and if financial markets grasp their initiatives. Bottom-line, is a brutal financial crash enough of a wakeup call to those partaking in the corporate governance role?
3 Furthermore, I investigate the effect of an approval recommendation by the Board of Directors for a proposal and analyze the interaction effect between active shareholders and type of proposal. The basic review addresses 1) the distinction between proposals submitted by the Board of Directors (BoD) and by shareholders, 2) shareholder proposals split into institutional, individuals and social groups and 3) proposals by their nature – compensation, corporate governance and social policy.
Jensen and Murphy (1989) show the little correlation between CEO compensation and the profitability of their firms pointing out the agency problem and how shareholders get systematically undermined, above all during meager financial times. In response, shareholders follow CalPERS blossom of activism (Crutchley et al., 1998), particularly institutional investors as their power translates into the best position to supervise managers (Agrawal and Mandelker, 1990; Schleifer and Vishny, 1986). The submission of proposals in the proxy statement is upheld by Bebchuk (2005) as a wholesome instrument for shareholders to impel their interests and the latest research point to an increase in the number of submitted proposals in the 2000s (Cotter and Thomas, 2007; Cremers and Romano, 2007). A dispute between shareholders and managers often rises from the submission of proposals by shareholders, seldom successful as their approval is fought using resources reducing firm value (Forjan, 1999) but also discouraging shareholders as a target company reveals lacklustre performance (Karpoff et al., 1996) and weak corporate governance framework (Gillan and Starks, 2007). From these prior findings emerges my first research question: Do financial markets distinguish proposals
from the companies’ Boards of Directors and those from shareholders?
4 2000) around the proxy statement and annual meeting dates, the exception being when a particular shareholder is studied: CalPERS notably influences positively its target companies (Nesbitt, 1994; Del Guercio and Hakwins, 1999 and English et al., 2004). Thus, my second research question is as follows: Is there a group of especially active and effective shareholders?
The media has mostly directed its interest towards the controversial subject of executive compensation and Murphy (1999) actually detects the boost in volume of research on this matter to exceed the steep growth in executive pay during the 1990s. Changes in compensation usually have a positive market reply (Brickley et al., 1985; Kumar and Sopariwala, 1992; Tehranian and Waegelein, 1985) foreseeing routine proposals on this topic, considering the 2008 dismal financial events. Therefore, in the final part of my study I investigate the proposal nature: Do compensation proposals overshadow the remainder and have a special effect on the firms’ stock performance?
5 evened proposal distribution between the former, corporate governance and social policy. On the sector analysis, Health Care companies mainly receive compensation proposals with 48%, opposite to Energy, Financials and Utilities with barely 20%.
For each of the three questions, where the CAR around the proxy statement and annual meeting dates is the dependent variable, there are two equations: the first contains dummy variables as key regressors whereas the second employs the actual number of proposals. In addition to the major variables, some controls for size, financial results and industry are integrated in all analyses. Moreover, some regressions using crossed variables scrutinize the proposal nature for each shareholder group.
Results show the number of proposals by shareholders negatively impacts the company
stock return, concurrent with Forjan’s (1999) argument of firm value reduction due to
6 This paper reassures some inferences suggested by the academic research, while exposing others. Shareholder proposals in general, and on corporate governance issues in particular have financial markets penalizing companies. If proposals by social, environmental and religious groups are expected to have a negative impact due to the affluence of such nature, institutional investors do not foresee such reaction, credit to CalPERS historically praised achievements on companies. Yet, the latter shareholders cause a decrease in stock return on their target companies while the former do not provoke any reaction. Widely controversial topic executive compensation and corporate unloved social policy end up being astoundingly overshadowed in significance by corporate governance as it severely harms companies’ stock prices. On the other hand, an upbeat discovery emerges as companies with proposals shared by several shareholders are rewarded by investors. When intersecting shareholders and type of proposal one can deduce the nature of a proposal eclipses its initiator as governance proposals, even by numerous shareholders, reduce firm value. Also, compensation
proposals from individual investors improve a company’s stock performance.
7 Literature Review
Whenever a financial crisis occurs, one of the frequently appointed causes is the lack of corporate governance mechanisms or their ineffectiveness; an idea supported by Mitton
(2002) who stresses corporate governance’s prominence during times of financial
distress. In fact, Boone et al. (2000) state that, in these periods, shareholders’ interests are more severely disregarded. The theoretical foundation of corporate governance is the agency theory. Jensen and Meckling (1976) created this notion, and it was later developed by Fama and Jensen (1983) and Eisenhardt (1989). The conflict between the shareholders of a firm and the respective managers is a typical example of the principal-agent problem – core of the agency theory – which occurs, for instance, when a study shows there is very little correlation between performance pay of CEOs and the success of the firms they manage (Jensen and Murphy, 1989).
When corporate governance does fail, shareholders may feel prone to use their influence in order to correct the anomaly. In the beginning of the 1990s, when several CEOs were dismissed by their boards, CalPERS led a shareholders intervention, in an attempt to
ensure shareholders’ wealth would not be affected (Crutchley et al., 1998). This remarkable event triggered a wave of shareholder activism, especially from the growing powerful institutional investors. Besides being in the best position to monitor the managers (Agrawal and Mandelker, 1990; Schleifer and Vishny, 1986), these investors
began to actively work on behalf of the shareholders’ interest. Black (1990) and Bethel
and Gillan (2002) point out the legal rules and conflicts of interest that dampen
shareholder activism, and Black (1998) later argues the shareholders’ lack of effort and
8 performance. Nevertheless, Bebchuk (2005) advocates the submission of proposals on
the company’s proxy statements as a valuable tool to exercise pressure on the managers.
The proposal submission on the proxy statement is, per se, elementary and inexpensive but gathering enough support to approve it at the annual meeting is much more complex and if the proposal is in conflict with the management, valuable time and resources are spent to counter it, reducing firm value (Forjan, 1999). Furthermore, investors primarily focus on poorly performing companies (Karpoff et al, 1996), or on corporations with a fragile governance structure (Gillan and Starks, 2007), and despite being less powerful, most proposals are submitted by small investors (Forjan, 1999). Substantial amounts of academic studies on shareholder activism through the proxy process have been published however there is no consensus on its effect on firm value. Regardless of this problem, recent studies (Cotter and Thomas, 2007; Cremers and Romano, 2007) report a rise in the number of submitted proposals in the 2000s.
Gordon and Pound (1993), Karpoff et al (1996) and Campbell et al (1999) find the overwhelming majority of shareholder-sponsored proposals fail to get approval. Yet, Gillan and Starks (2000) later discover an increase in shareholder support. The discouraging approval rates may be related to dialogs between shareholders and the management resulting in agreement, therefore avoiding the proposal submission via proxy statement (Chi and Posner, 2010), or a compromise after the submission of such a proposal, leading to its withdrawal (Chidambaran and Woidtke, 1999). Alternatively,
bolder explanations such as the institutional investors’ business relations with the
9 On the other hand, Gordon and Pound (1993) find that proposals originated by managers easily attract shareholder support. This is also partially explained by the relations between the firm and institutional investors but also a vote of confidence on
the management’s credibility (Raghunandan, 2003).
The key question now is whether financial markets react to these proposals. However, the fact that multiple proposals are submitted (possibly with different outcomes), and the information leakage factor are, according to Gillan and Starks (2000), the main reason why it is difficult to assess stock price reactions. Necessarily, one should ask:
I. Do financial markets distinguish proposals from the companies’ Boards of Directors and those from shareholders?
10 English et al., 2004), but other investors are also considered influential (Holderness and Sheehan, 1985). From these findings, the next question emerges:
II. Is there a group of especially active and effective shareholders?
Within the multiple proposals submitted by active shareholders, executive compensation is one rampant affair. Although it is usually a popular topic of discussion it deserves special attention in times of financial crises, as many executives are generously rewarded while their companies struggle. The controversy on whether
performance plans improve the firm’s stock performance has been fuelled, and often created, by public interest on executive pay levels (Byrne and Hawkins, 1993).
As Reingold (1997) comments: “The staggering rise in pay for the good, the bad, and
the indifferent has left even some advocates of pay for performance wondering whether
the balance between the CEO and the shareholder is tilting the wrong way.” The
question comes down to whether current remuneration practices minimize the agency costs or actually enhance them. Henderson (2006) dwells on the subject and twigged that massive amounts of research papers provided theoretical and empirical evidence supporting both sides of the discussion, although a consensus was yet to be met. Murphy (1999) finds the accentuated growth in executive pay during the 1990s had actually been surpassed by the increase in volume of academic articles on that topic.
11 performance-based. Blinder (2009) notices a consequence of an increased variability is it encourages the managers to incur on more risk than the shareholders would like to.
Larcker (1983) is the first study on the association of executives’ compensation and the
respective company’s stock performance. Results indicate a positive market return after
a long-term executive compensation plan was adopted, results that were later upheld by Brickley et al. (1985) and Kumar and Sopariwala (1992) and even by Tehranian and Waegelein (1985) who opted for a short-term performance plan market analysis. Battistel et al. (1992) however, do not find a significant increase on shareholder wealth as a consequence of adopting performance plans, after Healy (1985) had argued the counter productiveness of basing compensation on accounting measures as it would
only motivate managers to increase their own wealth and not the firm’s. Considering the spotlight on this topic, I inquire:
III. Do compensation proposals overshadow the remainder and have a special
effect on the firms’ stock performance?
Sample
My sample is based on “Executive Compensation, Trends for 2009”, a study by James
12 and cannot find any proposal (excluding the auditor approval routine by the BoD). This leads to a final sample of 140 firms. Financial data is retrieved from Compustat, market data obtained from CRSP and analysts’ consensus forecasts collected from Bloomberg.
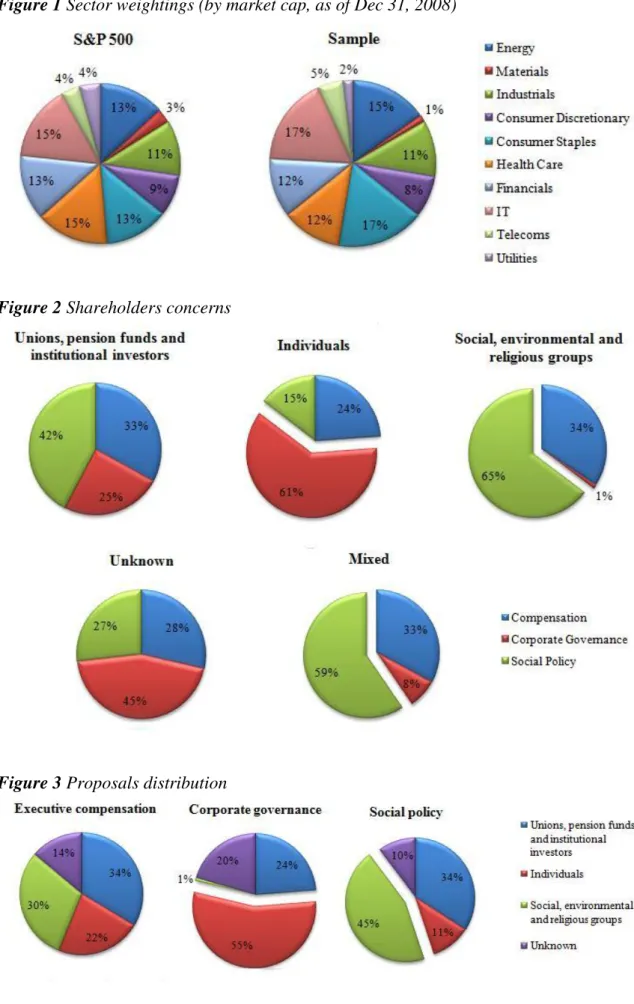
In order to assess whether our sample provides a good representation of the S&P 500 index, I compare the index sector weightings in December 31, 2008 with the sample sector weights by market capitalization, according to GICS. Bhojraj et al. (2003) select this classification system offered more homogeneity and lower variances in returns when compared to SIC and NAICS, while Boni and Womack (2004) state it is the system stock analysts feel describes best the areas of expertise. As shown in Figure 1, this sample is a fair proxy of the index which confers credibility to a possible extrapolation.
13 not aimed by shareholders. Finally, Table 1 shows that 58 firms have both types of proposals.
In the subsample which includes 110 companies (shareholders proposals), I identify 306 proposals, formulated by 385 shareholders. These shareholders are sorted into 3 groups, according to the Securities and Exchange Commission: (i) unions, pension funds, institutional investors and institutional investor associations, (ii) individual investors and (iii) social, environmental and religious funds and related service providers1. Some companies, tough, have restrictive guidelines regarding the disclosure of the proposer’s information. Thus, in some situations it is impossible to identify the shareholders who submit a proposal suitably classified as unknown. Other proposals are initiated by more than one shareholder – these are filed as mixed.
Several shareholders are recurrently active, across various companies, initiating numerous proposals. The NYC retirement and pension funds, for instance, are responsible for 24 proposals, while AFSCME and the AFL-CIO account for 11 and 20, respectively, as the most active institutional investors2. Certain individual investors as William Steiner, Evelyn Davis, John Chevedden or the Rossi family are legendary active shareholders, as this sample attests, contributing with more than 10 proposals each. Social groups have a more disperse concentration, although the Nathan Cummings Foundation or the Congregation of Sisters of St. Agnes are some examples of the more active shareholders. Overall, Table 2 shows there is a pretty leveled shareholder distribution, and that 15% cannot be identified.
1
http://www.sec.gov/news/studies/proxycomsum.pdf
2
14 Next, I analyze the proposals both quantitatively and qualitatively. In the subsample of 93 firms with management-sponsored proposals, only 3 of them have Boards submitting 2 proposals, totaling 96 proposals while the other subsample includes 306 proposals. Finally, I categorize the proposals into three distinct groups: (i) executive compensation, (ii) corporate governance and (iii) social policy. This categorization is based on the
Manhattan Institute’s Center for Legal Policy 3 . The sample’s most common
compensation proposals are essentially say on pay, death benefits or stock options-related. Corporate governance’s most frequent topic include election of directors, cumulative voting, special meeting and independent chairman, while on social policy the main matters relate to human rights, health care, political contributions or environmental issues. Table 3 shows the proposals distribution into these three categories, as well as their lifecycle (Board’s recommendation to approve or reject them at the Annual Meeting and voting outcome at the same event).
The distribution of proposals shows the Board and shareholders contribute similarly with 95 and 90 compensation proposals each, respectively, but while this accounts for almost the total of Board proposals – only 1 regards corporate governance – its representation on the overall shareholder proposals is the lowest with 29%, opposed to 38% of corporate governance and 33% in social policy (Table 3). Furthermore, a woeful 1% of compensation and corporate governance proposals from shareholders garner the
Board’s support, only marginally better than social policy with none. Meanwhile the Board obviously recommends shareholders to approve their own proposals, and this mechanism appears to produce a strong effect as the outcome is systematic: all Board
3
15 proposals were endorsed by the majority of stockholders. Nonetheless, the recommendation is not necessary to validation as compensation and corporate governance proposals get respectable approval rates of 18% and 28%; social policy, though, get an alarming minimal approval rate as no green lights emerge (Table 3).
Figure 2 presents the descriptives on the proposals, using the two dimensions analyzed: class of proposal and type of entity which originated it. Although both individuals and social groups favor one evident subject (weighting over 60%) for corporate governance and social policy, respectively, institutional investors cover all concerns with a more balanced approach. Proposals of indefinite origin tend to be corporate governance related while mixed proposals clearly loom over social policy issues.
Figure 3 depicts the weight of each type of shareholder for each sort of proposal. Again, this outline corroborates the impact of individual investors on corporate governance proposals along with the mixed and social groups’ interest in social policy matters.
16 soar above the rest with over 1 proposal per active company on Figure 6, with the latter sector also outranking the remaining in terms of social policy proposals ratio.
Methodology
Based on the research questions, I estimate three equations using multiple linear regressions. Each, however, can be divided in two: the first includes an indicator variable to account for whether there are proposals in that category or not, while the second includes the actual number of proposals submitted within that category. In order to study my first research question, I estimate the following equations:
0 1 _ 2 _ 3 i i
i
CAR dv BoD dv Sh recom
control (1)
0 1 _ 2 _ 3 i i
i
CAR n BoD n Sh recom
control (2)
These equations analyze how investors perceive the attempts to change the company via proxy statement proposals, either by the Board of Directors or shareholders. Ultimately, if there is a considerable abnormal return associated with any of the intervenients, that effect will be detected in the significance of the variable.
First there is the dependent variableCAR, cumulative abnormal return. Recall there will be two relevant dates, the proxy statement publication date and the annual meeting date which originates two variables accordingly. These returns are calculated for the short window [-1, 1], centered on the respective dates. The adjustment for market returns is done using CRSP’s Value Weighted market index, including dividends. Also, variable
17 _
dv BoD(dv Sh_ ) represent indicator variables coded 1 when the company receives proposals by its BoD (shareholders) and 0 otherwise; while _n BoD( _n Sh) embodies
the number of proposals submitted by company’s BoD (shareholders).
Schwert (1983) points out the size effect on stock returns which for a regression can be controlled with the addition of a firm size variable. In terms of financial results, Hayn (1995) states the impact of a loss report on share valuation while Skinner and Sloan (2002) stress how stock prices sometimes overreact to earnings surprises, both controllable with the appropriate variables later specified. Sosizefeatures the total assets of the firm, dv NI_ yields 1 if the company’s net income is positive and 0
otherwise; andepss stands for the difference between the actual EPS and the expected EPS according to the Bloomberg analysts’ consensus (all figures report to the quarter previous to the events’ dates). Finally,energy,materials,industrials,cons discret_ ,
_
cons staples , health care_ , financials , it and telecoms are sector classifiers (all
sectors present excluding utilities).
In order to study my second research question, I estimate the following equations:
0 1 _ 2 _ 3 _ 4 _ 5 _
CAR dv Union dv Indiv dv Soc dv Unk dv Mix
6 i i
i
recom control
(3)
0 1 _ 2 _ 3 _ 4 _ 5 _
CAR n Union n Indiv n Soc n Unk n Mix
6 i i
i
recom control
18 These equations allow me to explore the shareholder proposals, according to its origin, to assess whether there is a group of shareholders whose proposals influence financial markets. The dependent and control variables on equation 3 are computed as described above whiledv Union_ , dv Indiv_ and dv Soc_ correspond to the three basic categories of shareholders – coded 1 when the company receives a proposal from the matching shareholder group (and 0 otherwise) – joined by dv Unk_ and dv Mix_ as proposals from unknown shareholders and those originated by more than one in that order. Similarly, equation 4 includes the number of proposals from the same groupings previously mentioned.
In order to study my last research question, I estimate the following equations:
0 1 _ 2 _ 3 _ 6
CAR dv PrCom dv PrCG dv PrSoc recom
i i
i
control
(5)
0 1 _ 2 _ 3 _ 6
CAR n PrCom n PrCG n PrSoc recom
i i
i
control
(6)
19 Results
Table 4 shows the descriptive statistics of the key and control variables, respectively, all to be used in the regression analyses. Firstly, an obvious comparison between the CARs in both dates of interest shows around the proxy statement date appears to be a positive reaction as both average and median edge above zero, contrary to the meeting date as these statistical indicators yield negative values. Companies with at least one proposal recommended to approve by the BoD represent 67.1% of the total sample; those with BoD proposals, though, already account for 65.7%. The average of number of proposals by shareholders and the BoD show companies receive an average of nearly 2.2 shareholders proposals opposite to less than 0.7 Board proposals. In terms of shareholders, both institutional and individual groups target 43.6% of firms, while social groups yield 30.7%. Lastly, the majority of companies do not receive a single social policy proposal being out sailed by compensation and corporate governance.
The initial research question pondered on whether financial markets made a distinction
20 (1996) offer an alternative interpretation as shareholders first and foremost target poorly performing companies which may depict an off-putting allusion to investors.
Board-initiated proposals do not have an effect on stock price, consistent with the investors’
self-belief on the Board’s reliability view by Raghunandan (2003). Equation 1 presents an R2 of 6.6% which means the regressors explain this amount of the CAR behaviour in the selected time period while equation 2 yields a slightly higher value of 8.11%.
Secondly, the shareholders effect was analyzed separately, by their type (Table 6). The institutional investors group is characterized as the most powerful, influential and in the best position to supervise the management, yet a single proposal submitted by one of
these shareholders propels a negative reaction on the company’s stock price. When
there is a large number of proposals, institutional investors are claimed the sole causers of a stock price decline. English et al. (2004) point out CalPERS’ activism as an example of influence effectiveness that translates into stock appreciation, and Holderness and Sheehan (1985) assert other investors possess similar influence. In light of these facts, an association between institutional investors and favourable market response could be suggested but results dash any hasty conjecture. In contrast, proposals shared by investors (mixed) achieve a remarkable role as investors seemingly reward the cooperative effort. One can deduce proposals have a positive effect on firm value if support from other shareholders is gathered to create them. Equation 3 registers an R2 of 11.57% while equation 4 attains 12.91%. Although this implies a better explanation of the regressand than the previous regressions there are more regressors included.
According to results of regressions 5 and 6, as found in Table 7, corporate governance
21 corporations with fragile governance structures, possibly alerting investors that then punish these companies. Bearing in mind that shareholders propose almost every corporate governance proposal and these have the highest approval rate at the annual meeting (and suspecting this to be fashion on previous years), one may assume the BoD considers this type of proposal as the most menacing. In this situation, markets may anticipate the Board’s resources consumption in an attempt to offset governance proposals and, if approved, firm value reduction to implement them. Disparately, the widely topic of executive compensation is rather overlooked due to its insignificance as regressors. Recalling the majority of compensation proposals derive from the BoDs it seems quite disappointing investors do not value the initiative of improving the compensation design. In fact, the managers’ effort to avoid a recurrence of the modest correlation between performance pay and success of the firms shown by Jensen and Murphy (1989) would, to some extent, attenuate the agency problem after an extremely severe financial crisis. Also, although the idea that social policy proposals provoke a negative reaction on investors due to its profit-harming nature, this does not materialize. Referring to their terrible approval rate, this outcome is perhaps not that shocking. Lastly, models 5 and 6 explain 11.07% and 12.32%, respectively, of the CAR.
The intention to interpret these same equations referring to the annual meeting date was shattered as no key variables turn out to be significant. Most information is likely to be
already incorporated on stock prices, particularly because of the Board’s
recommendations to vote on proposals as a consistent prediction to the eventual voting outcome.
22 instance,dv Mix dv PrCom_ * _ ,dv Mix dv PrCG_ * _ ,dv Mix dv PrSoc_ * _ ). In these untabulated results corporate governance proposals yield negative coefficients associated with institutional, individual and mixed groups while compensation proposals submitted by individuals positively affect a company’s stock price.
Conclusion
This paper offers a new understanding of the proxy statement proposals’ effect on the
companies’ stock prices. The typically powerful institutional investors launched and established shareholder activism and, according to their precedents, have initiatives with beneficial end results. In this case, however, they are the only damaging shareholder crowd as a whole. In contrast, proposals jointly submitted by numerous shareholders manifestly cause a positive reaction on financial markets. Regarding compensation and social policy proposals, these are unnoticed by investors while corporate governance topics visibly taint firm value. The nature of proposals overshadows its initiator but compensation proposals by individuals improve the company’s stock performance.
23 References
ABOWD, J. M. And KAPLAN, D. S., 1999. Executive Compensation: Six Questions That Need Answering. The Journal of Economic Perspectives, 13 (4), pp. 145-168. AGRAWAL, A. And MENDELKER, G., 1990. Large shareholders and the monitoring of managers. Journal of Financial and Quantitative Analysis, 23 pp. 143-161.
BATTISTEL, G. P., GAVER, J. J. and GAVER, K. M., 1992. The stock market reaction to performance plan adoptions. The Accounting Review January, pp. 172-182. BEBCHUK, L., 2005. The case for increasing shareholder power. Harvard Law Review, 118 pp. 835-914.
BETHEL, J. E. And GILLAN, S. L., 2002. The impact of the institutional and regulatory environment on shareholder voting. Financial Management, 31 (4) pp. 29-54. BHAGAT, S., BRICKLEY, J. A. And LEASE, R. C., 1985. The impact of long-range managerial compensation plans on shareholder wealth. Journal of Accounting and Economics 7(1-3), pp 115-129.
BHOJRAJ, S., LEE, C. M. C. And OLER, D., 2003. What’s my line? A comparison of Industry Classification Schemes for Capital Market Research. Journal of Accounting Research 41(5), pp. 745-774.
BLACK, B. S., 1990. Shareholder passivity re-examined. Michigan Law Review, 89 pp. 520-608.
BLACK, B. S., 1998. Shareholder activism and corporate governance in the United States. The New Palgrave Dictionary of Economics and the Law, 3 pp. 459-465.
BLINDER, A., 2009. Crazy compensation and the crisis. Wall Street Journal 5/28, pp A15.
BONI, L. and WOMACK, K. L., 2004. Industries, Analysts and Price Momentum. Tuck School of Business Working Paper No. 03-12. Dartmouth College.
BOONE, P., BREACH, A., FRIEDMAN, E. And JOHNSON, S., 2000. Corporate governance in the Asian financial crisis. Journal of Financial Economics, 58 pp. 141-186.
BRICKLEY, J., LEASE, R. and SMITH, C., 1988. Ownership structure and voting on antitakeover amendments. Journal of Financial Economics, 20 pp. 267-292.
BYRNE, J. A. And HAWKINS, C., 1993. Executive Pay: The Party Ain’t Over Yet. Business Week April 26 1993, pp 56-68.
CAMPBELL, C. J., GILLAN, S. L. and NIDEN, C. M., 1999. Curremt perspectives on shareholder proposals: lessons from the 1997 proxy season. Financial Management, 28 (1), pp. 89-98.
CHI, C. And POSNER, R., 2010. Shareholder proposals, http://www.bassberry.com/files/upload/ProposalAnalysis_112910.pdf.
24 COTTER, J. F. And THOMAS, R. S., 2007. Shareholder proposals in the new millennium: shareholder support, board response and market reaction. Journal of Corporate Finance, 13 pp. 368-391.
CREMERS, M. And ROMANO, R., 2007. Institutional investors and proxy voting: the impact of the 2003 mutual fund voting disclosure regulation. ECGI Law Working Paper 83/2007.
CRUTCHLEY, C. E., HUDSON, C. D. And JENSEN, M. R. H., 1998. Shareholder
Wealth Effects of CalPERS’ Activism. Financial Services Review, 7 (1) pp. 1-10. DEL GUERCIO, D. And HAWKINS, J., 1999. The motivation and impact of pension fund activism. Journal of Financial Economics, 52 pp. 293-340.
EISENHARDT, K. M, 1989. Agency Theory: An Assessment and Review. Academy of Management Review. 14 (1), pp. 57-74.
ENGLISH, P. C., MCNEIL, C. R. and SMYTHE, T., 2004. The “CalPERS effect” revisited. Journal of Corporate Finance, 10 (1) pp. 157-174.
FAMA, E. F. And JENSEN, M. C., 1983. Agency problems and residual claims. Journal of Law and Economics, 26 (2), pp. 327-349.
FAMA, E. F. And JENSEN, M. C., 1983. Separation of Ownership and Control. Journal of Law and Economics, 26 (2), pp. 301-325.
FERNANDES, N., FERREIRA, M. A., MATOS, P. and MURPHY, K. J., 2010. The pay divide: (Why are US top executives paid more? Finance working paper nº 255/2009.
FORJAN, J. M., 1999. The wealth effects of shareholder –sponsored proposals. Review of Financial Economics, 8 (1) pp. 61-72.
GILLAN, S. L. and STARKS, L. T., 2007. The Evolution of Shareholder Activism in the United States. Journal of Applied Corporate Finance, 19 (1) pp. 55-73.
GILLAN, S. L. and STARKS, L. T., 2000. Corporate governance proposals and shareholder activism: the role of institutional investors. Journal of Financial Economics, 57 pp. 275-305.
GORDON, L. A. And POUND, J., 1993. Information, ownership structure and shareholder voting: evidence from shareholder-sponsored corporate governance proposals. The Journal of Finance, 48 (2) pp. 697-718.
HAYN, C., 1995. The information content of losses. Journal of Accounting & Economics, pp.125-153.
HEALY, P. M., 1985. The effect of bonus schemes on accounting decision. Journal of Accounting and Economics 7 April, pp. 85-107.
HENDERSON, M., 2006. Paying CEOs in Bankruptcy: Executive Compensation When Agency Costs Are Low, John M. Olin Law & Economics Working Paper No. 306 (2D series).
25 JENSEN, M. C. And MURPHY, K. J., 1989. Performance Pay and Top-Management Incentives. Journal of Political Economy, pp. 225-265.
KARPOFF, J. M., MALATESTA, P. H. And WALKLING, R. A., 1996. Corporate governance and shareholder initiatives: Empirical evidence. Journal of Financial Economics, 42 pp. 365-395.
KUMAR, R. and SOPARIWALA, P., 1992. The effect of adoption of long-term performance plans on stock prices and accounting numbers. Journal of Financial and Quantitative Analysis 27(4), pp. 561-573.
LARCKER, D., 1983. The association between performance plan adoption and corporate capital investment. Journal of Accounting and Economics 5(1), pp 3-30. MITTON, T., 2002. A cross-firm analysis of the impact of corporate governance on the East Asian financial crisis. Journal of Financial Economics, 64 pp. 215-241.
MURPHY, K., 1999. Executive compensation. Handbook of Labor Economics 3(2). NESBITT, S., 1994. Long term rewards from shareholder activism. Journal of Applied Corporate Finance, 6 (4) pp. 75-80.
POUND, J., 1988. Proxy contests and the efficiency of shareholder oversight. Journal of Financial Economics, 20 pp. 237-265.
PREVOST, A. K. And RAO, R. P., 2000. Of what value are shareholder proposals sponsored by public pension funds? Journal of Business, 73 pp. 177-204.
PREVOST, A. K., RAO, R. P. And WILLIAMS, M. A., 2009. Labor unions as shareholder activists: champions or detractors? Working paper, Ohio University.
RAGHUNANDAN, K., 2003. Nonaudit services and shareholder ratification of auditors. Auditing: A Journal of Practice & Theory, 22 (1) pp. 155-163.
REINGOLD, J., 1997. Executive Pay. Business Week April 21 1997, pp. 62.
ROMANO, R., 2001. Less is more: making institutional investor activism a valuable mechanism of corporate governance. Yale Journal on Regulation, 18 pp. 174-251. SCHLEIFER, A. And VISHNY, R., 1986. Large shareholders and corporate control. Journal of Political Economy, 94 pp. 461-488.
SCHWERT, G. W., 1983. Size and Stock Returns, and other empirical regularities. Journal of Financial Economics 12, pp. 3-12.
SKINNER, D. J. and SLOAN, R. G., 2002. Earnings Surprises, Growth Expectations
and Stock Returns or Don’t Let an Earnings Torpedo Sink Your Portfolio. Review of Accounting Studies 7, pp.289-312.
TEHRANIAN, H. And WAEGELEIN, J. F., 1985. Market reaction to short-term executive compensation plan adoption. Journal of Accounting and Economics 7, pp. 131-144.
26 Figure 1 Sector weightings (by market cap, as of Dec 31, 2008)
Figure 2 Shareholders concerns
28 Table 1 Companies breakdown
Sample Board of Directors Shareholders
Energy 13 8 62% 11 85%
Materials 6 3 50% 6 100%
Industrials 25 12 48% 20 80%
Consumer Discretionary 22 17 77% 16 73%
Consumer Staples 22 12 55% 18 82%
Health Care 13 9 69% 9 69%
Financials 18 14 78% 13 72%
IT 11 10 91% 8 73%
Telecoms 4 4 100% 4 100%
Utilities 6 4 67% 5 83%
Total 140 93 66% 110 79%
Table 2 Proposals by type of shareholder
Shareholders
Unions, pension funds and institutional investors 118 31%
Individual investors 109 28%
Social, environmental and religious groups 102 26%
Unknown 56 15%
Total 385
Table 3 Proposals lifecycle
Overall proposals
Total Recommended Approved
Compensation 185 96 52% 111 60%
Corporate governance 117 2 2% 34 29%
Social policy 100 0 0% 0 0%
Total 402 98 145
Board proposals
Total Recommended Approved
Compensation 95 95 100% 95 100%
Corporate governance 1 1 100% 1 100%
Social policy 0 0 - 0 -
Total 96 96 96
Shareholder proposals
Total Recommended Approved
Compensation 90 1 1% 16 18%
Corporate governance 116 1 1% 33 28%
Social policy 100 0 0% 0 0%
29 Table 4 Descriptive statistics of key and control variables
Average St. Deviation Median Minimum Maximum
CAR (proxy) 0.009 0.004 0.003 -0.134 0.305
CAR (meeting) -0.005 0.004 -0.005 -0.180 0.234
recom 0.671 0.040 1 0 1
dv_BoD 0.664 0.040 1 0 1
dv_Sh 0.786 0.035 1 0 1
n_BoD 0.686 0.043 1 0 2
n_Sh 2.186 0.171 2 0 11
dv_Union 0.436 0.042 0 0 1
dv_Indiv 0.436 0.042 0 0 1
dv_Soc 0.307 0.039 0 0 1
dv_Unk 0.129 0.028 0 0 1
dv_Mix 0.193 0.033 0 0 1
n_Union 0.850 0.110 0 0 6
n_Indiv 0.779 0.099 0 0 6
n_Soc 0.714 0.135 0 0 9
n_Unk 0.400 0.106 0 0 7
n_Mix 0.557 0.130 0 0 10
dv_PrCom 0.893 0.026 1 0 1
dv_PrCG 0.514 0.042 1 0 1
dv_PrSoc 0.436 0.042 0 0 1
n_PrCom 1.321 0.067 1 0 3
n_PrCG 0.836 0.085 1 0 4
n_PrSoc 0.714 0.090 0 0 6
size 19.735 0.102 19.547 17.572 23.803
dv_NI 0.786 0.035 1 0 1
epss -0.002 0.002 0.001 -0.216 0.177
energy 0.093 0.025 0 0 1
materials 0.043 0.017 0 0 1
industrials 0.179 0.032 0 0 1
cons. disc. 0.157 0.031 0 0 1
cons. stap. 0.157 0.031 0 0 1
health care 0.093 0.025 0 0 1
financials 0.129 0.028 0 0 1
it 0.079 0.023 0 0 1
30 Table 5 Analysis of first research question
Equation 1 Equation 2
Coefficient P-value Coefficient P-value
dv_BoD 0.023 0.66 - -
dv_Sh -0.010 0.41 - -
n_BoD - - -0.008 0.76
n_Sh - - -0.005 0.09
β0 0.058 0.58 -0.018 0.88
recom -0.024 0.65 0.004 0.88
size -0.002 0.74 0.002 0.72
dv_NI 0.010 0.41 0.011 0.38
epss 0.206 0.45 0.285 0.30
energy -0.015 0.56 -0.010 0.71
materials -0.016 0.60 -0.015 0.61
industrials -0.010 0.67 -0.006 0.80
cons_ disc -0.004 0.88 0.001 0.97
cons_stap -0.017 0.48 -0.014 0.57
health_care -0.042 0.10 -0.040 0.11
financials -0.024 0.38 -0.027 0.32
it -0.019 0.48 -0.015 0.56
telecoms 0.002 0.95 0.011 0.74
31 Table 6 Analysis of second research question
Equation 3 Equation 4
Coefficient P-value Coefficient P-value
dv_Union -0.023 0.03 - -
dv_Indiv 0.008 0.46 - -
dv_Soc -0.015 0.17 - -
dv_Unk -0.025 0.12 - -
dv_Mix 0.012 0.39 - -
n_Union - - -0.012 0.01
n_Indiv - - 0.002 0.70
n_Soc - - -0.007 0.13
n_Unk - - -0.005 0.28
n_Mix - - 0.013 0.02
β0 0.007 0.95 -0.020 0.86
recom 0.000 0.99 -0.001 0.95
size 0.001 0.88 0.002 0.71
dv_NI 0.010 0.40 0.009 0.47
epss 0.101 0.72 0.059 0.84
energy -0.014 0.60 -0.008 0.77
materials -0.009 0.77 -0.012 0.69
industrials -0.002 0.94 -0.007 0.77
cons_ disc 0.005 0.84 0.001 0.96
cons_stap -0.010 0.66 -0.013 0.58
health_care -0.034 0.19 -0.036 0.16
financials -0.028 0.31 -0.029 0.28
it -0.018 0.50 -0.014 0.59
telecoms -0.001 0.98 0.001 0.99
32 Table 7 Analysis of third research question
Equation 5 Equation 6
Coefficient P-value Coefficient P-value
dv_PrCom 0.013 0.47 - -
dv_PrCG -0.023 0.02 - -
dv_PrSoc 0.000 0.98 - -
n_PrCom - - -0.004 0.61
n_PrCG - - -0.016 0.00
n_PrSoc - - 0.001 0.83
β0 0.060 0.56 -0.028 0.81
recom -0.009 0.46 -0.004 0.70
size -0.002 0.74 0.003 0.58
dv_NI 0.009 0.43 0.008 0.48
epss 0.229 0.39 0.439 0.11
energy -0.015 0.55 -0.017 0.51
materials -0.018 0.55 -0.020 0.49
industrials -0.015 0.52 -0.012 0.62
cons_ disc -0.005 0.83 -0.004 0.87
cons_stap -0.022 0.36 -0.022 0.36
health_care -0.047 0.07 -0.043 0.09
financials -0.020 0.44 -0.031 0.25
it -0.025 0.34 -0.026 0.32
telecoms 0.011 0.75 0.018 0.60