THIS REPORT WAS PREPARED BY MARCO LOURENÇO, A MASTERS IN FINANCE STUDENT OF THE NOVA SCHOOL OF BUSINESS AND ECONOMICS, EXCLUSIVELY FOR ACADEMIC PURPOSES.THIS REPORT WAS SUPERVISED BY ROSÁRIO ANDRÉ WHO REVIEWED THE
M
ASTERS IN
F
INANCE
E
QUITY
R
ESEARCH
With the international financial crisis and the real estate bubble burst, the Spanish banking sector, which largely increased its exposure to the real estate area through loans prior to it, saw a quick accumulation of foreclosed assets and profits quickly fell.
On 2012, with the release of a stress test and associated asset quality review, Spanish banks were forced to recognise further losses associated to real estate and this showed how undercapitalized banks were. This, associated to new and stricter regulation, would lead to a restructuring of the sector.
There has been an overall decrease of the cost of funds, driven by strong incentives through the lowering of the main reference interest rates by the central banks to promote economic growth. Deposits still remain the preferred source of funds.
Banks have drastically slowed down the amount of loans provided, and the sector started assisting to a decrease in their
ROE largely inherent to a degradation of banks’ loans portfolio. To
atone, banks are taking more risk to attain higher returns.
Under this context, and with the expectation that the Spanish economy will slowly start to recover, the recommendation is to sell. It is unclear and uncertain what are the full effects of
Basel III and the financial crisis on banks’ activity, and how it will
evolve from now on.
Company description
Banco Popular Español SA’s activities are segmented into
Commercial Banking (core activity), Asset and Insurance Management, Real Estate, and Institutional and Market. The bank has regional subsidiaries in Spain, Portugal, and Florida, focusing most of its activity in Spain though (over 90% of its gross operating income in the end of 2013).
B
ANCO
P
OPULAR
C
OMPANY
R
EPORT
B
ANKING SECTOR
07
J
ANUARY2015
S
TUDENT
:
M
ARCO
A
NTÓNIO
D
UARTE
L
OURENÇO
[email protected]
Too high hopes for the future?
Uncertainty towards the Spanish banking system
Recommendation: SELL
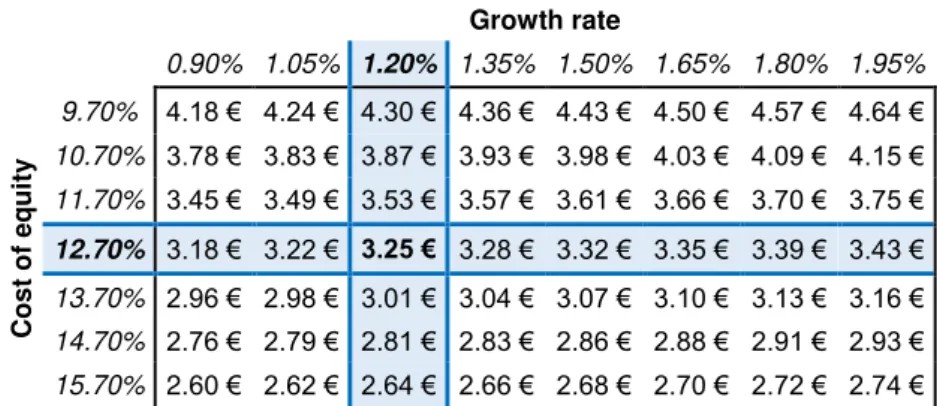
Price Target FY15: 3.25 €
Price (as of 6-Jan-15) 4.09 €
Reuters: POP.MC, Bloomberg: POP:MC
52-week range (€) 3.94-5.94
Market Cap (€m) 8,609
Outstanding Shares (m) 2,101
Source: Bloomberg
0 20 40 60 80 100 120 140
Banco Popular vs. IBEX 35 (Index - Base 2nd Jan 2007)
POP:SM IBEX:IND
Source: Bloomberg
(Values in € millions) 2013 2014F 2015F Net Interest Margin 2,447 2,414 2,559 Gross Income 3,707 3,886 3,568
Net Income 328 228 3
Cost/Income 47.29% 49.36% 52.50% Return on Equity 2.82% 1.78% 0.86% Return on Assets 0.22% 0.14% 0.07% Loan-To-Deposit Ratio 97.29% 88.46% 87.49% Risk-Weighted Assets 97,507 97,887 96,790
CET 1 Ratio 10.10% 10.60% 11.28%
BANCO POPULAR COMPANY REPORT
Table of Contents
EXECUTIVE SUMMARY ... 3
COMPANY OVERVIEW ... 4
HISTORY ... 4
SHAREHOLDER STRUCTURE ... 6
BANKING SECTOR ... 8
MACROECONOMIC CONTEXT ... 8
FUNDING STRUCTURE ... 11
Sources of Funds ... 11
Cost of Funds ... 13
PROFITABILITY ... 15
REGULATORY CAPITAL ... 17
Basel II ... 17
Basel 2.5 and III ... 18
Impact on Spanish banks and the stress tests ... 19
VALUATION ...21
POPULAR’S ANALYSIS ... 21
Assets ... 21
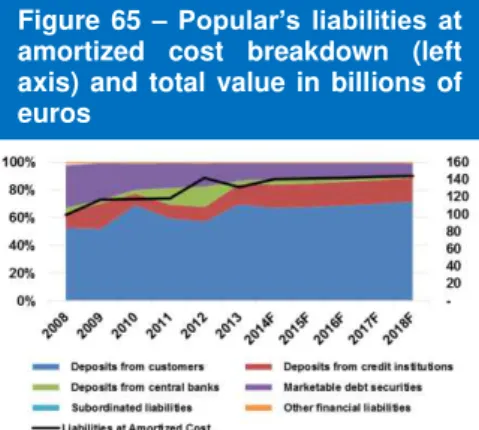
Liabilities ... 23
Income ... 24
COST OF EQUITY ... 25
SENSITIVITY ANALYSIS ... 26
MULTIPLES VALUATION... 27
APPENDICES...28
APPENDIX 1 - CONSOLIDATED BALANCE SHEET (SIMPLIFIED) ... 28
APPENDIX 2 – CONSOLIDATED INCOME STATEMENT (SIMPLIFIED) ... 29
BANCO POPULAR COMPANY REPORT
Executive summary
The Spanish economy has been marked with an extended expansion period, reaching its peak in 2008, after which it showed a contraction until 2013. During 2014, however, GDP seems to be showing positive signs of recovery, alongside the unemployment rate that seems to be decreasing. Spain, however, underwent a real estate bubble, with housing prices growing some astonishing 213% from 1995 to 2008. Financial institutions tried to ride on this evolution and had strong incentives to do so (high value of collateral and high returns for extended periods of time). This led to the increase of real estate loans by almost 1,000%, with the
weight of these loans on the banks’ loans portfolio increasing substantially.
However, in the beginning of 2008, this bubble burst and prices started declining. Furthermore, the international financial crisis had just begun, with a negative outlook on the world and Spanish economy. In the end, banks were left struggling
with huge losses, real estate assets remained in the banks’ balance sheets and
losses by default were registered. Altogether, this led banks to close the money
“tap” to prevent larger losses.
With the 2012 stress test results, Spanish banking system was concluded to be undercapitalized and in desperate need of capital. This drove Spain to accept a bailout plan which laid some harsh conditions on the banking sector, such as reduce the amount of employees and branches. Popular, due to the losses it had to recognised linked to real estates, was concluded to be in need of €3.2 billion,
which were covered through the issuance of equity (in order to avoid state aid). All in all, banks tried to isolate themselves from other financial institutions and central banks started to decrease their main reference rate. Despite all this, Spanish banks keep relying on deposits as their main sources of funds, regardless of the increase of its cost relative to some other funding. The sector as a whole has also assisted to a deterioration of its profitability, due to a degradation of the overall loan portfolio, which led to higher costs.
Given this background, the target price of Popular was estimated at €3.25
BANCO POPULAR COMPANY REPORT
Company overview
Banco Popular (“Popular”) was founded in 1926 and is headquartered in Madrid, Spain. It is the fifth largest Spanish bank in terms of market capitalisation, with assets totalling €159,993 million, a market share in Spain of about 6.0% in deposits and 3.7% in loans, and with approximately 72% of its revenues coming from commercial banking (3Q 2014). Popular has 1,951 branches all over Spain, 203 overseas and about 15,500 employees, and it is operating abroad through two foreign entities: Banco Popular Portugal in Portugal and Totalbank in Florida, USA (both wholly owned), in addition to a 25% holding in the Mexican entity Bx+. This international network is complemented by over a dozen representative branches and collaboration agencies. The company operates through four segments: Commercial Banking, Asset and Insurance Management, Real Estate, and Institutional and Market.
History
Popular has been historically a retail bank, even though it has seen an increase since 1992 of the weight of its trading and asset management activities (with special emphasis on the former since 2009). This reveals a shift to higher-risk activities in order to most likely produce higher returns, but with Basel III now in effect, it is not expected that Popular will start to focus on investment banking. In fact, what the majority of the banks previously focused on retail are doing, due to
the capital requirements based on assets’ risk, is to get rid of the investment
banking part of the group, in order not to tie so much equity in the group and improve its results.
Popular was outperforming the Ibex-35 index in terms of returns to equity until the end of 2014, where it started following the market trend, underperforming it later on. The extremely bad performance verified in the end of 2012 until the end of 2013 is related to the additional provisions and asset impairments that Popular had to do regarding non-performing loans, which resulted in extremely negative results. The decrease in the overall ROE is not entirely associated with a decrease in performance. In fact, the total income from trading, net interest margin and commission and fees has been growing during the vast majority of the period. This view is further supported by the fact that the net income of Popular has been increasing constantly up to 2007 (grew by about 650% from 1988 to 2007), after which the international and the Spanish real estate crisis started and results began to be less optimistic. The reason behind the pattern of the ROE appears to coincide with the beginning of capital issuances by Popular. After a share split and a capital decrease in 2000, Popular has been constantly Figure 1 – POP’s assets per
business (2005)
Source: Company Data
Source: Company Data
Figure 2 – POP’s assets per business (2013)
Source: Bloomberg
Figure 4 – POP and IBEX-35 historical return on equity Figure 3 – POP’s revenues historical breakdown
BANCO POPULAR COMPANY REPORT
placing new equity in the markets, starting June 2003, with about ten million shares.
Popular’s capital issuances gained, however, more relevance very recently.
When 2012 arrived, the near collapse of former savings banks forced Spain to
take a €41 billion bailout from the European Union which pressed the
government into forcing banks across the system to recognize their losses linked to real estates. Under that process, Spain subjected its banks to a stress test and an asset quality review in that same year and forced lenders, including Popular, to take steps to fix their balance sheets. Popular, just like many other banks, tried to ride on the real estate bubble that was happening in Spain. From 1988 until 2012, Popular saw the amount of its real estate loans skyrocketing, registering a growth rate of 11,236% (from €477 million to €54 billions). By the end of 2004, they already comprised over half of its loans portfolio, revealing a high exposure of Popular towards the real estate sector. When the Spanish real estate bubble finally burst, around 2008, Popular’s assets quality suffered deeply, and it started to gather foreclosed assets, which were pretty much comprised of houses (from loans that defaulted and had them as collateral) instead of getting cash from its borrowers. This would eventually result in the extra losses associated with non-performing loans that were previously mentioned. These exercises concluded that, inherent to these losses, Popular was undercapitalized and in need of €3.2
billion. With no other choice, Popular turned to the equity market in order to be able to fulfill the Common Equity Tier 1 established standards.
Taking now a closer look at its structure evolution, by the start of the millennium, Popular had successfully established a network of branches in Portugal. The Portuguese and Spanish markets are similar in many ways, so this entrance allowed Popular to get to a larger customer base using the same expertise it held on the Spanish market. Two years later, Banco Popular Comercial (a joint-venture in France funded with Banco Comercial Português) became a fully owned subsidiary of Popular and changed its name to Banco Popular France (later, in 2008, sold to Crédit Mutuel-CIC for €85 million). In the meantime, Popular bought Banco Nacional de Crédito in Portugal and transferred its existing Portuguese branches to it (in 2005, it was renamed to Banco Popular Portugal), hereby strengthening its position in the Portuguese market. In 2007, Popular acquired a small bank in the United States of America called TotalBank for $300 million, which operated at the time 14 branches and had assets worth about $1.4 billion. This acquisition allowed Popular to start operating in another continent, allowing a better diversification. TotalBank itself is a profitable franchise and with
deep ties to the local community and a business model focused on SME’s and
the Hispanic market, making it a good fit to Popular’s retail-focus strategy. In
Figure 6 – POP’s number of capital issuances
Source: Company Data
Figure 5 –POP’s net income in thousands of euros
Source: Bloomberg
Figure 8 – POP’s real estate loans in billions of euros
Source: Company Data
Figure 9 – POP’s real estate loans (% loan portfolio)
Source: Company Data
Figure 7 – POP’s non-current assets held for sale in millions of euros
BANCO POPULAR COMPANY REPORT
June 2014, the acquisition of the retail and credit card business of Citibank in Spain by Popular was agreed for €240 million, counting with 15 agencies, 900 commercial agents (credit card business), 45 branches, and about an hundred thousand customers (Retail business). Given the consolidation that the Spanish banking sector is going through, this acquisition enhanced Popular’s influence in the Spanish market, , in which the Citibank’s business itself proved to be a highly
profitable business with limited capital consumption and self-funded with the excess from deposits. One month later, Popular agreed to sell to Värde Partners 51% of its Bancopopular-e credit card business to set up a joint-venture. This
resulted in a capital gain of €422 million. Värde Partners is a privately held
investment management specialized in alternative investments, which gives some sense to this new joint-venture: it would be able to benefit from their expertise in revolving and direct sales channels and from Popular’s customer
base, diversified business mix and reputation. In overall, Popular appears as quite conservative regarding geographic expansion, with previous and current investments in foreign countries always representing just a small part of its business and, eventually, being sold to third parties after years of no development or serious investment and effort to make those positions grow.
Shareholder structure
Popular’s shares were listed only on the four Spanish Stock Exchanges (Madrid,
Barcelona, Valencia, and Bilbao) until 2006, when it did an initial public offering on the Euronext Lisbon. The bank is member of the Madrid stock Exchange general price index and of the Ibex-35 index (which comprises the thirty five most liquid stocks in the Spanish market). It is represented by 2,100,706,458 ordinary shares with a par value of €0.50 each. During 2013 and 2014, it has done eighteen issuances, doing one every month since May of 2014.
The largest capital issuance, since 1999, was in December 2012 with 6.2 billion shares being issued with a nominal value of €0.10 each. Popular had to sell shares and suspend its dividend payments at that moment in time to avoid resorting to state aid in order to cover the €3.2 billion capital deficit revealed in
stress tests that accompanied the European bailout for Spain’s banking system.
Looking at Popular’s share price since 1989, and analysing its total return until the present versus the total return of the Spanish market, it is interesting to see that Popular has greatly overcome the returns obtainable in the market, but it took an huge hit in 2007, with its share price falling dramatically and registering
€4.42 in the end of November 2014 (in 1988, its share price was valued at around €0.25). Notwithstanding the verified drop, if one invested 1€ in the end of
Figure 10 – Market share by deposits of top 10 banks headquartered in Florida
Source: SNL Financial (30th June 2006) Figure 11 – Number of outstanding credit cards (2014)
Source: Company Data
Figure 12 – POP and IBEX-35’s total return relative to 1989’s prices
Source: Bloomberg
Figure 13 –POP’s shareholders breakdown by type (3Q 2013)
Source: Bloomberg
Figure 14 – POP’s shareholders breakdown by type (28th Nov 2014)
BANCO POPULAR COMPANY REPORT
1989 on Popular’s shares, it would be worth €5.85, while the same amount on
the Ibex-35 index would be valued €4.60, in the end of November 2014.
Regarding the shareholders by type, there has been an increase of 33.64 percentage points (p.p.) of the shares owned by investment advisors, having the group of “Insurance companies” the highest decrease (15.85 p.p.), when looking upon the third quarter of 2013 to 28th November 2014. The dominance by
investment advisors is clearly seen when one looks upon the top 5 shareholders’
type: only one, the second largest shareholder, Caisse Fédérale Du Crédit Mutuel1, is not an investment advisor. Furthermore, besides it, only four other
institutions are included in the “Banks” caption: Dekabank Deutsche Girozentrale,
Espirito Santo Financial Group, Société Générale, and Danske Bank. The major shareholder is Vanguard Group Inc2, holding 7.3% of total shares. Allianz SE3 is
the third largest shareholder, followed by Baillie Gifford and Company4, and
BlackRock5. It is important to note that the caption “Governments” only includes
two entities: Norges Bank Investment Management6 and the Alaska Permanent
Fund7.
So, given the previous analysis, it seems that Popular’s shares are dispersed
across multiple entities. This implies that there is no major shareholder that has the power to prevent an acquisition of Popular. Furthermore, the shareholders composition shows that most of these are asset management companies, whose goal is to offer a decent return to its customers and, hence, do not necessarily show any intent to hold its shares for an extended period of time. This seems to show some vulnerability of Popular for a takeover. The only issue would be that the sheer amount of shareholders would complicate the negotiation process for the acquirer.
1Major French bank that registered a net income of about €12 billion in 2013.
2 American investment management company that managed approximately $2 trillion in assets (2013 figures)
and is one of the largest providers of Exchange-Traded Funds in the US.
3German multinational services company which registered a net income of about €2.8 billion in 2013 and had
a total of €1,361 billion under management.
4 Scottish company that manages international portfolios for US and Canadian clients and manages funds for
some of Continental Europe’s pension funds and financial institutions, and, in the end of 2013, it was
managing a total of £105.3 billion of funds.
5 The world’s largest asset manager in the world, registering a net income of about $3 billion and $3.14 trillion
of assets under management (2013 figures).
6Norway’s Government Pension Fund, managed by the Norges Bank (Norway’s central bank).
7 Permanent fund managed by the Alaska Permanent Fund Corporation and constitutionally established.
Figure 15 – POP’s five biggest shareholders (28th Nov 2014)
BANCO POPULAR COMPANY REPORT
Banking Sector
Recent times have been marked by stability on the financial markets, observing a reduction in financing costs, especially in the euro area. However, there has been a rise on the risk of a global recession, associated with the sharp slowdown in Asia (mainly in Japan, which entered its fourth recession in six years, and China) and stagnation in Europe. Notwithstanding, the results released on 26th October
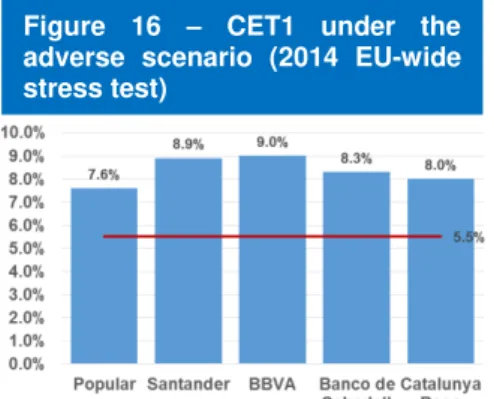
of the comprehensive assessment exercise conducted by the ECB give important insight to the loss-absorbing capacity of the participating banks (Popular included). The results show that of all the participating Spanish banks, in case of an adverse scenario (with a very low probability of occurrence), would still hold enough capital given the threshold defined in the exercise of 5.5%.
Macroeconomic context
After an extended expansion period of the Spanish economy, during which it enjoyed a compounded annual growth rate of 7.07% between 2000 and 2008,
Spain’s GDP reached its peak in 2008 of €1,088 billion, suffering a decrease of
3.76% in 2009. Until 2011, economic growth was practically inexistent but then had a relevant economic contraction (-1.63%) reaching a minimum in 2013. From 2008 to 2013, the economy decreased at an annual rate of 1.22%. During 2014, however, GDP seems to have been showing some positive results and, given this, it is forecasted that at the end of the year, GDP will have increased by
1.07%, attaining a value of €1,034 billion. This is an extremely positive sign of
recovery for the economy as a whole. The last time the economy grew was on 2008.
Regarding the unemployment rate, important to understand the Non-Performing Loans (NPLs) behaviour, one verifies a similar scenario to the one observed in the GDP evolution. The unemployment rate has increased since June 2007, being 26.10% in the end of 2013. Nonetheless, the economy’s recent
performance has shown signs of improvements and an unemployment rate of 24.64% is estimated for the end of 2014. This is expected to have a positive effect on the amount of NPLs, the amount of loans that the institutions are willing to make and the amount of deposits.
Despite these data, to fully understand what happened, let’s look at the Spanish real estate sector. Real estate activities are relevant to the Spanish economy and accounted for 8.51% in 2008, and most of the houses purchased and built were financed through loans by financial institutions. From the beginning of 1995 until the first quarter of 2008, housing prices grew some astonishing 213%. This was the consequence of a so-called housing bubble: high demand, speculation and Figure 16 – CET1 under the
adverse scenario (2014 EU-wide stress test)
Source: European Banking Authority
Figure 17 – Nominal GDP (Index – Base 2007)
Source: Banco de Espanã
Figure 18 – Unemployment rate
Source: Banco de Espanã
Figure 19 – Spanish Residential Property Price Index (Base 2007)
BANCO POPULAR COMPANY REPORT
the belief that real estate was an asset whose price would always rise drove the housing prices to increase remarkably. However, in the beginning of 2008, this bubble burst and prices started declining (prices declined by 30.70%). Given the Spanish real estate development in the past, these assets were used as collateral and loans were considered quite safe (high value of the collateral) and earned a high return, due to the extended maturity. This created strong incentives for credit institutions to increase the amount of resources they were allocating to this type of loan and the amount of mortgage loans increased from January 1995 to March 2008 by almost 1,000%, increasing the exposure of the financial institutions to the real estate area. With the bubble burst, the value of the collaterals used on the loans dropped significantly and the real estate market became more illiquid, which meant that builders were going to run into trouble trying to repay because they could not sell their new properties and banks would be able to recover significantly less than they initially expected from the sale of the collateral in case of default. Furthermore, the international financial crisis had just begun: economic growth was expected to slow down and unemployment to rise, increasing the amount of NPLs. In the end, banks were left struggling with huge losses: real estate assets remained in the banks’ balance sheets, losses by default were registered and banks are made to manage money, not real estate, which means that banks that were able to sell these assets were doing so with low prices and high costs. Therefore, they started to close the money “tap” to prevent larger losses. Nevertheless, the issue with the Spanish financial institutions was well hidden: banks were not reporting all of their losses when they should have. Spanish regulators allowed banks to use an accounting technique which basically understates past profits and shift them into later periods, allowing them to smooth volatility out and cover future losses with past profits (this is called dynamic provisioning).
Altogether, this deepened the crisis Spain was going through: the credit crunch made it harder for new companies to obtain funding and the ones who did were doing it at a more expensive price. Companies that wanted to refinance were also finding harsher conditions in the market. The total impact to banks due to the crisis and the real estate bubble was, however, still not well known.
Only in 2012, when the asset quality review and stress test results were released was the reality truly known to the public: Spanish banks were holding overvalued assets, undercapitalized and in desperate need of capital to fulfil the capital requirements and safeguard themselves of adverse shocks. The Spanish Government, with lower revenues associated to the Spanish economy recession that it was going through, under pressure to make money flow again in the economy and to prevent the collapse of the financial system, had no other choice Figure 20 –Real estate activities’
weight on Spain’s GDP
Source: Organisation for Economic Co-operation and Development
Figure 21 – Real Estate Loans exposure (line uses left axis)
Source: Banco de España
Figure 22 – Credit institutions and financial intermediaries’ non-current assets held for sale in millions of euros
Source: Banco de España
Figure 23 – Credit institutions and financial intermediaries’ impairment allowances of lending in millions of euros
BANCO POPULAR COMPANY REPORT
but to accept a bailout plan. This bailout plan was offered under the conditions that thousands of employees on the stressed banks would be laid off as well as some offices would be closed. Furthermore, several of the smaller and weaker banks have been merged or acquired by larger ones in order to recapitalize themselves. This means that the Spanish banking sector is in a consolidating process and a shift in scenario of small local banks to large multi-regional banks is starting to become more prominent. In overall, the number of employees and branches in the sector decreased 21% and 26% respectively from 2007 to 2013, while the number of institutions reduced by 18%. Specific to Popular, in the first quarter of 2012, within this process, it acquired Banco Pastor, while from 2007 to 2013, the number of employees and branches changed, respectively, by 6.58% and -9.99%.
The impact of these events on the investors’ perception is clear on the
government spread, as well as the subsequent expected improvement of the Spanish economy. In Spain, on 28th November, the annual yield on a 10-year
government bond was 1.90%, having a spread relative to the German counterpart of about 120 basis points (b.p.). If we look to the yields on 2nd
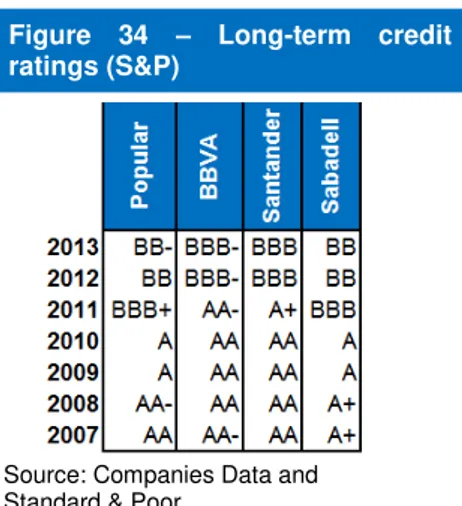
December 2013, the annual Spanish yield was 4.16%, while the German was 1.74%. This means that there has been a decrease on the spread of 122 b.p. Such phenomenon is also being accompanied by an improvement on the ratings and the respective outlooks by the credit rating agencies, even though it is still far from the ratings that Spain used to enjoy previously to the sovereign crisis in
Europe. Ever since the crisis, Spain’s outlook has been negative among
Standard & Poor, Moody’s, and Fitch, with some periods denoting a stable
outlook. This change in perspective is because, and according to the Standard & Poor report8, “Since 2010, Spain has implemented substantial structural reforms
that have improved the economy’s competitiveness and flexibility”. Hence, “Reflecting the effects of these reforms and our expectations that monetary policy
in the Eurozone will remain highly accommodative”, S&P revised and increased their forecasts for the Spanish economy’s growth. Moody’s share a similar
opinion9 and adds that the policy stance of the European Central Bank is
expected to stay the key driver of the overall euro area yields. In addition, a key moment and fact to consider for the present analysis is that Spain exited the European Union bailout program in January of the present year (2014) while also amid an improvement in the general sentiment in the European sovereign bonds
8Standardandpoors.com, 2014. Standard & Poor's | Americas. [online] Available at:
http://www.standardandpoors.com/prot/ratings/articles/en/us?articleType=HTML&assetID=1245377302966 [Accessed 4 Jan. 2015].
9Moodys.com, 2014. [online] Available at:
https://www.moodys.com/researchdocumentcontentpage.aspx?docid=PBC_177469 [Accessed 4 Jan. 2015]. Figure 24 – Spanish 10-years
Gov. Bond Yield vs German
Source: Bloomberg
Figure 25 –Spain’s credit rating changes (LT foreign currency)
BANCO POPULAR COMPANY REPORT
market, due to the positive results that are starting to show from the structural reforms implemented in most of the peripheral countries as well as the fiscal consolidation. Investors are, therefore, regaining confidence in these countries. All of this is a consequence of what was seen before: the improvement of market conditions which is translating into the generation of new jobs and, hence, the strengthening of the economic and financial position of households and corporations. In consequence, this predicts better results in terms of revenues to
the Spanish government, decreasing the country’s overall risk.
Funding Structure
The reactions that were triggered in the financial markets due to the international financial crisis can be summarised into two: (i) banks tried to isolate themselves from other financial institutions and so the interbank lending market slowed down, and (ii) central banks started to decrease their main reference rate in order to promote economic growth and access to capital by the banks. Despite all this, Spanish banks keep relying on deposits as their main sources of funds. The reason is simple: the interbank lending market is illiquid nowadays and the
central bank’s credit lines has its own limitations and restrictions imposed to its
borrowers. Despite the decrease in the yield to maturity of financial institutions’
bonds, they are still more expensive relative to deposits.
Sources of Funds
Deposits have been constantly the main source of funding for banks and, even post-crisis, they remain as the top source of funding. The amount of deposits has increased more than 120% from 2000 to 2013. Notwithstanding, there has been some clear changes on the composition of the sources of funds, with equity being the caption that increased its weight the most (by 6.5 p.p.). Equity, regarding the remaining sources of funds, is the most expensive one and the reason why banks have been raising more equity is mostly due to changes in the legislation and the outcome of the 2012 stress test, as will be seen and explained in the
section “Regulatory Capital”. All captions have, however, increased in terms of
absolute values during the period of 2000-2008: banks wanted to grow and needed cash to do so.
After the start of the financial crisis in 2007, with the world economy in danger and economic projections on negative grounds, the economic agents started being more wary and cautious when placing their money on any institution. Financial institutions began to mistrust other financial institutions and stopped lending money (especially given the event of the Lehman Brothers bank). The growth of Spanish banks’ funding reached a halt and stayed growing very slowly
Figure 27 – Deposits breakdown by depositor type in billions of euros
Source: Banco de España
Figure 28 – Spanish households’ indebtness
Source: European Central Bank
Figure 29 –Spain’s net national income (Index – Base 2007)
Source: World DataBank
Figure 26 – Credit institutions and financial intermediaries’ liabilities breakdown (Jan. 2000–Sep. 2014)
BANCO POPULAR COMPANY REPORT
up until mid-2012, after which, with the release of the 2012 stress test and the resulting bailout plan, banks were downsized and, therefore, the total amount of funding decreased by 16.54%. The caption “Securities (excl. shares)” was the
most affected, decreasing by 37.12% in terms of absolute value.
Regarding the deposits made by other resident sectors (figure 27), which includes non-financial companies and households, they hold, as expected, the highest share of deposits. Most of these deposits are characterized to be saving accounts and time deposits (on average 61%). Although not enough data was found, it seems reasonable to presume that the vast majority of these deposits are held by households and not companies: households are the ones who invest and work in companies and get the corresponding returns. Furthermore, all the excess cash not needed for the present or future operations of a company will be distributed to shareholders. So, companies will keep the “bare” minimum for
survival. With the international financial crisis and the real estate bubble, families, which were already over-indebted (indebtness in 2007 was 130% - figure 28), were now finding that their future income would be lower than expected, and banks were also being more rigorous on their credit screening. This had a triple negative effect for banks: i) one that was already discussed, which were more loan defaults, ii) the second one is that families, with lower or inexistent income had to start withdrawing their deposits in order to pay for their loans, and, iii) thirdly, families had less money to save, which means that they had less to deposit in the banks (and even within this saved amount, one cannot forget that there are other investment alternatives to deposits). Consequently, banks were having less cash in their balance sheet from the most stable source of funding that a bank can have, due to the ties generally created between depositors and the bank (although very susceptible to bank runs).
Concerning banks’ debt, until the international financial crisis, there is a
remarkable growth for the issuance of long-term and short-term debt securities, growing from the beginning of the millennium until the end of 2007 by 660% and 853%, respectively. This is also the result of the Spanish bubble real estate. Banks, in order to finance their growth through real estate loans, looked for funds in the market, which were priced at lower rates than the mortgage loans. However, when the international financial crisis began, several banks’ issues
started to emerge, such as was the case with Bear Stearns (rescued by JP Morgan) and Lehman Brothers (it was broken into different units and sold), and the interconnectivity between the financial institutions in the system, until then ignored, started to play a big role: the global financial system was highly exposed to systemic risk. The markets’ reaction was negative and institutions started
having issues to place their debt securities near investors, due to all the risks and Figure 31 – Other resident
sectors’ deposits breakdown by type of liability
Source: Banco de España
Figure 30 –Spain’s net national savings (% of GNI)
Source: World DataBank
Figure 32 –Spanish banks’ issued debt securities in nominal values and billions of euros
Source: European Central Bank
Figure 33 – International bank claims on banks in billions of US dollars (3Q 2008 to 2Q 2014)
BANCO POPULAR COMPANY REPORT
for the fact that the full impact of such events as the ones stated above was still not known. Banks themselves quickly started to stop lending money between them to reduce their exposure to other financial institutions and send a positive signal to the market. There was also an incentive for banks to do so with changes to the regulatory capital rules, since lending to other financial institutions started to require more equity to be incorporated on the funding of such loans. Even though the amount of equity required depended on the risk profile of the issuing institution, the mistrust generated in the markets and the amount of risk suddenly realized by them that financial institutions were bundled with, caused a drop on general ratings of all banks (that is, according to the new regulation, they were all risky institutions).
In 2012, when the need to recapitalize the Spanish banking system was reported and Basel III new rules were already more or less known by institutions (further
explained in the “Regulatory Capital” section), one can say that another shock
occurred to the structure of the banks’ debt maturities. The recapitalization of the
Spanish banking system was the opportunity for banks to start replacing their short-term and more volatile funding to a higher quality funding (more stable and longer maturities), to comply with the capital requirements. Long-term debt was also easier to place in the market, since these are more senior and, hence, less risky for investors.
Finally, looking at equity being held by banks, given what was previously said about the changes to the regulatory capital that requires banks to hold higher quality funding in order to create a better safety cushion to support unexpected losses on their assets, one verifies, unsurprisingly, that the amount of equity held by banks has been increasing: from the start of 2000 to the third quarter of 2014, total amount of equity grew by 275.43%.
Cost of Funds
From the beginning of 2003, the interest rates paid by banks, on all maturities and for all kinds of depositors, was slowly increasing, reaching its peak on October 2008 for both types (households and corporations), and registering a value of 4.70% (households) and 5.03% (corporations). After that period, there has been a sharp decrease on these interest rates. From October 2008 to September 2014, interest rates paid on deposits of households, with maturity higher than or equal to a year, in Spain, has decreased by about 3.8 p.p., offering in September an annual interest rate lower than in the Euro Area by 35 b.p. This evolution and lower interest rate than in the Euro Area is also verified when one looks into the interest rate paid to corporations for the same maturity. Interest rates have gone down by approximately 3.9 p.p. and the most recent data shows Figure 34 – Long-term credit
ratings (S&P)
Source: Companies Data and Standard & Poor
Figure 36 – Deposits’ annual interest rates for households and corporations for maturities over a year (Jan. 2007 to Sept. 2014)
Source: European Central Bank
Figure 35 –Spanish banks’ book value of equity net of valuation adjustments in billions of euros
BANCO POPULAR COMPANY REPORT
a differential from the Euro Area of 12 b.p. Despite these small differences, the
Euro Area and Spain’s interest rates follow a very close pattern.
The decrease in the deposits’ interest rates is normal since they happened in a
context of reduction of the overall interest rates. The Federal Reserve, on 16th
December 2008, decided to set the overnight federal funds rate to a range between 0% and 0.25%, marking the first time the Federal Reserve cut the rates below 1%. The European Central Bank’s refinancing rate has been constantly cut
after September 2008, with the exception of a small period near the end of 2011, reaching an historical low in November 2014 of 0.05%. The constant drops by the European Central Bank in this rate have been made to promote economic growth and to boost Eurozone inflation, which has been far from the 2% goal of the European Central Bank (Euro Area annual inflation was expected to be 0.3% in November 2014, while it was 0.4% in the previous month). The 6-months Euribor rate has verified a sharp decreased starting in the same period as the previous ones (the Euribor rate has an high positive correlation with the European Central
Bank’s refinancing rate, due to the opportunity cost of borrowing from the money
market or from the central bank). The yields on investment grade European corporate bonds of financial institutions10 have also seen a decrease from the
beginning of 2012, falling in the entire period available by 2.07 p.p. (data from before 2010 is unavailable). In sum, we are observing a market decrease in the most relevant interest rates, meaning that the cost of the funds used by banks is also decreasing.
Unlike interest rates, return demanded by shareholders has been increasing. The behaviour presented by cost of equity can be related to the financial institutions’
capital structure evolution: the debt-to-equity ratio was constantly increasing until the end of 2011. This means that the shareholders, as residual claimers of the
firm’s profit, would get less from the firm and were subject to higher volatility in
the flows to be received, since debtholders have priority over those cash-flows. By the beginning of 2012, the trend followed on the capital structure started to change, with the banks starting to recapitalize themselves through equity issuances. However, banks’ stocks have become cheaper in the markets due to the higher perceived risk. Two of the main drivers of a share price are the dividends per share paid by a company and the dividend growth rate, that is, the cash-flows a shareholder expects to receive from owning a stock. In the banking sector, shareholders got into a tough situation due to the legislation, more precisely Basel 2.5 and III. Shareholders’ responsibility for the performance of the bank is higher and the consequences of negative results will be, in first instance,
10 As measured through the Bloomberg EUR Investment Grade European Corporate Bond Index Financials
(BERCFI).
Figure 38 – 6 months Euribor rate (Jan. 2007 to Nov. 2014)
Source: Banco de Portugal and the European Banking Federation
Figure 37 – European Central Bank’s refinancing rate
Source: European Central Bank
Figure 39 – BERCFI’s bid yield -to-maturity
Source: Bloomberg
Figure 40 – Cost of equity
BANCO POPULAR COMPANY REPORT
supported by shareholders. This is not necessarily unusual since it is basically what happens in an ordinary company. The novelty here is that the recent regulation requires additional capital buffers to be held by banks and the failure or near failure to comply with these capital buffers ratios forces the bank to retain its earnings instead of distributing them for instance. This adds uncertainty to the expected dividends of financial institutions, making the expected cash-flows lower.
Concerning the relative cost of deposits, it is interesting to notice that, after the financial crisis, the intra-bank market and the European Central Bank’s interest
rates have shown a lower cost than deposit rates. Before the financial crisis, deposits were the cheapest form of funding. This change in relative costs shows the effort made by the European Central Bank to inject capital into the financial system in order to promote economic growth and avoid deflation (notice that the Euribor rate is highly influenced by the refinancing rate). However, the Eurosystem provides credit only on a collateralised basis, that is, a bank must pledge an asset to the Eurosystem (and the type of asset accepted is also limited) in order to be able to use its credit line and a bank has a limited number of assets that it can pledge. The other cheaper option is then the interbank lending market but, as was seen before, it has become illiquid. This leaves three options for the banks: issue capital, debt securities, or attract more deposits. Between these three options, a bank would rather avoid issuing equity at all.
Equity is the most expensive form of funding and it increases a bank’s overall
cost of capital tremendously. Debt securities by themselves are a good option but still more expensive than deposits. Therefore, despite the change in the cost of the different types of funding, deposits appear as the best type of funds available.
Profitability
For the following analysis, the values regarding Popular, Santander, BBVA, and Sabadell will be used (Santander and BBVA have a significant amount of operations outside of Spain and, hence, only their Spanish activity was taken into account). The selected banks were picked due to being influent on the Spanish banking sector, being public companies, implying easier access to public information about them, and also due to the fact that they belong to the Ibex-35 index. In total, these four institutions held in the third quarter of 2014 33.52% and 31.47% of all deposits and loans in the Spanish market, respectively, representing roughly a third of the deposit and loan activity. In that same period, there were 279 credit institutions and credit financial intermediaries operating in Spain. Therefore, these four seem to be good representatives of the sector as a whole.
Figure 41 – Over 1-year households’ deposit interest rate relative cost (black line = 1)
Source: European Central Bank and the European Banking Federation
Figure 43 – Spanish banks’ deposits market share
Source: Companies’ reports, Banco de España and Analyst’s estimates
Figure 42 –Spanish banks’ loans market share
BANCO POPULAR COMPANY REPORT
The total share of loans held by these institutions seems to have been quite constant since 2007, unlike the total share of deposits, which has increased on a faster rate since 2012. The reason why this might be happening was mentioned above: the Spanish banking sector is going through a consolidation, which means that these larger banks are acquiring several smaller ones in the market: BBVA acquired Unnim Banc in 2012 and Catalunya Banc CX in 2014; Banco Sabadell acquired Banco CAM in the end of 2011 and Banco Gallego in the beginning of 2013; Popular integrated Banco Pastor at the start of 2012; and Santander is the only one that grew organically in terms of deposits (no acquisition was made).
The shock experienced in 2012, however, had another effect on banks besides the emergence of the need to consolidate the sector, which was the tremendous
impact on the banks’ results. The reason of such impact is associated with the
2012 stress test’s result and the publishing of the Royal Decree-Law 2/2012 and
the Royal Decree Law 18/2012, created in order to address market concerns over the exposures to real estate assets through loans to real estate developers and assets taken as the result of a default by credit institutions. Together, they increased the (generic and specific) provisioning and created an additional capital buffer on impaired assets. Due to this, the total amount to be provisioned by the entire sector as a whole was estimated at about €50 billion, causing a
large negative blow to profits.
To further understand the evolution of the profitability in the sector, a DuPoint analysis over the average of the above selected banks is helpful. This surprisingly shows that there was an increase of the equity multiplier from 2007 to 2013, despite the increase in capital requirements. This is driven by Santander and BBVA that underwent a major downsize of their Spanish operations (assets were reduced by 21.07% in Santander and 10.98% in BBVA). Equity, therefore, also decreased, and by more than the assets. This may imply that these two institutions started to get rid of their risky assets in order to decrease the total amount of risky assets being held and, thus, require a lower amount of equity to fulfil the minimum capital requirements. Sabadell and Popular took the opposite action. Over the period they saw an increase in their size (112.88% and 37.96% respectively) and, hence, an increase in their equities, which was larger than the change in their respective assets. This evolution may suggest an increase in the amount of risky assets in order to increase return. On average, it seems that the first strategy held better results to prevent the decrease in the returns on equity, which originated from a dramatic decrease in the operating efficiency of the institutions. Santander and Popular were the ones with the largest decrease in ROE (-20.67% and -17.37%, respectively).
Figure 44 – Net Income for five Spanish banks in millions of euros (2007 to 3Q 2014)
Source: Companies’ reports
Figure 45 – Impairment losses (% Gross Income)
Source: Companies’ reports
Figure 47 – Gross Income breakdown (2007)
Source: Companies’ reports
Source: Companies’ reports
Figure 48 – Gross Income breakdown (3Q 2014)
Figure 46 – Breakdown of ROE of selected banks (equity multiplier is on the top axis)
BANCO POPULAR COMPANY REPORT
Looking at banks’ income breakdown, it is interesting to verify that banks’ income
is more dependent on trading and less on the net interest margin (NIM) and the fees and commissions charged, from 2007 to 2014. Even though banks are being charged less interest on their funding, there has also been a decrease on the interest rates that they charge which, associated with a lower demand for loans due to economic context, might explain the evolution of the net interest margin. The decrease in the fees and commissions are related to the general economic environment and the specific events that occurred in Spain: large amounts of cash were transferred from banks in southern Europe to less indebted nations such as Germany in fear of a need to rescue the government, which could include an heavy measure as the one that was proposed for Cyprus, in 2013
(20% tax on banks’ deposits). The near collapse of Spanish savings banks also
caused a serious loss of confidence in the Spanish banking sector. Altogether, banks lost a part of the capital they were managing and sought for return to compensate these losses. The solution found was the trading activity. This means that the banking sector actually became riskier due to its larger exposure to market fluctuations.
Banks have been, however, facing difficulties, such as the lower quality of their loans portfolio. Despite the drastic decrease of loans in 2013, the quality of the loans currently held appears to be less certain. This implies higher expenses for banks in terms of impairments and provisions set aside since expected losses are higher. The ratio of doubtful loans11 to the loans outstanding shows that 2%
of all loans in 2008 were uncertain or not expected to be paid back and, in the 2Q 2014, not only we have a huge difference in the amount of loans, but also 6.2% of all of them are not expected to be repaid. This ratio is, however, showing signs of improvement together with the economic recovery that Spain seems to be starting.
Regulatory Capital
Basel II
Basel II was published in June 2004, as a revision to Basel I, motivated by the increase in complexity of the financial instruments and activities. This was a consequence of the globalization of the markets, deregulation and the ever increasing sophistication of technology, the advances in the measurement and management techniques of risk, and also the significant losses registered outside of the credit and market risks (the only two risks considered by Basel I).
11 Loans where full repayment is questionable and uncertain, and usually are NPLs on which interest is
overdue and full collection of principal is uncertain. Figure 50 – Average lending rates
to households in Spain on new businesses (Jan. 2007 to Oct. 2014)
Source: Banco de España
Figure 49 – Average lending rates to non-financial corporations in Spain on new businesses (Jan. 2007 to Oct. 2014)
Source: Banco de España
Figure 51 – Total loans made by credit institutions in Spain, in billions of euros (2008 to 3Q 2014)
Source: Banco de España
Figure 52 – Doubtful Loans to Loans Ratio (2008 to 3Q 2014)
BANCO POPULAR COMPANY REPORT
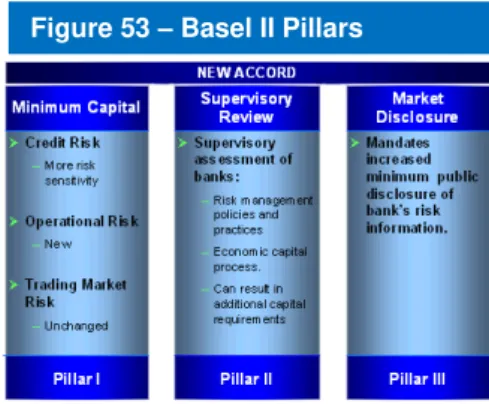
Basel II was organized into three pillars: Pillar 1 – Minimum Capital Requirements, Pillar 2 – Supervision Process, and Pillar 3 – Market Discipline. Pillar 1 determines the minimum capital requirements for the coverage of credit, market, and operational risks. The key change in here relative to Basel I, besides the introduction of a new risk, are the weights used for the calculation of the risk-weighted assets, which are more stringent and more punishing to the financial institutions. Pillar 2 intends to give more power to supervisors and allow them to actually adjust the capital requirements for each institution given their risk profile. It gives also the possibility to formalise risks that a particular institution faces even if it is not considered in Pillar 1. Pillar 3 focus on the release of information to the markets, in order for a higher transparency of the financial situation and solvency of institutions.
Basel 2.5 and III
Due to the vulnerability of the financial system exposed after the international crisis (associated to: i) the large off-balance exposures that financial institutions accumulated in the so called shadow banking system, ii) the excessive credit concession and the higher appetite for risk, favouring the appearance of speculative bubbles, and iii) the lower quality of capital being held), the Basel 2.5 and Basel III appeared as the two regulatory answers
Basel 2.5 contemplated more restrictions to what was, in fact, considered capital, in order to prevent accounting creativity and raise the quality of capital being held by banks. It also imposed a limit to large exposures, in pursuance of a higher
diversification in institutions’ portfolios and avoid large dependencies to a single
institution/group. Furthermore, some covenants were now in place for investing and selling banks regarding positions in a securitization (basically, increased risk weights), guidelines were applied regarding the monitoring and management of liquidity risk, and increased the frequency and standardization of the prudential reports.
Basel III redefined the tiers of capital into three categories: Common Equity Tier 1 (CET1), Additional Tier 1, and Tier 2, while at the same time setting criteria for each category that must be fulfilled for the funds intended to be eligible for any of these categories. New capital buffers were implemented, increasing the amount
of “pure” equity (CET1) required by banks to hold, such as the capital
conservation and countercyclical buffers. These huge changes to the capital requirements are accompanied by a transition period that, by 2019, should be fully completed, increasing the pressure on banks to start issuing more shares. Figure 53 – Basel II Pillars
Source: Basel 2 Implementation
Figure 54 – Shadow banking in percentage of GDP
Source: International Monetary Fund
Basel I and II Basel III
Tier 2 4.0% 2.0%
Additional Tier 1 2.0% 1.5%
CET 2.0% 9.5%
Minimum - 4.5%
Conservation Buffer - 2.5%
Countercyclical Buffer - 2.5%
Figure 55 – Minimum capital requirements
BANCO POPULAR COMPANY REPORT
Impact on Spanish banks and the stress tests
As expected from the change in the minimum capital requirements, there was a large jump in the amount of equity held mid-2011, being this the financial institutions response to the increase in the capital minimum requirements that, until 2019, will be slowly phasing in. However, ever since 2004, the amount of equity being held has been increasing, being nowadays the amount held almost
3.5 times the amount registered in January 2004 (€123.43 billion).
The change in the risk weights with Basel II partly explains the slowdown in the interbank lending market. Interbank loans within OCDE used to be weighed at 20% and, now, according to the borrower rating, the weight can go from either 20% to 150%. This means that when lending to a financial corporation, the lender might end up having to put aside an amount of capital at maximum equal to 150% of the exposure being created. Placing this together with the worsening credit ratings of the Spanish financial institutions and the existing mistrust within banks due to past and recent events, it is expected that the total amount of capital required for a loan to be closer to the 150% than the 20%, and so banks have strong incentives not to lend between them. This is, after all, a huge cost for
a bank that could be lending that same amount without having to “place on hold” such a large proportion of its own funds. This increases banks’ emphasis on the
catchment of deposits.
Besides avoiding these heavier positions, banks seem to be, in overall, decreasing their risky exposures in order to avoid more equity issuances. By lowering the amount of risk-weighted assets, banks are, this way, increasing the ratios that are obliged to comply with, mitigating the need of new capital. This can further reinforce the reasoning behind the previous observation that the amount of credit outstanding was decreasing.
In July 2010, the stress tests on 91 European credit institutions were published. The test scenarios and methodology were developed together by the Committee of European Banking Supervisors and the European Central Bank. The commitment made at the European level was that the participating institutions of each country should represent at least 50% of the banking sector. With the aim of increasing transparency of the Spanish banking sector, however, stress tests were conducted for all listed banks and for all saving banks, accounting for practically 100% of the total assets of Spanish banks. The results were quite positive: no private bank needed more capital to reach a Tier 1 ratio of 6% in the adverse and unlikely scenario.
One year later, July 2011, another stress test was presented and, once again, none of the Spanish commercial and saving banks were required to increase Figure 56 – Book-value equity in
credit institutions and credit financial intermediaries (Index – Base 1st Jan. 2004)
Source: Banco de España
Figure 57 – Basel I vs Basel II risk weights
BANCO POPULAR COMPANY REPORT
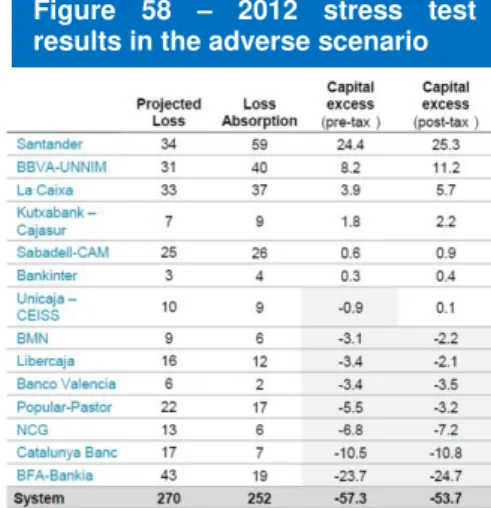
their capital as a result of the stress test. Nonetheless, after two years of very positive conclusions, Spain assisted to the near collapse of its savings banks and required to ask for a bailout. The asset quality review and bottom-up stress test exercised published on September 28th 2012, elaborated by Oliver Wyman,
showed that Spanish banks needed between forty to fifty-nine billion euros of bailout money from the European rescue funds in order to create a large enough
capital cushion to protect against a serious further downturn in the country’s
economy. Popular was one of the banks in need of capital, indicating a need of
€3.2 billion with this exercise to make it safe in a stressful situation.
This raises the question why did not the two previous stress tests detect any issues. Analyzing each scenario presented, the 2012 adverse macroeconomic scenario in comparison to the previous two is more severe. There is a higher contraction of the economy accompanied of a higher unemployment rate. The euro has a serious devaluation compared to the USD, although the commercial and residential negative impact are not as huge as the 2011 ones. What marked the difference, however, was the fact that the 2012 stress test was not only a stress test, it was a combined stress test and an asset quality review, that is,
prior to subjecting the financial institutions’ assets and liabilities to the tests,
these would go under scrutiny to assess their value. This independent asset quality review had auditors doing a full data tape validation and random sampling to detect errors in the accounting, while, on the other hand, it counted with real estate appraisers in order to evaluate a random sampling of the collaterals banks were accepting as well as to give input regarding their perspectives on the real estate market. This allowed a comprehensive real estate asset revaluation and to understand the banks’ foreclosed assets portfolio. Thus, allowing a more precise estimate of losses on the sale of foreclosed assets. On an adverse scenario, these losses were projected to amount about €56 billion. In overall, the 2012 stress test (and asset quality review) allowed to give numbers to losses that the market was concerned about and not much information was available regarding them.
Figure 58 – 2012 stress test results in the adverse scenario
Source: Banco de España
2010 2011 2012
GDP (average growth rate) -1.3% -1.1% -2.2%
Unemployment rate (average) 21.0% 21.9% 26.3%
USD exchange rate (average) 0.7 0.6 1.3
Inflation rate (average) 1.1% 0.3% 0.5%
Short-term interest rates (average) 2.7% 3.0% 1.8%
Long-term interest rates (average) 6.3% 6.5% 7.6%
Commercial Property Prices (avg. growth rate) -17.5% -27.0% -24.1%*
Residential Property Prices (avg. growth rate) -4.5% -11.7% -9.2% * - Analyst's estimate from available data.
Figure 59 –2010, 2011, and 2012’s adverse macroeconomic scenarios
BANCO POPULAR COMPANY REPORT
Valuation
The target price €3.25 (for the end of 2015) was obtained through a valuation that
applied a Discounted Cash-Flow-to-Equity (DCFE). The choice of this method is inherent to the fact that, on a bank, it is impossible to separate the financing and investing decisions from the operating decisions. It is important to notice that financial institutions are under strict regulation, having to hold a certain amount of equity relative to their risk weighted assets, and this was controlled for.
Popular operations’ can be summed up to three locations: United States of
America, Portugal and Spain. However, due to the scant amount related to the United States region, Popular incorporated in 2013 that region’s results, in its report by segments, into the Spanish region. Furthermore, Portugal and Spain were considered as one in this report since they both share many similar conditions, such as market sentiment and standing, customers’ characteristics, and culture, and only about 7% of total assets in 2013 were in Portugal, showing that it has a very small weight in the group’s operations.
Popular’s analysis
Given all that was said regarding the Spanish banking sector and since Popular
tends to follow its trend, let’s analyse what are the forecasts being made to
Popular’s main captions and why. These forecasts concern to the 4th quarter of
2014 and go until the end of 2018. Afterwards, a constant growth rate was assumed.
Assets
Starting with the “Cash and Balances with the Central banks”, it was made an
BANCO POPULAR COMPANY REPORT
Up to 2012, Popular’s was experiencing a growth on the amount of loans, with a special emphasis on the customers segment. As was seen before, behind this growth was a large increase in the amount of real estate loans that slowed on 2008 due to the Spanish real estate bubble burst. Ever since the 2012 stress test and the respective bailout agreed upon by Spain, however, the total amount of loans in Spain has suffered severely, and Popular’s loan portfolio was not an exception. In that period, with a negative outlook on the Spanish economic growth, and an increasing unemployment rate, demand for loans had a sharp decrease, but Popular was able not only to maintain its market share on loans, but also increase it. For the future, it is expected that Popular will continue to strengthen its position but at a very slow rate as the sector starts to settle (e.g. stopping reducing employees and branches) and acquisitions are fully integrated
into Popular’s structure. The downward pressure on total loans on Spain is
expected to remain until 2016, although at a slower pace, since, at this moment
in time, the current very small and fragile economic recovery that last quarter’s
numbers show is expected to stabilize and, at the same time, families will be less indebted and with better perspectives for their future income, making them also more viable to request for loans and increasing loans’ demand.
The credit institution segment was forecasted to remain at similar levels as the average of previous years (€5,393 millions) since, although the volatility, there
seems to be a constant level being reached over time. While the debt securities segment is a residual item, that is, the portfolio value was estimated and the weights of the two other segments was attributed. The difference between the
portfolio value and the two other segments’ value would be the value of this
segment. Given historical behaviour, this caption only appeared in 2012 and, as such, it is expected to disappear again as time goes on.
The available-for-sale (AFS) portfolio, Popular’s second largest portfolio, has shown signs of growth over the past years. This portfolio comprises debt securities and equity instruments that do not fit into the FVTPL, HTM, or L&R portfolios and are held to be sold when appropriate. It is mostly comprised by debt securities. The breakdown of the portfolio shows that Popular has been increasing its exposure to the Spanish government since 2007, making it even more vulnerable than it already is to the Spanish economy. At the same time, it decreased drastically, from 2007 to 2008, its exposure to credit institutions. As was explained before, this occurred in line with the slowdown in the interbank lending market associated with the mistrust between financial institutions and the collapse of several large banks, revealing a more conservative policy of Popular in order to avoid unnecessary exposure to the financial sector (government
bonds’ yields were high and the probably of default much lower than for credit
Figure 60 – Popular’s L&R breakdown (left axis) and portfolio value in billions of euros
Source: Company Data
Figure 61 – AFS portfolio’s evolution in billion of euros
Source: Company Data and analyst’s estimates
Figure 62 – Popular’s debt securities breakdown (left axis) and debt securities’ value in billions of euros