FUNDAÇÃO GETULIO VARGAS ESCOLA de
PÓS-GRADUAÇÃO em ECONOMIA
Bernardo Dantas Pereira Coelho
Essays in Applied Economics: Inequality
and Voting Decision in Brazil
Rio de Janeiro
2017
Bernardo Dantas Pereira Coelho
Essays in Applied Economics: Inequality
and Voting Decision in Brazil
Rio de Janeiro
2017
Tese submetida à Escola de Pós-Graduação em
Economia como requisito parcial para a obtenção
do grau de Doutor em Economia.
Área de concentração: Microeconomia aplicada
Orientador: Francisco Junqueira Moreira da Costa
Ficha catalográfica elaborada pela Biblioteca Mario Henrique Simonsen/FGV
Coelho, Bernardo Dantas Pereira
Essays in applied economics: inequality and voting decision in Brazil / Bernardo Dantas Pereira Coelho. – 2017.
95 f.
Tese (doutorado) - Fundação Getulio Vargas, Escola de Pós-Graduação em Economia.
Orientador: Francisco Junqueira Moreira da Costa. Inclui bibliografia.
1. Renda – Distribuição. 2. Programa Bolsa Família (Brasil). 3. Mulheres na política. 4. Eleições. I. Costa, Francisco Junqueira Moreira da. II. Fundação Getulio Vargas. Escola de Pós-Graduação em Economia. III. Título.
Agradecimentos
Dedico esta tese, que é o resultado final de muito esforço e muita dedicação, a todos aqueles que me acompanharam neste longo processo.
Em especial agradeço a minha querida Luísa, companheira incondicional que me ajudou de mais formas do que posso compreender. Seu amor, paciência e carinho foram
fundamentais ao longo de toda essa jornada.
À minha querida família. Meus pais, Paulo e Elisa, minha irmã Sílvia e tia Cláudia, que sempre acreditaram em mim e que tornaram tudo isso possível.
Ao meu sobrinho Nilo, cujo nascimento trouxe tanta felicidade nesta difícil reta final do doutorado.
Aos meus amigos que vibraram junto comigo com minhas conquistas, me alentaram nos momentos difíceis e me ajudaram a nunca desistir. Dentre tantos queridos amigos, que prefiro não listar por medo de deixar alguém de fora, preciso destacar a importância da Luciene Pereira, companheira desde a primeira semana de aula da graduação.
Aos meus colegas de IBRE, em especial a Silvia Matos, por todo o aprendizado e enorme companheirismo. O contato com meus brilhantes colegas ao longo de todos esses anos foi fundamental para meu desenvolvimento como economista.
Ao meu orientador, Francisco Costa, por toda a paciência, esforço e por sempre acreditar que eu poderia fazer melhor. Sem sua ajuda boa parte deste trabalho não seria possível. Por último, mas não menos importante, gostaria de agradecer ao meu professor, colega, orientador, coautor e amigo Mauricio Canêdo, que de tantas formas contribuiu para meu crescimento pessoal e profissional.
Resumo
Essa tese contém três capítulos. O primeiro capítulo estuda a relação entre o programa brasileiro de transferência condicional de renda Bolsa Família e os resultados das eleições de 2010. Nós procuramos estimar esse efeito utilizando uma abordagem estrutural, identificando características individuais que afetam o impacto eleitoral do programa. Fazemos isso utilizando um modelo mixed logit, um modelo de escolha discreta que considera tanto a distribuição paramétrica de variáveis não observadas quanto a distribuição não-paramétrica de variáveis conhecidas. Resultados indicam que o caráter redistributivo do programa possui um impacto eleitoral nos eleitores maior do que os ganhos individuais de renda dos beneficiários. O efeito marginal de ser um beneficiário do programa na decisão de voto é equivalente a um aumento de 81 reais na renda mensal do trabalho, menos do que o valor médio recebido por beneficiário que é de 90 reais. Nosso exercício contrafactual aponta que, sem o programa Bolsa Família, a incumbente, Sra. Rousseff, perderia 5,6% do total de votos, deixando o resultado da eleição inconclusivo.
O segundo capítulo estuda a participação feminina na política, que aumentou na última década tanto em países ricos como em desenvolvimento. Não é claro, no entanto, se isso é parte de uma tendência ou apenas um crescimento reversível. A literatura apresenta argumentos teóricos tanto para um efeito de reforço quanto para um negativo da exposição a uma liderança negativa na probabilidade de apoio futuro a uma candidata mulher. Usando dados eleitorais e do Censo para o Brasil, testamos se o efeito da presença de uma prefeita mulher numa cidade impacta o apoio futuro a candidatas mulheres para Deputada Federal e não encontramos evidência de efeito significativo. Além disso, mostramos que apenas o uso de estatísticas agregadas, como médias demográficas, levaria a concluir equivocadamente que eleitores expostos ao governo de uma prefeita mulher teriam uma menor probabilidade de votar numa candidata mulher.
O último capítulo investiga os determinantes para a queda de desigualdade de renda entre municípios brasileiros entre 2000 e 2010. Usando dados censitários, mostramos que a desigualdade caiu mais rápido em municípios com um maior nível de desigualdade em 2000 – sugerindo 𝛽-convergência. Nós então, utilizamos a decomposição dinâmica (Shorrocks, 1982) para identificar a contribuição de mudanças nas condições do mercado de trabalho, como aumento do salário mínimo, formalização e melhoria na educação na convergência de desigualdade regional. Encontramos que a queda na desigualdade de renda no emprego
formal foi o principal contribuinte para a redução de desigualdade de renda entre municípios no período.
Abstract
This thesis contains three chapters. The first chapter studies the relationship between the Brazilian CCT program Bolsa Família and the outcome of the 2010 elections. We seek to estimate this effect using a structural approach, identifying individual characteristics that affect the electoral impact of the program. We do so by using a mixed logit model, a discrete choice model that considers both a parametrical distribution of unobserved variables and a non-parametrical distribution of known variables. Results indicate that the redistributive character of the program has a larger electoral impact on voters than the individual income gains of the beneficiaries. The marginal effect of being a beneficiary of the program on voting decision is equivalent to 81 Reais increase in monthly labor income, less than the average value received by a beneficiary, which is 90 reais. Our counterfactual exercise points that, without Bolsa Família, the incumbent, Mrs. Rousseff, would have lost 5.6% of the votes, making the election results unclear.
The second chapter studies female participation in politics has increased in the last decade in both rich and developing countries. It is not clear, however, if this is part of a trend or just a reversible growth. Literature presents theoretical arguments for both a reinforcing force and a negative effect of the exposure to a female leadership on the probability of supporting a future female candidate. Using electoral and Census data for Brazil, we test the effect that the presence of a female mayor in a municipality has on future the support for a female candidate for Federal Deputy and find no evidence of a significant effect. Furthermore, we show that the use of aggregate statistics alone, as demographic averages, would mislead us to conclude that voters exposed to a female mayor have a smaller probability to support a female candidate.
The last chapter investigates the determinants of the decline of income inequality across municipalities in Brazil between 2000 and 2010. Using censuses data, we show that inequality fell faster in municipalities with higher inequality levels in 2000 – suggesting 𝛽-convergence. We, then, employ a dynamic decomposition (Shorrocks, 1982) to assess the contribution of changes in private labor market conditions as the increase in minimum wage, formalization and increase in education levels on the regional inequality convergence. We find that the fall in wage inequality in the private formal sector was the main driver of the reduction in income inequality across municipalities in the period.
Sumário
Capítulo 1 ... 11
Electoral impact of Conditional Cash Transfers programs: The Bolsa Família experience 11 1. Introduction ... 11 2. Data ... 16 3. Methodology ... 19 3.1. Mixed Logit ... 19 3.2. Linear Models ... 21 3.3. Instruments ... 22 4. Results ... 26 4.1. Regressions coefficients ... 26 4.2. Counterfactual ... 32 4.3. Marginal effects... 34 5. Conclusion ... 36 References ... 38 Annex ... 41 Capítulo 2 ... 43
Tightening the gap – determinants of female political participation and the influence of quotas ... 43
1. Introduction ... 43
2. Literature Review ... 46
2.1. Political Explanations for Women’s Political Representation ... 46
2.2. Individual Factors and Female Support in Politics ... 49
2.3. Quotas and Female Participation ... 51
3. The Quota for Women in Lower House Elections in Brazil ... 52
4. Data ... 55 5. Methodology ... 57 5.1. Fractional logit ... 58 5.2. Mixed logit ... 59 6. Results ... 61 7. Conclusion ... 66 References ... 68 Capítulo 3 ... 70
Determinants of the decline in regional income inequality in Brazil ... 70
2. Data ... 73 3. Methodology ... 76 3.1. Decomposition ... 76 3.2. Convergence ... 77 4. Results ... 79 4.1.1 – Dynamic Composition ... 79 4.1.2 – 𝜷-convergence ... 81 4.2. Minimum wage ... 83 4.3. Formalization ... 86 4.4. Education ... 88 5. Conclusion ... 91 References ... 92 Appendix ... 96
11
Capítulo 1
Electoral impact of Conditional Cash Transfers
programs: The Bolsa Família experience
1. Introduction
Conditional Cash Transfer (CCT) programs expanded during the late 90’s and 2000’s as an attempt to decrease poverty and inequality.1 Due to the direct cash transfer to particular groups, such programs have been questioned about their potential electoral motivation. This article’s objective is to answer three questions: What is the size of the impact of a CCT program on the election outcome? Which individual characteristics relates to CCT electoral impact? How this impact compares with other political determinants?
In order to accomplish this objective, we analyze the Brazilian CCT program, Bolsa
Família, which is often described as the largest in the world in number of beneficiaries
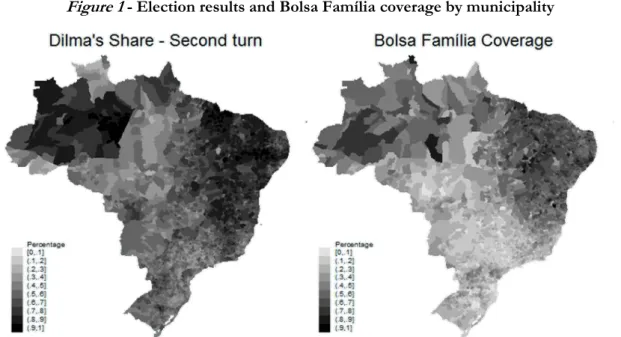
(Loureiro, 2012). We study the case of 2010 Brazilian presidential election, which presented a geographical division correlated2 with the size of the Bolsa Família program in the county, as shown by Figure 1, which depicts Mrs. Rousseff support on the runoff of 2010 elections and Bolsa Família coverage by Brazilian county. Political scientists (Zucco, 2008; Rennó and Peixoto, 2011; Hunter and Power, 2007) offer many explanations for this division, among them is the influence of Bolsa Família. This study attempts to further understand this division by analyzing not only the municipal coverage of the program, but the individual characteristics of the electors in each Brazilian county.
1 Examples of programs are: Female Secondary School Assistance Project, established in 1994 in Bangladesh;
Chile Solidario in 2002; Oportunidades/Progresa, in Mexico 2002; Program Minhet El-Osra, Egypt 2009; Şartlı Nakit Transferi (ŞNT) in Turkey 2003 and Bolsa Família in Brazil, 2003.
12
Figure 1 - Election results and Bolsa Família coverage by municipality
Figure presents the correlation between the electoral support of the incumbent candidate in the runoff of the 2010 elections and the coverage of the Bolsa Família program. North and Northeast regions, which are poorer and have larger Bolsa Família coverage, supported the government candidate, Mrs. Dilma Rousseff. Southern parts of Brazil, which are richer, majorly supported the opposition candidate - A pattern already observed in the 2006 elections.
While trying to measure the electoral impact of the Bolsa Família program we take part in a literature that seeks to identify the electoral impact of CCT programs. There is a vast discussion on the mechanism in which this impact would happen. Part of the literature argues that a welfare program that reduces inequality offers opportunity for incumbent propaganda (Pierson, 1996; Hunter and Power, 2007). Another fraction has a different vision and believe that such programs perpetuate a clientelism linkage and that voters may even vote against their preferences due to fear of ending of the program (Cornelius, 2004; Schedler, 2000). Another strand argues that the incumbent benefits from a mobilizing effect, which swings support from voters who have preferences for redistribution (De la O, 2010; Peixoto and Rennó, 2011). Analysis of worldwide experiences of CCT programs include, for example, Mexico (De la O, 2013; Cornelius, 2004; Schedler, 2000), Uruguay (Manacorda et al., 2011), Philippines (Labonne, 2013), Colombia (Nupia, 2011), and Turkey (Aytac, 2014).
The Brazilian experience with the Bolsa Família program has been previously studied with different approaches. When analyzing electoral literature, the first problem that arises is the natural absence of individual data. Votes are secret and because of that we can only have access to aggregate voting counts, which is one way to deal with the absence of individual observations. The other approach literature uses to solve this limitation is the use of individual data through surveys, as in Zucco (2013, 2015) and Zucco et al. (2016). Using both survey and aggregate data, the author finds evidence supporting the electoral influence of CCT programs, but more in the short than in the long run (Zucco, 2013). However, the use
13
of survey data can lead to estimation impacts much different from the models using aggregate data (Zucco, 2015), which can either be due to some restriction in survey data or to individual characteristics not captured by models that only use aggregate data.
One important advantage the use of survey data has over aggregate information is the possibility to test the mechanism of the electoral impact of CCT programs. For example, Zucco et al. (2016) identifies that, unlike assumed by the literature (Fiszbein et al., 2009; Lavinas et al., 2014), conditionality is not necessarily linked to the program acceptance by non-beneficiaries, although the authors find this link to be true for better-off individuals. The use of survey data, however, has some issues well known in literature (Selb and Munzert, 2013). One major problem with survey data is the possibility of untruthful answers, especially in cases when supporting one candidate is not broadly accepted, as was the case of Trump supporters in the 2016 U.S. election (Klar et al., 2016). Another concern is about the surveys’ representativeness as surveys are, in general, applied in a restrictive region. In this paper we use data from Brazilian Census, which has the advantage of covering all Brazilian counties.
Working with aggregate data, however, does not solve all issues. Canêdo-Pinheiro (2015) observed two common methodological problems. Linear models are, in general, misused in this literature – both when using surveys and aggregate data – because the dependent variable of econometric models usually is the percentage of votes a candidate has in a region. Hence the range of the values is [0,1] while most linear models assume that the dependent variable is not limited, it may assume values in the range (-∞, ∞). The second problem is the aggregation bias, which can be defined as the inference error of individual choices from aggregate statistics. This error arises from individual heterogeneity, not contemplated by aggregate variables and may generate biased results. This problem is well documented by Stoker (1993) and Lourenço (2009). Pinho Neto and Machado (2017) mitigate the aggregation bias by analyzing data as disaggregated as possible, in the polling booth level. The authors use information on the percentage of Bolsa Família beneficiaries per booth and compare the results of different sessions in the same polling place, using fixed effects control for polling place.
In this paper we propose to solve the aggregation problem with the use of a structural econometric model. We estimate a mixed logit model by adapting BLP framework to consumer demand (Berry, Levinsohn and Pakes, 1995), in which consumer (voters) chose between products (candidates) from different firms (parties) in different markets (electoral districts). The Mixed logit model has the advantage to allow heterogeneous parameters, as
14
voters have individual preferences for observed and unobserved candidate characteristics and for abstention. Individual preferences are linked to aggregate votes and demographic variables, so that estimating the model allow for recovering the voters’ indirect utility. At the same time, the use of the logit form solves the misuse of linear models, while incorporating individual data mitigates aggregation bias. Although we are not the first article to use a mixed logit model in the electoral context (Lourenço, 2009; Glasgow, 2001), we are, to the best of our knowledge, the first to incorporate individual data, and thus the cross effect, on the estimation of CCT electoral impact.
By incorporating the cross effect of individual variables on municipal characteristics, we are able to estimate how individual characteristics relate to the expansion of the Bolsa
Família across municipalities. For example, we are interested in testing how individuals’ labor
income affect the probability of rewarding electorally the incumbent due to an increase in the Bolsa Família municipal coverage and, by doing so, identify if this effect is different between richer and poorer individuals.
Using the estimates, we are able to compare the marginal impact of characteristics such as labor income and being a Bolsa Família beneficiary on the probability of supporting the incumbent candidate. Individual parameters estimates also allow for counterfactual exercises in which we estimate incumbent voting shares in a scenario without Bolsa Família.
In our estimations, to avoid the possibility of endogeneity due to being a beneficiary of the program being correlated with the error term, we instrumentalize the Bolsa Família coverage using two different instruments based on the percentage of families eligible for the program.
The reason we study the 2010 elections is due to availability of data. Brazilian Superior Electoral Court provides voting shares of each candidate for very small levels of geographical aggregation. Bolsa Família coverage and individual characteristics, on the other hand, are available only at the municipal level, using the Brazilian Census (Censo) database. Being an expensive research, the Censo is only realized every ten years.3 2010 is, therefore, a year in which both presidential election and Census data are available.
Our estimations using the mixed logit model for the second ballot of the 2010 elections show that the coverage of Bolsa Família at the municipal level is positively associated
3 The last five times the Census was researched was in 1970, 1980, 1991, 2000 and 2010. Due to lack of
15
with voting shares of Mrs. Rousseff. Furthermore, the cross effect between Bolsa Família coverage and labor income suggests that the impact of the program is decreasing with individual income. This result indicates that aggregate models, limited to the use of average income, underestimate the electoral impact of the Bolsa Família program.
The counterfactual exercise of estimating the electoral shares of Mrs. Rousseff in a scenario without Bolsa Família indicates a reduction of 6.3% of total votes. In absolute numbers, this represents 6.2 million votes. In this scenario, President Rousseff would have 49.8 percent of the total valid votes on the runoff voting,4 making the final election outcome unclear. The counterfactual results sheds light on the importance of incorporating individual information, as the same exercise applied on linear models using only aggregate data suggest a reduction of up to 2.45 percentage points.
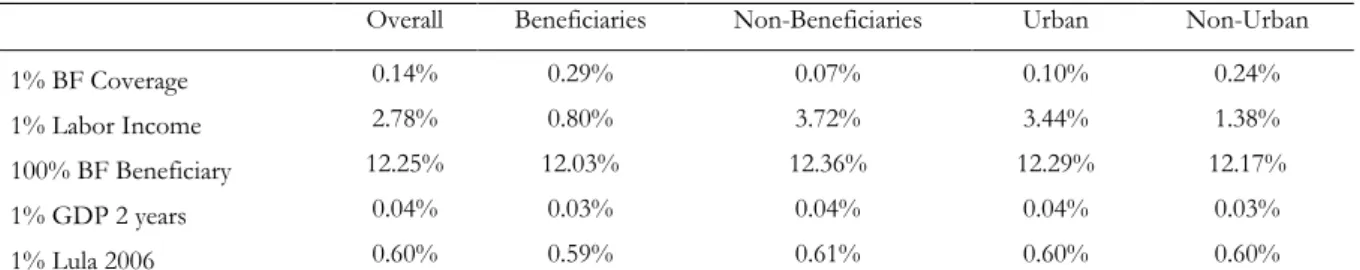
Another form of measuring the electoral impact of the program is to analyze the marginal impact of both the Bolsa Família coverage and the individual receiving benefit from the program. Bolsa Família coverage marginal impact indicates the increase in probability of voting for Mrs. Rousseff as a result of the increase in 1% of the average coverage in all counties. The latter, regarding individual receiving cash transfers from the
Bolsa Família, indicates the changes on the probability of supporting Mrs. Rousseff if the
individual has a beneficiary in the family. Our results indicate that, on average, an increase in 1% of Bolsa Família coverage among all counties increase support for Mrs. Rousseff by 0.14%. Furthermore, by comparing the marginal effect of being a beneficiary with the marginal impact of individual wages, we find that the value of the additional labor income required to have the same electoral impact of being a beneficiary of the program is 81 reais, less than the average Bolsa Família transfer of 90 reais.5
The main contribution of the paper is to incorporate individual data, and thus individual heterogeneity, into the literature that measures the electoral impact of CCT programs.
After this introduction, chapters 2 and 3 describes, respectively, the data and methodology used in this article. The analysis of our estimations’ results are presented on the fourth chapter. Finally, chapter 5 presents our final remarks.
4 The votes in the opposition and the null votes would represent the remaining 50.2 percent.
5 Source: MDS (Ministério do Desenvolvimento Social) Brazilian Ministry of Social Development and Fight against
16
2. Data
Bolsa Família is a conditional cash transfer program, founded by president Luiz Inácio
Lula da Silva, from the Labor Party (PT), in 2003. The program started by combining five existing programs that provided different aid varying from education support like Bolsa Escola program to gas subsidies like Auxílio Gas. These existing programs – created by the previous president Fernando Henrique Cardoso, from the Brazilian Social Democracy Party (PSDB) – were relabeled, largely expanded through the following years and became one of the main propaganda of president Lula’s government.
The program is considered to be one of the most successful conditional cash transfers programs in the world due to the large number of families covered. When created, it provided financial aid to 3.6 million families. This number rose to 11 million by 2006, reached 12.8 in 2010. By 2013 it reached its peak at 14.1 million families and since them fell to 13.8 million in 2015.6
Due to the relevance of the program, the number of families affected and the large propaganda from the Labor Party, the Bolsa Família political impact is debated since the 2006 elections. The data used in this article will come from two databases, as one of the main characteristics of the methodology used is to use distribution of individual data to estimate aggregate electoral shares, hence we use a database with municipality characteristics (electoral database) and one with individual information (demographic database).
Table 1, presents summary information for both datasets. The first five variables present information of each of the 5,564 municipalities in the electoral database. For the Census database, the first variable is the percentage of families eligible for the Bolsa Família program, a municipal information. While the last seven variables summarize the sample of 20,635,472 observations from the demographic database. Electoral and demographic databased were summarized using, respectively, weights of the municipality share in the election and individual weight in the Census database.
This paper decision of focusing on the 2010 elections is given by the combination of a presidential election year with the availability of data from the Brazilian Census database, the Censo Demográfico (here after, Censo). The main advantage of using this database is the possibility of identifying the municipality in which the individual lives, unlike PNAD,7 the
6 Source: MDS (Ministério do Desenvolvimento Social) Brazilian Ministry of Social Development and Fight against
Hunger.
17
second largest Brazilian household survey, in which only the state is observable. This is important for it allows us to estimate candidate’ shares using the distribution of individual data of 5564 municipalities and not just the 27 Brazilian states. From this database we construct the demographic database by extracting, for simplicity, a sample of 1000 observations per municipality, extracted considering the weight of each observation in the
Census database per municipality.
The first characteristic extracted is a dummy constructed to represent if the individual’s family was eligible to receive Bolsa Família, despite if it actually received or not. This variable was constructed following Souza et al. (2013). There are basically two criterions for a family to be eligible: to be very poor (total household income per capita less than 70 reais8 per month) or to be poor (total household income per capita less than 140 reais per month) and have children (up to 17 years old) enrolled in a school.9 With this information we construct a variable representing the percentage of families eligible for the program in each municipality.
The remaining variables are individual characteristics. The first and more obvious is a dummy if the family of the individual is a beneficiary of the Bolsa Família program. Censo doesn’t have a question about the amount received, only if the individual is a beneficiary of the program10 and, as only one person per family receives the aid, we construct a dummy if someone in the family does. Table 1showsthat22% of the individuals in our sample belong to a family in which a member receives income from the Bolsa Família program. The second and third variables analyzed are the Napierian logarithm of labor income11 and a dummy if the individual lives in an urban area. The idea for both these variables is to capture, respectively, economic and geographical bias. The logarithm used in the labor income makes difficult for the value to be analyzed, but the fact that the standard deviation is larger than the income mean indicates how large is income inequality. Table 1also shows that 84% of the individuals live in an urban area. The last variables depicted in the demographic database are dummies for the characteristics of the individuals, such as gender, race and ability to read. Table 1 shows that, in 2010, 83% of the population was alphabetized and 48% was white.
8According to Brazilian Central Bank, by the end of 2010, one real was worth around 0.60 dollar. 9 See Souza et al. (2013) for further information.
10 Question V0657 from the Census database asks if the individual has income from the Bolsa Família
program or from the PETI (Programa de erradicação do trabalho infantil) Eradication of child labor program
11 We use the logarithm in order to avoid problems with very large incomes. As ln(0) → −∞, we add 1 real
to each individual labor income. A small value that is not enough to generate any distortion, but sets the ln of labor income to zero for individuals without labor income.
18
The electoral information comes from Zucco database12 which contain, among its variables, voting shares for each candidate and municipality in the second round of the 2006 and 2010 elections.13 The 2010 voting shares are the dependent variable of our estimation and we use the shares of Mr. Lula in the 2006 election to control for a political bias of the municipality, as both elections were disputed between candidates of PT and PSDB.14 The average of the variables, depicted in Table 1 are the election results, in which Mrs. Rousseff and Mr. Lula won with 56% and 61% of the votes in the runoff voting. Zucco’s base also presents data on municipality GDP growth in the period 2008-2010, provided by IBGE,15 which is important as individuals in municipalities that grow more might have higher probability to support incumbent candidates. On average, the GDP growth of the municipalities is virtually zero, which shows that on average Brazilian municipalities didn’t present a harsh recession scenario in the period of the 2009 crisis. The last two characteristics needed in the database are the percentage of families in each municipality that receives Bolsa
Família and the target of the program,16 which was defined in 2004 and determined, for each municipality, the percentage of families that should receive Bolsa Família, according to the rule of the program. While individual information on being beneficiary of the program indicates the direct impact on household income, the municipality percentage of beneficiary families captures the redistributive impact on society.
12 See Zucco (2013).
13 Primary source is the TSE (Tribunal Superior Eleitoral), Brazilian Superior Electoral Court. In both 2006 and
2010 elections, the first round ended without majority and a second one was needed. In the second round, only the two candidates with the most votes in the first round dispute the election.
14 Lula (PT) x Alckmin (PSDB) in the 2006 elections and Dilma (PT) x Serra (PSDB) in the 2010 ones. 15 IBGE (Instituto Brasileiro de Geografia e Estatística), Brazilian Institute of Geography and Statistics.
16 Primary source is MDS (Ministério do Desenvolvimento Social) Brazilian Ministry of Social Development and
19
Table 1 - Summary of data
Database Variable Observations Mean Std. Dev. Min Max
Zuc
co
Rousseff’s share on second ballotof 2010 elections 5,564 0.56 0.15 0.20 0.97
Target % of families receiving Bolsa Família 5,564 0.21 0.16 0.03 1.00
Share of families receiving Bolsa Família 5,564 0.23 0.19 0.00 1.00
Mr. Lula share on second ballotof 2006 elections 5,564 0.61 0.16 0.15 0.97
Municipal GDP growth in the period 2008-2010 5,564 0.01 0.07 -0.43 3.43
C en su s 20 10
Dummy for Elegibility 20,635,472 0.17 0.38 0.00 1.00
Estimated % of families eligible for Bolsa Família 5,564 0.16 0.14 0.00 0.79
Dummy for Beneficiary in the family 20,635,472 0.22 0.41 0.00 1.00
Ln of labor income 20,635,472 2.83 3.36 0.00 13.76
Dummy for Urban 20,635,472 0.84 0.36 0.00 1.00
Dummy for Literate 20,635,472 0.83 0.38 0.00 1.00
Dummy for Man 20,635,472 0.49 0.50 0.00 1.00
Dummy for White 20,635,472 0.48 0.50 0.00 1.00
This table displays descriptive statistics of the data used in this article. The variables are divided by database and include information on 5564 Brazilian municipalities and individual information available at Census. Source: 2010 Brazilian Census, IBGE, MDS and TSE.
3. Methodology
This session is divided in three parts. The first one describes the methodology of the mixed logit model; the second one presents the linear models counterparts of the mixed logit and the last one describes the instruments used in both the Instrumental Variables (IV) and mixed logit models.
3.1. Mixed Logit
The Mixed logit is a random-parameters logit demand model from product market shares, first presented by Berry, Levinsohn and Pakes (1995) – henceforth BLP. Unlike in traditional Industrial Organization applications, in which both the supply and the demand of a product are analyzed, in this electoral framework the supply (candidates) are given and the study the demand of the voters. Mixed logit belongs to the category of models based on the assumption that a voter’s preference for a candidate or party can be described by a utility function, which depends on characteristics of the individual and the alternative of candidates. When voting, individual select the candidate that yields the highest utility.
The Mixed logit framework is particularly useful in the electoral analysis as it addresses one central challenge, which is the inference of individual behavior from aggregate data. We describe this method following Nevo (2000) and define the indirect utility of the elector i when voting for Mrs. Rousseff while living in the municipality t by:
20
𝑢𝑖𝑡 = 𝐵𝑡𝛼𝑖 + 𝑤𝑡𝛽𝑖 + 𝜉𝑡+ 𝜀𝑖𝑡, 𝜀𝑖𝑡~𝑃𝜀(𝜀) (1)
where Bt stands for the Bolsa Família’s coverage in the municipality, wt and ξt are,
respectively, vectors of observable and non-observable characteristics of the municipality, and εit is the error term.
Let 𝑤𝑗𝑡 = [𝑥𝑗𝑡 1], which is equivalent of 𝑤𝑗𝑡 plus a constant, it is possible to rewrite
(1) as:
𝑢𝑖𝑗𝑡 = 𝐵𝑡𝛼𝑖 + 𝑥𝑗𝑡𝛾𝑖+ 𝜙𝑖 + 𝜉𝑗𝑡+ 𝜀𝑖𝑗𝑡 (1’)
Furthermore, we define the vector of parameters to be estimated as:
( 𝛼𝑖 𝛾𝑖 𝜙𝑖 ) = ( 𝛼 𝛾 𝜙 ) + ( 𝛱𝛼 𝛱𝛾 𝛱𝜙 ) ⏞ 𝛱 𝐷𝑖 + ( 𝛴𝛼 𝛴𝛾 𝛴𝜙 ) ⏞ 𝛴 𝜐𝑖, 𝜐𝑖~𝑃𝜐∗(𝜐), 𝐷 𝑖~𝑃̂𝐷∗(𝐷) (2)
where 𝐷𝑖 and 𝜐𝑖 represent, respectively, vectors of observable and non-observable individual
characteristics. 𝛱 and 𝛴 stands for the matrix of parameters that represent how individual preferences vary with observable and non-observable individual characteristics. 𝑃𝜐∗(𝜐) is the
parametric distribution of 𝜐, while 𝐷𝑖~𝑃̂𝐷∗(𝐷) is the known, non-parametric distribution of
the microdata.
Without generality loss, the model is completed by defining the indirect utility of voting on another candidate or voting null as containing only the error term, which has zero mean (𝑢𝑖0𝑡= 𝜀𝑖𝑡). Let 𝐷𝑖 = [𝐵𝑖 𝐷̃𝑖]′ be a vector that includes a binary variable that indicates
whether the individual receives Bolsa Família (𝐵𝑖) and the other observable characteristics of
the voters (𝐷̃𝑖). Furthermore, we define the individual characteristics (both observable and non-observable) by 𝜏𝑖 = [𝐷𝑖 𝜐𝑖].
The probability of the individual i, living in the municipality t, to vote for Mrs. Rousseff is given by:
𝑃𝑟𝑜𝑏𝑖𝑡 = 𝑃𝑟𝑜𝑏(𝑈𝑖𝑡 > 0) (3)
Let 𝐴𝑡 be the group of characteristics of the elector i, living in the municipality t, that
makes him vote for Mrs. Rousseff. Hence:
21
where 𝑤𝑡 and 𝜉𝑡 are vectors of observable and non-observable individual characteristics. The
share of votes of Mrs. Rousseff in the municipality t is: 𝑠𝑡(𝑤𝑡, 𝐵𝑡, 𝜉𝑡, 𝛱, 𝛴) = ∫ 𝑑𝑃𝐴 ∗(𝐷, 𝜐,𝜀)
𝑖 (5)
By applying the Bayes Rule, and then considering the independence of the individuals, we can rewrite 5 as follows:
𝑠𝑡(𝑤𝑡, 𝐵𝑡, 𝜉𝑡, 𝛱, 𝛴) = ∫ 𝑑𝑃𝐴 𝜀∗(𝜀)
𝑖 𝑑𝑃𝜐
∗(𝑣)𝑑𝑃̂
𝐷∗(𝐷) (5’)
where 𝑃∗ represents the populations’ distribution function.
From (2), we have:
𝜙𝑖 = 𝜙 + 𝛱𝜙𝐷𝑖 + 𝛴𝜙𝜐𝑖 (6)
We can replace 𝜙𝑖 from equation (6) into equation (1’) and as a result:
𝑢𝑖𝑡 = 𝜙 + 𝐵𝑡𝛼𝑖(𝜏𝑖) + 𝑥𝑡𝛾𝑖(𝜏𝑖) + 𝛱𝜙𝐷𝑖+ 𝛴𝜙𝜐𝑖+ 𝜉𝑡+ 𝜀𝑖𝑡
𝑢𝑖𝑡 = 𝜙 + 𝐵𝑡𝛼𝑖(𝜏𝑖) + 𝑥𝑡𝛾𝑖(𝜏𝑖) + [𝜋 𝛱̃𝜙][𝐵𝑖 𝐷̃𝑖]′ + 𝛴𝜙𝜐𝑖+ 𝜉𝑡+ 𝜀𝑖𝑡 (7)
Note that (7) allows that not only being beneficiary of the Bolsa Família to affect voting decision, but also that non-beneficiaries also have their decision impacted by the program. Furthermore, municipalities characteristics, which are aggregate variables, affect voting decision differently depending on the individual’s characteristics. Finally, both observable and non-observable individual characteristics affect voting decision.
From (5’) we have that the shares of votes for Mrs. Rousseff on municipality t can be written as 𝑠𝑡 = ∫ 𝑑𝑃𝐴 𝜀∗(𝜀)
𝑖 𝑑𝑃𝜐
∗(𝑣)𝑑𝑃̂
𝐷∗(𝐷), which means that is not possible to estimate
the share of votes of a candidate in a certain municipality without considering the distribution of individual characteristics. Also, it is only possible to write 𝑠𝑡 as a function only of aggregate
variables if 𝛼𝑖 = 𝛼 , 𝛾𝑖 = 𝛾 , 𝛱𝜙 = 0 e 𝛴𝜙 = 0. In particular, if 𝜀𝑖𝑡 is identical and
independently distributed following the extreme value distribution of type I: 𝑠𝑡 = exp (𝜙+𝐵𝑡𝛼+𝑥𝑡𝛾+𝜉𝑡)
1+exp (𝜙+𝐵𝑡𝛼+𝑥𝑡𝛾+𝜉𝑡) (8)
3.2. Linear Models
By defining a candidate’s vote share in a given municipality by (8), we can easily modify the municipality or the demographic information to obtain counterfactual shares.
22
For instance, by setting Bolsa Família municipality coverage and individual benefits to zero, we estimate the candidate’s share in a scenario without the program.
As described, the main advantage of using the mixed logit methodology is the possibility of using individual data distribution in the estimations. To analyze this impact in the estimation results, we will compare the mixed logit results with those of the aggregate data using ordinary least squares (OLS) and instrumental variables (IV) estimations. In these, instead of using the individual data sample distribution, we use municipality averages of the full database in the estimations.
Furthermore, in order to better compare the OLS and IV regressions with the mixed logit results, we estimate the candidate’s share in both its linear and logit form. In particular, the logit version will assume the form:
ln ( 𝑠𝑡
1−𝑠𝑡) = 𝜙 + 𝐵𝑡𝛼 + 𝑥𝑗𝑡𝛾 + 𝜀𝑗𝑡 (9)
As each municipality has a different number of observations and votes, the error variance will be 𝑉𝑎𝑟(𝜀𝑗𝑡) =
1
𝑁𝑡𝜇𝑡(1−𝜇𝑡) as in Maddala (1983). To estimate (9) using OLS and IV each municipality observation should be weighted by 𝜔𝑡= 𝑁𝑡𝑠𝑡(1 − 𝑠𝑡).17
3.3. Instruments
Before the analysis of the estimations results, we must consider the possibility of being a beneficiary to be correlated with the error, i.e. for the estimation to present endogeneity problem. To avoid this possible estimation deficiency, we instrumentalize the Bolsa Família coverage – 𝐵𝑡 on equations 8 and 9 – with two different instruments, in both
the BLP and IV estimations.
The first is the target of Bolsa Família program, defined in 2004 by the MDS, Brazilian Ministry of Social and Agrarian Development, in which the percentage of beneficiary families in each municipality was estimated. The second instrument also focus on the eligibility criteria of the program but was constructed using the demographic database. Following the eligibility criteria of the program – described in the second session of this article – we construct a dummy for individual eligibility and then aggregate to obtain the percentage of individuals in each municipality whose families are eligible for the Bolsa Família program, on the Census database. Hereafter these two instruments will be simply denominated as target and eligibility.
23
The idea of using instrument is to find a variable that is both correlated with the Bolsa Família coverage and uncorrelated with the errors. The correlation between the coverage and the percentage of eligible families (both in the target and in the Census database) is straightforward. The remaining question is if these instruments are uncorrelated with the error. Zucco (2013, 2015) presents several characteristics of the program design which support both the target of the program and the eligibility as politically unbiased and thus uncorrelated with any omitted information. Among the characteristics listed are the technical definition of eligibility, preventing individual favoring; the direct transfer through bank system, preventing local politicians to make propaganda at the moment of payment and the audition by the comptroller general’s randomized auditing of federal transfers to municipalities.
To better evaluate if the choice of the instruments is appropriate, we run a few tests, usual in the literature. Table 2 presents the first stage of the IV regression, in which the instrument and the other variables are used to estimate the variable we want to instrumentalize, the Bolsa Família Coverage. Table 3 presents, for our two instruments – in both linear and logit form – overidentification, underidentifications and weak instruments tests. The first stage of the IV regression and the tests use the specification BLP-3, described in the next session.
Table 2 presents the first stage regression estimations for eight equations, depending on three pairs: instrument used (target or eligibility), regression form (linear or logit) and instrumented variable (Bolsa Família coverage or its iteration with average labor income). The statistical significance of the instruments’ β coefficient, presented in Table 2, indicates that the use of the instrument is necessary and the OLS estimations might be biased due to endogeneity problems.
24
Table 2 - First stage regression of Bolsa Família Coverage
Target - Linear Target - Logit Eligibility - Linear Eligibility - Logit
BF
Coverage BF Coverage * Labor Income Coverage BF BF Coverage * Labor Income Coverage BF BF Coverage * Labor Income Coverage BF BF Coverage * Labor Income
(1) (2) (3) (4) (5) (6) (7) (8) Target 0.131*** -1.703*** 0.108*** -2.120*** (0.01) (0.04) (0.02) (0.12) Target * Labor Income -0.021*** 0.949*** 0.002 1.050*** (0.01) (0.01) (0.01) (0.04) Eligibility 0.109*** -2.048*** 0.052* -2.752*** (0.02) (0.05) (0.03) (0.17) Eligibility * Labor Income 0.006 1.095*** 0.001 1.045*** (0.01) (0.02) (0.02) (0.1) GDP growth -0.009 -0.145** -0.005 0.035 0.016 -0.187*** 0.013 -0.203** (0.03) (0.06) (0.03) (0.09) (0.03) (0.06) (0.03) (0.1) Lula's share 2006 0.051*** 0.124*** 0.046*** 0.142*** 0.054*** 0.105*** 0.050*** 0.161*** (0.01) (0.01) (0.01) (0.04) (0.01) (0.01) (0.01) (0.06) Labor Income -0.019* -0.064*** -0.007 0.014 -0.008 -0.046** -0.001 -0.065 (0.01) (0.02) (0.01) (0.04) (0.01) (0.02) (0.01) (0.05) Urban 0.015*** 0.076*** 0.021*** 0.089*** 0.016*** 0.022** 0.019*** 0.004 (0) (0.01) (0.01) (0.02) (0) (0.01) (0.01) (0.02) GDP growth * Labor Income 0.003 0.057** -0.003 -0.025 -0.005 0.074*** -0.008 0.060* (0.01) (0.02) (0.01) (0.04) (0.01) (0.02) (0.01) (0.04) Bolsa Família beneficiary 0.890*** 1.814*** 0.934*** 2.155*** 0.904*** 1.898*** 0.991*** 2.498*** (0.01) (0.03) (0.02) (0.09) (0.01) (0.04) (0.03) (0.16) Constant 0.039 0.076 0.000 -0.156 -0.003 0.111* -0.020 0.187 (0.03) (0.06) (0.04) (0.1) (0.03) (0.06) (0.04) (0.14)
This table presents the estimated coefficients for the first stage regression of the regression. Eight estimations are presented based on the instrument, regression form and instrumented variable. The instruments used are the target of the Bolsa Família program for columns (1) to (4) and the estimated share of families eligible for the program for columns (5) to (8). The estimation form can be linear or logit. If column is indicated as linear, regression comes from equation (8) and if it is logit, equation (9). The instrumented variable can be either the Bolsa Família coverage – columns (1), (3), (5) and (7) - or its iteration with average labor income – columns (2), (4), (6) and (8). The first value is the β and bellow, in parenthesis, the robust standard errors. * p<0.05, ** p<0.01, *** p<0.001
The first test analyzed in Table 3 is the Sargan-Hansen which is a test for overidentifying restrictions. The joint null hypothesis is that the instruments are valid instruments – uncorrelated with the error term – and that the excluded instruments are correctly excluded from the estimated equation. Under the null hypothesis, the test statistic is distributed as chi-squared in the number of (L-K) overidentifying restrictions, where L is the number of instruments and K of regressors, therefore L-K is the number of overidentifying restrictions.
The underidentification test is an LM test to see if the equation is identified – the excluded instruments are correlated with the endogenous regressors. Under the null hypothesis that the equation is underindentified, we test the rank of the matrix of reduced
25
form coefficients on the L1 excluded instruments, which has rank=K1-1 where K1 is the number of endogenous regressors. Under the null hypothesis, the statistic is distributed as chi-squared with L1-K1+1 degrees of freedom. If we reject the null hypothesis, then the matrix is full column rank and is identified.
We say the instrument has the problem of weak identification when the excluded instruments are correlated with the endogenous regressors, but only weakly. In this case, IV estimates are biased in same direction as OLS, and weak IV estimates may not be consistent (Chao and Swanson, 2005). We use the Kleibergen-Paap Wald version for this test. The Cragg-Donald Wald test demands errors to assume i.i.d. form, while the Kleibergen-Paap Wald test is better suited when estimations drop the i.i.d. assumption and are robust to heteroskedastic, which will be the case of our specifications.
Table 3presents the results for the three tests described. The overidentification test is indicated by the Hansen J statistic, in which we reject, for very small significance levels, p-value <0.001, the null hypothesis of overindentification. For the specifications using the target coverage as instrument, and for the linear specification using percentage of eligible individuals as instrument, Underidentification test presented p-value close to zero, which allows us to reject the null hypothesis of underidentification and allowing the conclusion that these specifications are correctly identified. The last specification, using logit variable and eligibility as instrument, however, we cannot reject the null. This indicates that the instrument is irrelevant, as it is not correlated with the endogenous regressor. Finally, the weak identification test presents large F-statistic in the Kleibergen-Paap Wald test, for the specifications that were correctly identified using Stock-Yogo (2005) critical values. This allows us to reject the null hypothesis of weak identification and conclude that both instruments are well suited for both the linear form and target for the logit one of the equation 8 – for the BLP model – and 9 for the IV model.18
The redundancy of the instrument is naturally tested by the difference in the results between the OLS and IV coefficients. If the results are very similar, it indicates that the instrumentalized variable is uncorrelated with the errors, indicating that using an instrument is unnecessary. In the next session we show that in the linear models, for example, the coefficient for Bolsa Família Coverage loses statistical significance when an instrument is used.
26
Table 3 - Instrument tests results
This table present the underidentification, weak identification and overidentification instruments test, based on the equations presented in Table 2. For the weak identification test, Stock-Yogo (2005) critical values are: 10% maximal IV size 7.03; 15% maximal IV size 4.58; 20% maximal IV size 3.95; 25% maximal IV size 3.63.
4. Results
In this chapter, we analyze the electoral impact of Bolsa Família program using the Mixed Logit models described in the previous chapter. In the first session of the chapter we analyze the coefficients of the regressions and compare them with the aggregate models; the second session does a counterfactual exercise and estimates Mrs. Rousseff’s share in 2010 elections in a scenario without Bolsa Família; the last section analyzes the marginal effects and compare the program impact with labor income and economic growth of the municipalities.
4.1. Regressions coefficients
This section describes the coefficient results for both the mixed logit methodology and its linear counterparts. Table 4 presents the coefficients for different specifications of the mixed logit (BLP) estimation, and Table 5 depicts the OLS and IV regressions. Due to the logit form, the interpretation of the coefficient’s value is not straightforward, as the β’s are the means of the distribution of marginal utilities. Nevertheless, the signal of the coefficients and its statistical significance indicate the direction of variable’s impact on electoral decision.
In our specifications, the dependent variable is Mrs. Rousseff’s share in the runoff voting of 2010 elections (𝑠𝑡), with the exception of logit OLS and IV regressions that are estimated using the direct counterpart of the mixed logit form and the dependent variable is ln ( 𝑠𝑡
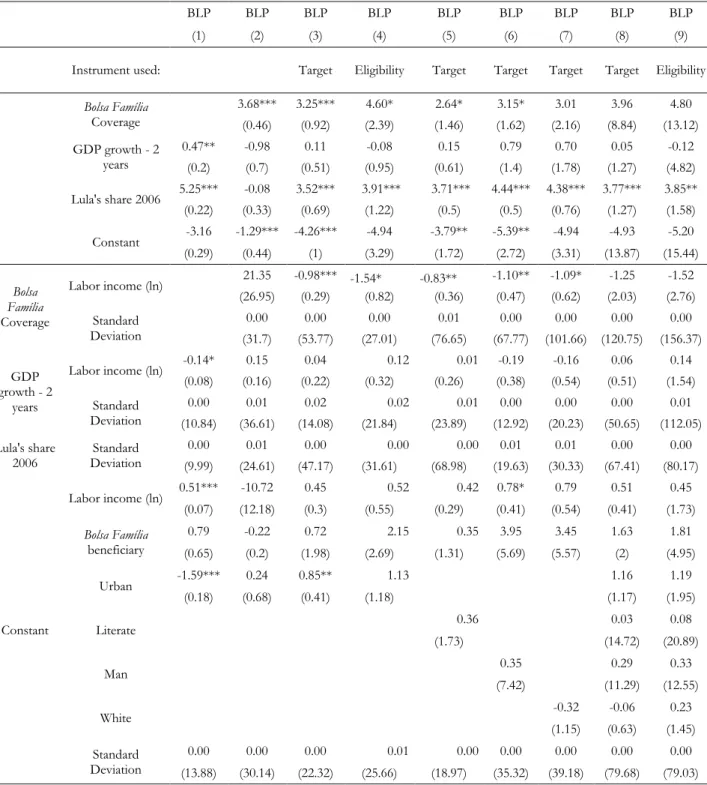
1−𝑠𝑡). For each specification, Table 4 and 5 present the β and the standard deviation of the estimators. On Table 4, the total impact of a municipal variable, such as Bolsa Família Coverage is given by the sum of direct impact, depicted by its β, and the cross impact of the demographic variables and the municipal ones. For example, in specification BLP-3, the average impact of the distribution of labor income of individuals in the demographic database on the municipal Bolsa Família Coverage is estimated to be -0.98, with a standard
Target linear Target logit Eligibility linear Eligibility logit
Underidentification test
LM test – Chi-square 74.22 51.79 58.10 1.04
P-value 0.00 0.00 0.00 0.31
Weak identification test
Kleibergen-Paap Wald rank F-statistic 41.198 28.5 28.565 0.385
Overidentification test
27
deviation of 0.29. The overall mean impact of a demographic variable on an individual probability to vote on Mrs. Rousseff is the coefficient of the interaction of the variable with the constant, plus the product of each coefficient of a municipal interaction with the municipal variable value for that individual.
For each interaction between the municipality variables and the demographic ones, the BLP estimations present the unobserved demographics’ effect, labeled as standard deviation (SD), as the unobserved characteristics are captured by the econometric error term.19 In all variables of every specification, the unobserved demographic effect on electoral decision is statistically insignificant.
In the mixed logit specifications, depicted by Table 4, Bolsa Família Coverage effect on the probability an individual voted on Mrs. Rousseff in the second ballot of the 2010 election is positive and statistically different from zero in every specification. This result indicates that, on average, municipalities that had a larger share of beneficiaries had a bigger probability of voting for the incumbent candidate.
On the other hand, municipality GDP growth in the period 2008-2010 appears to have no significant effect on electoral decision, as the only specification in which this variable’s coefficient is statistically significant is the BLP-1, where no instrument was used and Bolsa Família Coverage was not included. Which suggests that local economic performance doesn’t affect national electoral decision.20 President Lula’s share, however, is the only variable that has a positive impact for every estimation in which we use an instrument, even for very small significance level (less than 1%). Indicating that if an individual lives in a municipality where Mr. Lula had a better performance (hence has a bigger probability of having supported Mr. Lula in 2006), then he has a larger probability of supporting Mrs. Rousseff in 2010, indicating a political persistence.21 There can be at least two non-excluding reasons for this persistence. Voters may prefer not to change the party they support; there might be persistent factors that result on voters supporting Mr. Lula in 2006 and Mrs. Rousseff in 2010.
The possibility of incorporating the distribution of demographic variables on the aggregate municipal information is the reason we used the Mixed Logit model. The first
19 See Nevo (2000) for further explanation.
20 (ln) of municipalities’ GDP was also used as an economic variable, but the impact was also not statistically
significant. The idea of using this variable is to measure the level of the local economy, instead of its growth.
21 Governor Coalition – a dummy if the incumbent governor belongs to Mrs. Rousseff’s coalition – was also
28
impact we analyze is how labor income affects the electoral impact an individual has on the
Bolsa Família Coverage. The negative sign of labor income coefficient on Bolsa Família
Coverage indicates that although larger shares of beneficiary families in the program increase probability of voting for candidate Rousseff (as shown by the positive sign of the direct coverage coefficient), this increase in probability decreases with labor income and might even become negative for high labor income values. This result indicates, as could be expected, that Bolsa Família program has a larger political effect on individuals with lower income.
A positive (negative) coefficient sign of labor income impact on economic variables would indicate that individuals with higher wages would let their political decisions be more (less) affected by municipality economic growth. The statistical insignificance of the interaction, however, indicates that even individuals with higher labor income doesn’t consider the status of municipal economy on national electoral decisions. This doesn’t mean labor income has no impact on electoral decision. The direct impact of the demographic variables on the dependent variable – Mrs. Rousseff’s share – is displayed as the interaction between the demographic variable and the constant. The positive value of labor income coefficient on the specifications where the value is statistically significant, indicates that, on average, individuals with higher labor income are more likely to vote on Mrs. Rousseff. This result is rather unexpected considering Figure 1, which shows that president Rousseff’s performance was better on poorer regions, but indicates that, when controlled for other demographic variables, individual labor income has a positive impact on Mrs. Rousseff’s share. A possible interpretation for this result is to understand individual labor income as a proxy for individual economic satisfaction, which would lead to a better evaluation of the incumbent president.
Even more surprising is the statistical insignificance of the dummy that indicates if the individual household is a beneficiary of the Bolsa Família program. In none of the BLP specifications, receiving Bolsa Família impacts directly the probability of an individual voting for Mrs. Rousseff, although the municipality coverage does affect, as shown. One possible explanation could be that the municipal variable, Bolsa Família Coverage, is capturing the individual effect due to correlation of both variables. However, the inclusion of the specification BLP-1, where the municipal coverage was not included was specifically to show that this is not the case. As said before, Bolsa Família program has two mechanism thought which it could affect electoral decisions, the approval of the redistributive program of the government and the direct income effect. What can be inferred is that the redistributive characteristic of the Bolsa Família program is correlated by the municipal coverage, while
29
having a beneficiary in the family is correlated with the income gains. The statistical insignificance of the later and the significance of the municipal coverage suggests that the redistributive effect of the program is more correlated with the decision of voting for Mrs. Rousseff than the direct income effect.
The last four demographic variables included in the specifications are control dummies for urban, literacy, gender and race. Only the dummy for living in an urban area is statistically significant in any specification, but while it has a negative sign in BLP-3, it has a positive sign in the specification where neither instruments nor Bolsa Família Coverage were used – BLP-1. The statistical insignificance of the gender dummy indicates that, although Mrs. Rousseff was the first female candidate to reach the second round in the history of Brazilian presidential elections, her endorsement from female electors was not higher than her endorsement from male electors. This goes in line with surveys from Ibope and Datafolha, the two majors’ political surveys in Brazil that showed that, in the last survey before the elections, Mrs. Rousseff’s share was even higher among male voters than among the female electorate.22 The statistical insignificance of the coefficients of literacy and race indicates that the probability of voting for Mrs. Rousseff in the second round of 2010 elections is not influenced by neither race nor ability to read.
For the next exercises – comparison with linear models, counterfactual exercises, and marginal effects analysis – we pick a single specification to make comparison simper. We selected specification BLP-3 as it outstands in three desirable criterions: number of statistical significant variables, inclusion of Bolsa Família Coverage and the use of the coverage target as an instrument.
22 Source: Ibope public opinion research of 30/10/2010 and Datafolha public opinion research of
30
Table 4 - Coefficients estimated – Mixed Logit
BLP BLP BLP BLP BLP BLP BLP BLP BLP
(1) (2) (3) (4) (5) (6) (7) (8) (9)
Instrument used: Target Eligibility Target Target Target Target Eligibility
Bolsa Família Coverage 3.68*** 3.25*** 4.60* 2.64* 3.15* 3.01 3.96 4.80 (0.46) (0.92) (2.39) (1.46) (1.62) (2.16) (8.84) (13.12) GDP growth - 2 years 0.47** -0.98 0.11 -0.08 0.15 0.79 0.70 0.05 -0.12 (0.2) (0.7) (0.51) (0.95) (0.61) (1.4) (1.78) (1.27) (4.82) Lula's share 2006 5.25*** -0.08 3.52*** 3.91*** 3.71*** 4.44*** 4.38*** 3.77*** 3.85** (0.22) (0.33) (0.69) (1.22) (0.5) (0.5) (0.76) (1.27) (1.58) Constant -3.16 -1.29*** -4.26*** -4.94 -3.79** -5.39** -4.94 -4.93 -5.20 (0.29) (0.44) (1) (3.29) (1.72) (2.72) (3.31) (13.87) (15.44) Bolsa Família Coverage Labor income (ln) 21.35 -0.98*** -1.54* -0.83** -1.10** -1.09* -1.25 -1.52 (26.95) (0.29) (0.82) (0.36) (0.47) (0.62) (2.03) (2.76) Standard Deviation 0.00 0.00 0.00 0.01 0.00 0.00 0.00 0.00 (31.7) (53.77) (27.01) (76.65) (67.77) (101.66) (120.75) (156.37) GDP growth - 2 years Labor income (ln) -0.14* 0.15 0.04 0.12 0.01 -0.19 -0.16 0.06 0.14 (0.08) (0.16) (0.22) (0.32) (0.26) (0.38) (0.54) (0.51) (1.54) Standard Deviation 0.00 0.01 0.02 0.02 0.01 0.00 0.00 0.00 0.01 (10.84) (36.61) (14.08) (21.84) (23.89) (12.92) (20.23) (50.65) (112.05) Lula's share 2006 Deviation Standard 0.00 0.01 0.00 0.00 0.00 0.01 0.01 0.00 0.00 (9.99) (24.61) (47.17) (31.61) (68.98) (19.63) (30.33) (67.41) (80.17) Constant Labor income (ln) 0.51*** -10.72 0.45 0.52 0.42 0.78* 0.79 0.51 0.45 (0.07) (12.18) (0.3) (0.55) (0.29) (0.41) (0.54) (0.41) (1.73) Bolsa Família beneficiary 0.79 -0.22 0.72 2.15 0.35 3.95 3.45 1.63 1.81 (0.65) (0.2) (1.98) (2.69) (1.31) (5.69) (5.57) (2) (4.95) Urban -1.59*** 0.24 0.85** 1.13 1.16 1.19 (0.18) (0.68) (0.41) (1.18) (1.17) (1.95) Literate 0.36 0.03 0.08 (1.73) (14.72) (20.89) Man 0.35 0.29 0.33 (7.42) (11.29) (12.55) White -0.32 -0.06 0.23 (1.15) (0.63) (1.45) Standard Deviation 0.00 0.00 0.00 0.01 0.00 0.00 0.00 0.00 0.00 (13.88) (30.14) (22.32) (25.66) (18.97) (35.32) (39.18) (79.68) (79.03)
This table presents the coefficients estimated with the Mixed logit model. Standard Deviation indicates the unobservable demographic impact. Bellow the constant are depicted the demographic variable’s impact on the indicated municipal variable, which represents the cross effect of individual characteristics on municipal data. The first value is the β and bellow the standard error. * p-value<0.05, ** p-value <0.01, *** p-value <0.001.
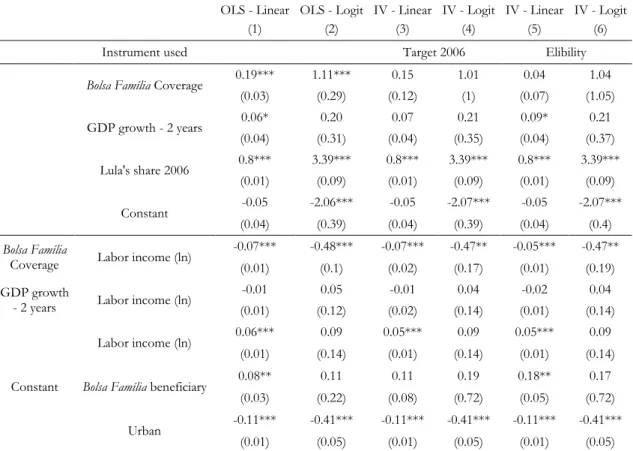
Table 5 shows the equivalent regressions of specification BLP-3 using OLS and IV regressions. The demographic characteristics impact on municipal variables highlights the difference between the mixed logit methodology and the OLS and IV estimations. While the coefficients in the BLP specifications were estimated using the distribution of the demographic variable in each municipality, in the OLS and IV estimations the municipality
31
average was used and the interaction is simply the product of the variables. Therefore the effect of labor income on Bolsa Família Coverage’ election impact is simply the product of these two variables.
The direct impact of municipalities’ variables is similar to the results using mixed logit model. Bolsa Família Coverage and president Lula’s 2006 share have a positive impact on the probability of voting for Mrs. Rousseff, while GDP municipal growth is statistically insignificant.
The most important difference between the aggregate models and mixed logits’ coefficients is the statistical significance of the Bolsa Família beneficiary dummy in two of the specifications – OLS and IV in the linear forms, with the IV estimation using percentage of eligible families as an instrument. In both of this specifications the coefficient is positive, indicating that individuals who belong to a family that receives financial aid from the Bolsa
Família program are more likely to vote on Mrs. Rousseff.
The remaining variables’ estimation present similar results as the regressions using mixed logit models. The positive effect of Bolsa Família Coverage is decreasing with labor income, as indicated by the negative coefficients in every specification. The effect of labor income on the probability of supporting Mrs. Rousseff is positive in the specifications in which it is significant – the specifications with linear dependent variable – and has no statistical significant impact through GDP growth. The dummy for living in an urban area is negative significant in the aggregate models estimations. This result goes in line with Figure 1, which shows Mrs. Rousseff had more votes in northern regions of Brazil that predominantly rural.
32
Table 5 - Coefficients Estimated - Aggregate Models
OLS - Linear OLS - Logit IV - Linear IV - Logit IV - Linear IV - Logit
(1) (2) (3) (4) (5) (6)
Instrument used Target 2006 Elibility
Bolsa Família Coverage 0.19*** 1.11*** 0.15 1.01 0.04 1.04
(0.03) (0.29) (0.12) (1) (0.07) (1.05) GDP growth - 2 years 0.06* 0.20 0.07 0.21 0.09* 0.21 (0.04) (0.31) (0.04) (0.35) (0.04) (0.37) Lula's share 2006 0.8*** 3.39*** 0.8*** 3.39*** 0.8*** 3.39*** (0.01) (0.09) (0.01) (0.09) (0.01) (0.09) Constant -0.05 -2.06*** -0.05 -2.07*** -0.05 -2.07*** (0.04) (0.39) (0.04) (0.39) (0.04) (0.4) Bolsa Família
Coverage Labor income (ln)
-0.07*** -0.48*** -0.07*** -0.47** -0.05*** -0.47**
(0.01) (0.1) (0.02) (0.17) (0.01) (0.19)
GDP growth
- 2 years Labor income (ln)
-0.01 0.05 -0.01 0.04 -0.02 0.04
(0.01) (0.12) (0.02) (0.14) (0.01) (0.14)
Constant
Labor income (ln) 0.06*** 0.09 0.05*** 0.09 0.05*** 0.09
(0.01) (0.14) (0.01) (0.14) (0.01) (0.14)
Bolsa Família beneficiary 0.08** 0.11 0.11 0.19 0.18** 0.17
(0.03) (0.22) (0.08) (0.72) (0.05) (0.72)
Urban -0.11*** -0.41*** -0.11*** -0.41*** -0.11*** -0.41***
(0.01) (0.05) (0.01) (0.05) (0.01) (0.05)
This table presents the coefficients estimated with the aggregate models. Bellow the constant are depicted the cross effect of municipal and individual characteristics. Unlike the mixed logit model, the individual characteristics in the aggregate model are given by municipal averages of Census observations. Dependent variable is 𝑠 for linear models – columns (1), (3) and (5) – and 𝑠
(1−𝑠) for logit models – columns (2), (4) and (6). The first value is the β and bellow the robust standard
error. * p-value<0.05, ** p-value <0.01, *** p-value <0.001.
4.2. Counterfactual
Due to the limitation of the analysis of the coefficients in the BLP estimations, the electoral effect of the Bolsa Família program is best understood by the counterfactual exercise in which we estimate the voting shares in a scenario without Bolsa Família. To do so, we simply apply the coefficients of the complete estimation on equation 8 and set both the municipal Bolsa Família coverage (𝐵𝑡) and the individual dummy for being a beneficiary of
the program (vector of 𝐷𝑡) to zero. All the estimations use the specification BLP-3. It is
important to remember that the mixed logit model allows for individuals who are not beneficiary of the Bolsa Família to have their electoral preferences affected by the program. Thus, the shut down of the program does not affect only the beneficiaries, but all voters.
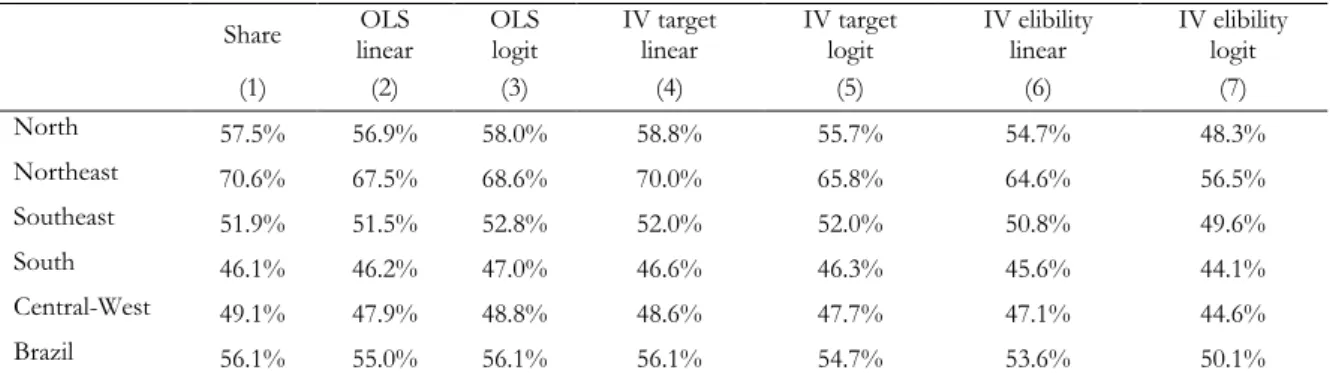
Table 6 presents the voting shares Mrs. Rousseff had on the runoff voting of the 2010 elections and the counterfactual estimated shares for each Brazilian region and for the
33
whole country.23 The exercise shows that the impact of the Bolsa Família program is equivalent of 6.30% of the total valid votes. More important, the estimation of Mrs. Rousseff’ share indicates she could lose the election by a very small margin. Naturally, the error margins of the estimations and the result so close to 50% don’t allow us to conclude whether she would win the election or not, but the possibility already indicates a significant electoral impact.
The results depicted also indicate a clear heterogeneity of the impact among Brazilian regions. In the Northeast region, the poorest and where the Bolsa Família coverage is larger.24 The decrease is so significant that would lead the region in which Mrs. Rousseff had over 70% of the valid votes to be even behind the Brazilian average. In the South and Central-West regions, removing counterfactually the Bolsa Família program would lead to an increase in votes for Mrs. Rousseff. This is due to the small number of beneficiaries in these regions – individuals to whom removing Bolsa Família decreases probability to vote on Mrs. Rousseff –and the fact that these regions have higher average labor income25 – hence removing the program has a positive effect.
Table 6 - Counterfactual Shares by Brazilian region – Bolsa Família effect
Observed Share Counterfactual Share Difference
(1) (2) (1) - (2) North 57.47% 45.42% 12.05% Northeast 70.58% 49.15% 21.43% Southeast 51.88% 51.53% 0.35% South 46.11% 47.94% -1.84% Central-West 49.09% 49.63% -0.55% Brazil 56.07% 49.77% 6.30%
This table presents the counterfactual exercise in which we estimate, using the coefficients of regression BLP-3, the incumbent electoral share in a scenario without Bolsa Família program. Which means both Bolsa Família coverage and dummy for having a beneficiary in the family set to zero.
This positive impact of removing the program in richer regions is in line with Corrêa (2015) and Corrêa and Cheibub (2016), who find evidence supporting that the positive electoral effect conditional cash transfer programs is partially counter balanced by a negative impact of voters who don’t approve the program, leading to an inconclusive impact.
In the Bolsa Família, specifically, Corrêa (2015) concludes that the overall impact in the 2006 Lula election is null and the program only reallocates the electorate. Our results, on the other hand, indicate that the positive effect is much larger than the negative one.
23 Table 9, in the annex, presents the counterfactual estimations by Brazilian state. 24 As shown in Figure 1.