ENVIRONMENTAL DATA MANAGEMENT IN THE SADO ESTUARY:
WEIGHT OF EVIDENCE TO ASSESS SEDIMENT QUALITY
Sandra Sofia Ferreira da Silva Caeiro
Legal Deposit nº 1 ISBN: 972-9119-29-5
Faculdade de Ciências e Tecnologia da Universidade Nova de Lisboa Campus da Caparica
ENVIRONMENTAL DATA MANAGEMENT IN THE SADO ESTUARY:
WEIGHT OF EVIDENCE TO ASSESS SEDIMENT QUALITY
Thesis submitted to the Universidade Nova de Lisboa, Faculdade de Ciências e Tecnologia for the degree of Doctor of Philosophy in Environmental Engineering
Lisbon
Author’s declaration
The author states that she afforded a major contribution to the conceptual design and technical execution of the work, interpretation of the results and manuscript preparation of the published articles included in this dissertation, according to the nº 2 of art. 8º do Decreto –Lei 388/70.
He uses statistics as a drunken man uses lamp-posts... for support rather
than illumination.
Andrew Lang (1844-1912) poet and novelist.
To my life companion
… O! learn to read what silent love hath writ:
To hear with eyes belongs to love's fine wit.
This multidisciplinary work would have not been possible without the help and involvement of a large number of people to whom I wish to express my sincere gratitude:
Prof. Maria Helena Costa and Prof. Marco Painho my dissertation adviser and co-adviser. To them I want to express my deepest gratitude. Their unlimited contribution to this study can hardly be described. Their involvement was felt at all levels, from the scientific discussions and support, most demanding programmatic and logistics requests until the friendship and emotional support at any day or hour of the week. I’m also thankful for their effort and determination in obtaining funding for this research. It was possible to have not only one but two great supervisors that always in a remarkable way respect the opinions of each other. I shall never forget this joyful experience for all my life.
Prof. Pierre Goovaerts for the opportunity to work with him at University of Michigan and for my fruitful experience as a geostatistics beginner at Ann Arbor and for his continuous help although from a distance. I am also deeply thankful for his promptness and support in helping with my doubts and mistakes and for the revision of a large number of chapters of this dissertation.
Prof. Ángel DelValls from University of Cadiz for his scientific support and advises in the sediment quality assessment and for his promptness to clarify my doubts. I’m also grateful to him for giving me the opportunity to meat and discuss with Douctor Peter Chapman some issues about the sediment quality assessment.
My colleague and great friend Prof. Luis Nunes from University of Algarve I’m grateful for giving me the opportunity to collaborate with him in the optimization procedures for sampling design. I’m also thankful for his optimization algorithm development, his help in the fieldwork, clarification and discussions about many statistical doubts and final readings and comments of this thesis.
Prof. Robert Gilmore Pontius, Jr. from Clark University for is discussion and help in map similarly measurements and results evaluation.
Prof. Margarida Gonçalves, Dr. Luz Fernandes from the Chemistry
Department/Environmental Biotechnology Unit (FCT/UNL) and Eng. Alice Mosca and Dr. Paula Coimbra from the Controlab for their effort in finishing the analysis of metals and organochlorine pesticides on time.
opportunity to visit several offices and laboratories of USEPA and meet research groups involved in coastal zone management.
To Eng. Celso Gomes president of Sado Estuary Natural Reserve for the boat support in sampling campaigns. To Mr. Jorge Pina and Mr. Carlos I’m deeply indebted for their support in the hard sampling work. Without them this work would have not been possible. To my colleague Tiago Repolho for all his great support in the fieldwork and toxicity bioassays. I’m grateful for his constant good mood even in hard moments, great ability for setting laboratory bioassays, gently way to take care of the organism cultures and patience for sea urchin larvae observations! To my colleague Inês Mourão for all her great support in the collection and data treatment of the Sado Estuary social and economic pressures. To all my colleagues from MARES team (FCT/UNL) namely Sandra Fernandes, Teresa Neuparth, Filipe Costa, Mário Diniz, Sofia Figueiredo, and Ana Correia for their laboratory and field support, company and friendship.
My colleague Sandra Sousa from ISEGI for all her great support in the GIS, spatial analysis and GPS fieldwork. I’m thankful for her good working determination, on the basis of “you asked I will do it” or “I don’t know how but I will find a way”. I’m also deeply grateful to my colleague Pedro Cabral from ISEGI for all his assistance in my GIS questions, and for all he taught me about Arview 3.2 and ArcGis 8.0 software’s. To all the colleagues of New Technologies Laboratory of ISEGI for their support, in particular to Margarida Gaia for her assistance with figures design, Ricardo Sena for the development of GIS applications and Jan Deepen for his help in fieldwork.
Eng. Ernesto Carneiro and Eng. Graça Viegas from Port Administration of Setúbal and Sesimbra (APSS) for their help in making data available and for their practical and technical knowledge of Sado Estuary. To Mr. Sérgio Cruz for his support in data availability.
Prof. Ana Rodrigues from University of Aveiro for making her benthos data available and for her explanations. Also from the same institution Prof. Vitor Quintino for lending the chamber for the counting of sea urchin embryos and also Eng. Ana Ré for her prompt help in the sea urchin larvae toxicity bioassay preparation and calculation of the results.
Dr. João Pais and Mrs Eduarda from the Department of Natural Sciences (FCT/UNL) for allowing me to use the laboratory and the sediment sieving equipment.
Estuary.
Prof. Carlos Vale from IPIMAR for making available the Van Veen grab.
Instituto Geográfico Português for geographical data availability and to Instituto Hidrográfico for tidal data availability.
My colleagues Ute Mueller and Hirotaka Saito during my short stay in University of Michigan for their support.
My colleagues from Universidade Aberta, in particular to Prof. Carla Oliveira, Prof. Cristina Carapeto and Prof. Ulisses Azeiteiro for their support during my absence at the University. In particular to Prof. Cristina Carapeto I’m also thankful for her careful reading of this thesis.
PRODEP Program grant of three years, “Fundação Luso-Americana para o Desenvolvimento” (FLAD) for a two month grant to undertake a training Program in University of Michigan and USEPA and “Fundação Caloust Gulbenkian” for short grants to participate in congresses.
My friends Maria José Amaral and Ana Paula Martinho for their friendship and support in the fieldwork.
My sister in law Ana Gassmann-Ramos for her friendship, support and careful reading of the Portuguese short and long abstracts.
Estuaries are perhaps the most threatened environments in the coastal fringe; the coincidence of high natural value and attractiveness for human use has led to conflicts between conservation and development. These conflicts occur in the Sado Estuary since its location is near the industrialised zone of Peninsula of Setúbal and at the same time, a great part of the Estuary is classified as a Natural Reserve due to its high biodiversity. These facts led us to the need of implementing a model of environmental management and quality assessment, based on methodologies that enable the assessment of the Sado Estuary quality and evaluation of the human pressures in the estuary. These methodologies are based on indicators that can better depict the state of the environment and not necessarily all that could be measured or analysed. Sediments have always been considered as an important temporary source of some compounds or a sink for other type of materials or an interface where a great diversity of biogeochemical transformations occur. For all this they are of great importance in the formulation of coastal management system. Many authors have been using sediments to monitor aquatic contamination, showing great advantages when compared to the sampling of the traditional water column.
The main objective of this thesis was to develop an estuary environmental management framework applied to Sado Estuary using the DPSIR Model (EMMSado), including data collection, data processing and data analysis. The support infrastructure of EMMSado were a set of spatially contiguous and homogeneous regions of sediment structure (management units). The environmental quality of the estuary was assessed through the sediment quality assessment and integrated in a preliminary stage with the human pressure for development. Besides the earlier explained advantages, studying the quality of the estuary mainly based on the indicators and indexes of the sediment compartment also turns this methodology easier, faster and human and financial resource saving. These are essential factors to an efficient environmental management of coastal areas. Data management, visualization, processing and analysis was obtained through the combined use of indicators and indices, sampling optimization techniques, Geographical Information Systems, remote sensing, statistics for spatial data, Global Positioning Systems and best expert judgments.
also accumulate the contamination coming from Águas de Moura Channel, since particles coming from that channel can settle down in that area due to residual flow. In these areas the contaminants of concern, from those analyzed, are the heavy metals and metalloids (Cd, Cu, Zn and As exceeded the PEL guidelines) and the pesticides BHC isomers, heptachlor, isodrin, DDT and metabolits, endosulfan and endrin. In the remain management units (76 % of the study area) there is a moderate impact potential of occurrence of adverse ecological effects and in some of these areas no stress agents could be identified. This emphasizes the need for further research, since unmeasured chemicals may be causing or contributing to these adverse effects. Special attention must be taken to the units with moderate impact potential of occurrence of adverse ecological effects, located inside the natural reserve. Non-point source pollution coming from agriculture and aquaculture activities also seem to contribute with important pollution load into the estuary entering from Águas de Moura Channel. This pressure is expressed in a moderate impact potential for ecological risk existent in the areas near the entrance of this Channel. Pressures may also came from Alcácer Channel although they were not quantified in this study.
As zonas costeiras e, em particular, os estuários, como é o caso de Estuário do Sado, devido à sua localização em uma transição entre o meio terrestre e meio marinho, estão sujeitas a inúmeros problemas de contaminação e, ao mesmo tempo, encontram-se dependentes de conflitos de difícil gestão ambiental. Sendo áreas de especial susceptibilidade e importância como ecossistemas muito produtivos, torna-se necessário implementar modelos de avaliação e gestão, que passem pela elaboração de metodologias que não só qualifiquem como quantifiquem as principais fontes e a qualidade do ecossistema procedente dos seus diversos compartimentos: coluna de água, sedimento e biota. Estas metodologias de gestão ambiental podem basear-se na utilização de indicadores e índices, isto é, podem ter acesso à utilização de variáveis ambientais que melhor espelhem os objectivos em causa, e não à totalidade das possibilidades que possam ser medidas e/ou analisadas. Diversos autores têm usado os sedimentos para monitorizar a contaminação de sistemas aquáticos, demonstrando vantagens evidentes em relação à utilização de amostras de água, uma vez que as concentrações de contaminantes nos sedimentos são, em geral, significativamente superiores às concentrações na coluna de água.
Como conclusão global, das 19 unidades de gestão delineadas e analisadas, três não apresentam qualquer risco ecológico (o que corresponde a 18,5 % da área de estudo). As áreas de maior alerta, onde será imprescindível desenvolver processos de vigilância e medidas de gestão (5,6 % da área de estudo), estão localizadas no Canal Norte e sofrem uma elevada pressão das actividades humanas. Estas áreas apresentam um importante baixo hidrodinamismo, pelo que estão associadas, naturalmente, a elevados níveis de deposição sedimentar. Em particular, é de relevar as áreas adjacente às indústrias Lisnave e Eurominas que têm, além disso, a possibilidade de acumular também contaminação originária do Canal de Águas de Moura, uma vez que as partículas que provêm deste canal podem depositar-se nessa área, devido a correntes residuais. Nessas áreas, portanto, os poluentes mais inquietantes, provenientes da lista dos parâmetros analisados, são principalmente os seguintes: metais pesados e metalóides (o cádmio, o cobre, o zinco e o arsénio apresentaram valores superiores aos valores guia indicativos de efeitos tóxicos) e os pesticidas organoclorados BHC e isómeros, heptacloro, isodrina, DDT e metabólitos, endosulfão e endrina. Nas restantes unidades homogéneas (correspondentes a 76 % da área de estudo) existem sinais de efeitos biológicos adversos e, em algumas dessas áreas, ainda não foi possível delimitar nem identificar um agente que possa vir a originar aqueles prejudiciais danos. Estas circunstâncias dão ênfase à urgência imperativa de ampliação em maior número de investigações deste tipo, dado que contaminantes não medidos nem avaliados podem estar a ocasionar ou a contribuir para a propagação de consequências nefastas. Poluição difusa resultante de actividades agrícolas e de aquacultura parece apontar similarmente para procedências importantes de cargas de poluição no Estuário descendente do Canal de Águas de Moura. Esta pressão é expressa como um potencial de risco ecológico existente nas áreas localizadas à entrada daquele canal. Acrescente-se ainda a agravante de algumas daquelas unidades estarem incluídas, em parte ou na sua totalidade, na área protegida da Reserva Natural do Estuário do Sado. Do Canal de Alcácer podem similarmente surgir outros modos de pressões diversas que não foram, no entanto, ainda quantificados neste estudo.
APSS – Administration Port of Setúbal and Sesimbra BIbio– Benthic Biotope Index
BHC – Hexachlorocyclohexane or Benzene Hexanocloride BOD – Biological Oxygen Demand
BPJ – Best Professional Judjment COD – Chemical Oxygen Demand CZM – Coastal Zone Management DC – Degree of Contamination Index
DPSIR – Driving Forces, Pressure, State and Impact indicators framework Eh – Redox Potential
EMMSado – Environmental Information Management for Sado Estuary, through the sediment quality assessment
EU – European Union FA – Factor Analysis FF – Fine Fraction
FOG – Fat, Oil and Grease
GIS – Geographic Information System GPS – Global Positioning System
HO – High Organic load management unit I – Index of metals for Ratio-to-Reference
ICP-AES – Inductively Coupled Plasma Atomic Emission Spectroscopy ICZM – Integrated Coastal Zone Management
LO – Low Organic load management type LOE – Line of Evidence
MHO – Medium High Organic load management unit MO – Medium Organic load management unit
MPI – Metal Pollution Index
MSPI – Marine Sediment Pollution index N – Nitrogen
NI – Index of metals for new Maximum RTR Nut. – Nutrients
PCA – Principal Component Analysis PCB – Polychlorinated Biphenyls PEL – Probable Effect Level PIN – New Pollution Index PLI – Pollution Load Index
PSR – Pressure, State, Response indicator Framework RNES – Natural Reserve of Sado Estuary
RTR – Ratio-to Ratio approach of Sediment Quality Triad SA – Simulated Annealing
SDA –Stepwise Regression Discriminant Analysis SQG – Sediment Quality Guideline
SQG-Q – Sediment Quality Guideline Quotient SQT – Sediment Quality Triad
SQV – Sediment Quality Values SS – Suspended Solids (total) TBT – Tributyltin
TEL – Threshold Effect Level TOM – Total Organic Matter WOE – Weigh of Evidence
ACKNOWLEDGEMENTS ...vii
ABSTRACT ... xi
RESUMO ...xiii
ABREVIATIONS ... xv
PART I CHAPTER 1 – INTRODUCTION... 3
GENERAL INTRODUCTION ... 5
1.1 Coastal zone management: the importance of the data... 5
1.2 Data management: Indicators frameworks ... 7
1.3 Coastal management units ... 10
1.4 GIS and spatial analysis for coastal zones management... 11
1.5 Environmental monitoring and sampling designs... 13
1.6 Sediment as a estuarine environmental signal ... 13
1.7 Weight-of-Evidence and frameworks for sediment quality assessment ... 14
1.8 The need for an environmental data management in the Sado Estuary: Portugal... 19
1.9 Objectives of this study ... 22
1.10 Assumptions ... 23
1.11 General structure of this study ... 24
References ... 30
PART II CHAPTER 2 – SADO ESTUARY ENVIRONMENTAL MANAGMENT: A GIS APPROACH ... 41
Abstract... 43
2.1 Introduction ... 43
2.2 The study area... 45
References...57
PART III CHAPTER 3 – SPATIAL SAMPLING DESIGN FOR SEDIMENT QUALITY ASSESSMENT IN ESTUARIES...65
Abstract...67
3.1 Introduction...67
3.2 Spatial sampling designs...68
3.3 Study area ...71
3.4 Methods ...71
3.4.1 Coastal boundary digitization...71
3.4.2 Sampling design ...73
3.5 Results and discussion ...73
3.5.1 Coastal boundary digitization...73
3.5.2 Sampling strategy...74
3.6 Conclusions...76
References...77
CHAPTER 4 – DELINEATION OF ESTUARINE MANAGEMENT AREAS USING MULTIVARIATE GEOSTATISTICS: THE CASE OF SADO ESTUARY ...81
Abstract...83
4.1 Introduction...83
4.2 Materials and methods ...85
4.2.1 Study area...85
4.2.2 Sampling design ...85
4.2.3 Analytical procedures...85
4.2.4 Multivariate geostatistical analysis...86
4.3 Results and discussion ...91
4.4 Conclusions ……….…96
Abstract... 103
5.1 Introduction ... 103
5.2. Methods ... 106
5.2.1 Previous work ... 106
5.2.2 Single cell comparison ... 107
5.2.3 Hard neighborhood comparison... 108
5.2.4 Soft neighborhood comparison ... 108
5.3 Results and discussion ... 109
5.3.1 Single cell comparison ... 109
5.3.2 Hard neighborhood cell comparison ... 111
5.3.3 Soft neighborhood cell comparison ... 111
5.4 Conclusions ... 115
References ... 117
PART IV CHAPTER 6 – APPLICATION OF THE DPSIR MODEL TO THE SADO ESTUARY IN A GIS CONTEXT – SOCIAL AND ECONOMICAL PRESSURES ... 121
Abstract... 123
6.1 Introduction ... 123
6.2 Methodology... 125
6.2.1 Previous work ... 125
6.2.2 Driving forces and Pressures evaluation ... 126
6.3 Results and discussion ... 128
6.4 Conclusion ... 135
References ... 137
PART V CHAPTER 7 – OPTIMIZATION OF AN ESTUARINE MONITORING PROGRAM: SELECTING THE BEST SPATIAL DISTRIBUTION ... 143
Abstract... 145
7.3.1 Sediment homogenous areas delineation...147 7.3.2 Optimization model...149
7.4 Results and discussion ...152
7.5 Conclusions...155
References...156
CHAPTER 8 – ASSESSING SEDIMENT HEAVY METALS CONTAMINATION IN THE SADO ESTUARY: A INDEX ANALYSIS APPROACH...159
Abstract...161
8.1 Introduction...161
8.2 Methods ...168 8.2.1 Study area...168 8.2.2 Sampling design and analytical procedures ...168 8.2.3 Background enrichment per contaminant...169 8.2.4 Indices calculation...170
8.3 Results and discussion ...173 8.3.1 Background enrichment per contaminant...174 8.3.2 Contamination by management unit...176 8.3.3 Index comparison ...179
8.4 Conclusions...183
References...184
CHAPTER 9 – BENTHIC BIOTOPE INDEX DEVELOPMENT FOR SADO ESTUARY: PORTUGAL
...189
Abstract...191
9.1 Introduction...191
9.2 Methods ...195 9.2.1 Study area...195 9.2.2 Benthic biotopes of Sado Estuary ...195 9.2.3 Index development ...199
9.3 Results and discussion ...201 9.3.1 Index calculation and validation...201 9.3.2 Benthic biotopes prediction...204
9.4 Conclusions...209
Abstract... 221
10.1 Introduction ... 221
10.2 Methods ... 222 10.2.1 Previous work ... 222 10.2.2 Special constraints ... 223 10.2.3 Optimization model ... 225 10.2.4 Number of stations in the subset ... 226 10.2.5 Optimization algorithm ... 227 10.2.6 Cost analysis ... 227
10.3 Results and discussion ... 228 10.3.1 Number of stations in the subset ... 228 10.3.2 Optimization results ... 229
10.4 Conclusion………231
References ... 231
CHAPTER 11 – WEIGHT OF EVIDENCE TO ASSESS SEDIMENT QUALITY IN MANAGEMENT
UNITS: APPLICATION TO THE SADO ESTUARY PORTUGAL ... 233
Abstract... 235
11.1 Introduction ... 236
11.2 Methods ... 238 11.2.1 Study area ... 238 11.2.2 Sediment sampling... 239 11.2.3 Sediment chemistry... 240 11.2.4 Sediment benthos structure ... 241 11.2.5 Sediment toxicity testing... 241 11.2.6 Data analysis ... 242
11.3 Results and discussion ... 244
11.4 Conclusions ... 257
CHAPTER 12 – GLOBAL CONCLUSIONS...269
CONCLUSIONS ...271
References...279
ANNEXES
ANNEX I – ENVIRONMENTAL INDICATOR FRAMEWORKS TO DESIGN AND ASSESS
ENVIRONMENTAL MONITORING PROGRAMS……….……….281
ANNEX II – INTEGRATION OF NUMERICAL MODELS IN GEOGRAPHIC DATABASES: THE
CASE OF THE SADO ESTUARY MANAGEMENT……….………311
ANNEX III – SPATIAL SAMPLING DESIGN FOR MAPPING ESTUARINE MANAGEMENT AREAS: SUPPORT INFORMATION……….………323
ANNEX IV – DELINEATION OF ESTUARINE MANAGEMENT AREAS USING MULTIVARIATE
GEOSTATISTICS: SUPPORT INFORMATION …….………329
ANNEX V – MAP SIMILARITY MEASUREMENT AND IT’S APPLICATION TO THE SADO
ESTUARY: SUPPORT INFORMATION …….…...…..…….………341
ANNEX VI –APPLICATION OF THE DPSIR MODEL TO THE SADO ESTUARY IN A GIS CONTEXT – SOCIAL AND ECONOMICAL PRESSURE: SUPPORT INFORMATION…….…..……365
ANNEX VII – ASSESSING SEDIMENT HEAVY METALS CONTAMINATION IN THE SADO
ESTUARY: SUPPORT INFORMATION …….………..371
ANNEX VIII – BIOTOPE INDEX DEVELOPMENT FOR THE SADO ESTUARY, PORTUGAL:
SUPPORT INFORMATION…….………377
ANNEX IX – WEIGHT OF EVIDENCE TO ASSESS SEDIMENT QUALITY IN MANAGEMENT
UNITS. APPLICATION TO THE SADO ESTUARY, PORTUGAL: SUPPORT
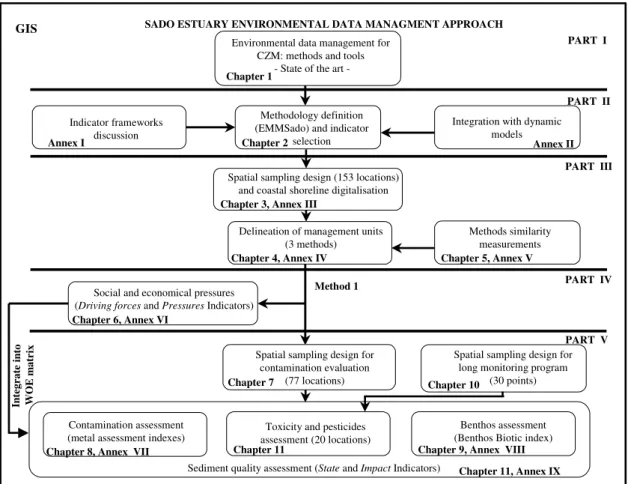
Figure 1.1 – Outline of the dissertation’s structure. ... 24
Figure 2.1 – DPSIR Model applied to the Sado Estuary.... 47
Figure. 2.2 – Methodology for the Sado Estuary environmental management framework.... 54
Figure. 2.3 – Sado Estuary management units within digitised coastal line.... 55
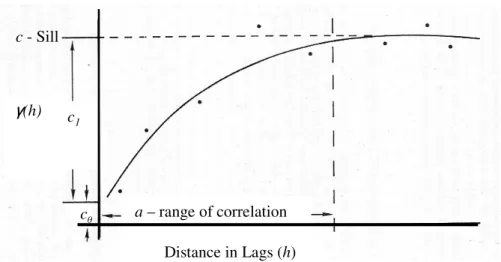
Figure 3.1 – A typical semi-variogram and fitted model.... 70
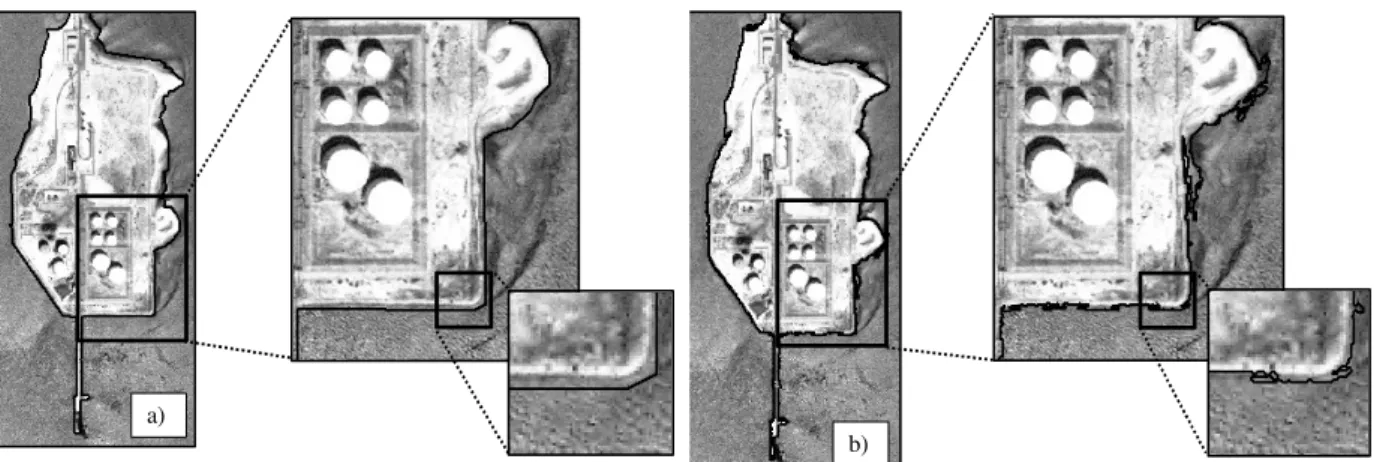
Figure 3.2 – Comparison between a) manual image classification and b) digital image classification.72
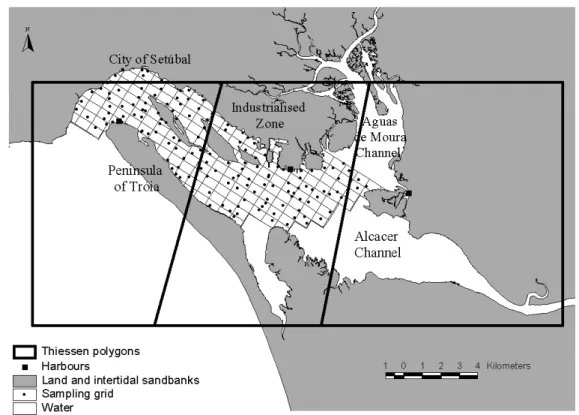
Figure 3.3 – Sado Estuary sediment sampling design within digitized boundary of the estuary.... 74
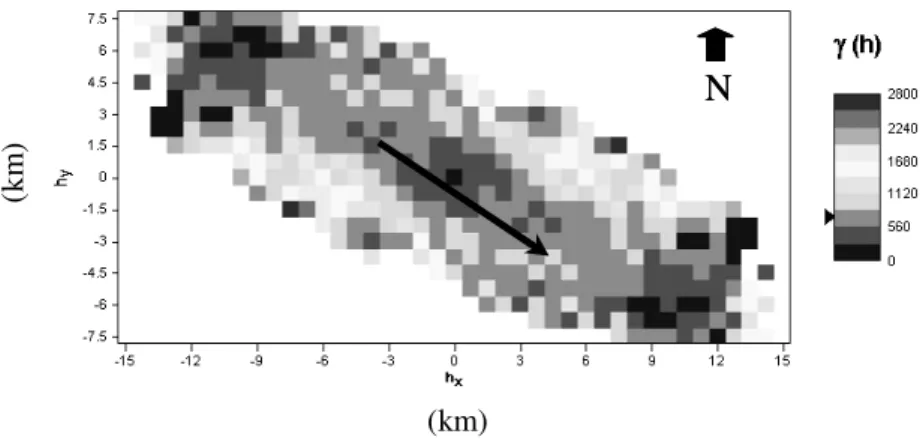
Figure 3.4 – Semivariogram map for fine fraction contents to detect anisotropy.... 75
Figure 3.5 – Semivariograms for fine fraction percentages in the direction of maximum continuity (a) and in the perpendicular direction (b), with the spherical model fitted.... 75
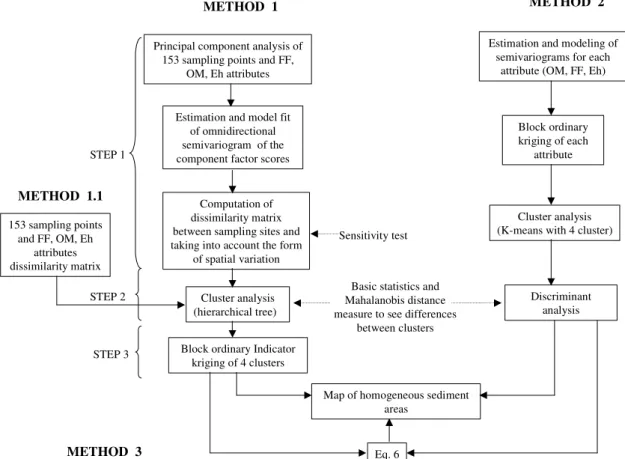
Figure 4.1 – Flowchart of the three methodologies used to delineate homogenous sediment areas.... 86
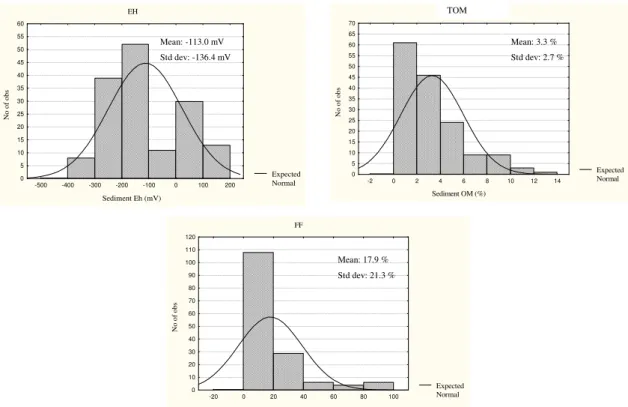
Figure 4.2 – Histograms and expected normal distributions of sediment redox potential, organic matter and fine fraction.... 92
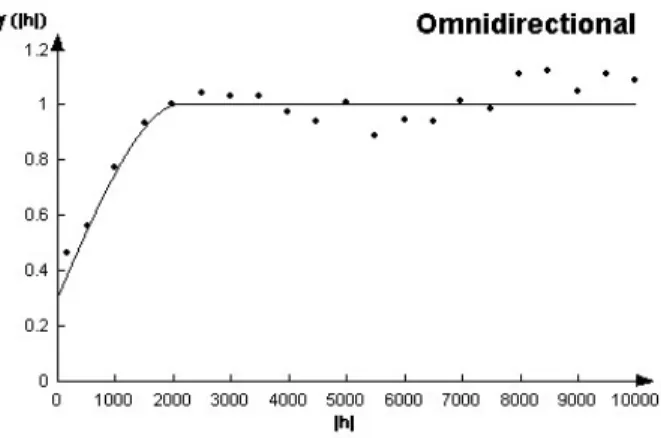
Figure 4.3 – Experimental semivariogram of the first principal component with the spherical model fitted. c0 = 0.31; a = 2159 meters and c= 0.7.... 93
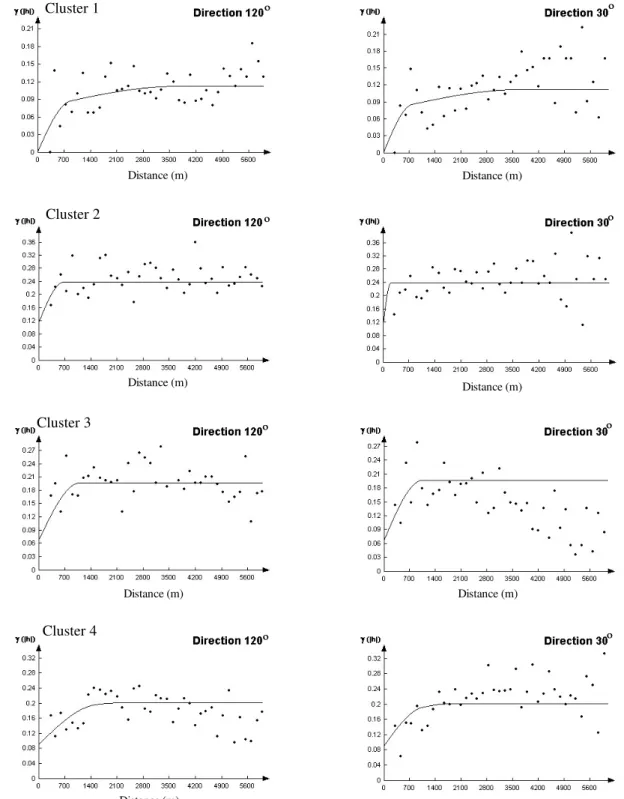
Figure 4.4 – Experimental directional semivariograms of cluster data, with the model fitted for 120º, the major direction of anisotropy, and the perpendicular direction, 30º.... 95
Figure 4.5 – Homogenous management units for Sado Estuary generated by methods 1 to 3. ... 96
Figure 4.6 – Experimental directional semivariograms and model fitted in the major and minor directions of anisotropy for the three attributes.... 97
Figure 5.1 – Study area in Sado Estuary.... 106
Figure 5.2 – Maps representing the 3 methods for Sado estuary management area delineation.... 107
Figure 5.3 – Approaches used for map comparison.... 109
Figure 5.6 – a) Cumulative percent of agreement at fine resolution and b) classification versus resolution for the agreement, between Maps ofmethod 1 and 3....113
Figure 5.7 – a) Cumulative percent of agreement at fine resolution and b) classification versus resolution for the agreement, between Maps ofmethod 2 and 3....114
Figure 5.8 – a) Kstandard and b) Klocation for the different resolutions, calculated using fuzzy classification....114
Figure 6.1 – Methodology for estuary environmental management tool. An example of an indicator for each DPSIR category is given....125
Figure 6.2 –Sado watershed....128
Figure 6.3 – Urban, agriculture and industrial indicators in the Setúbal sub-watershed. In industrial effluents are included industrial, storm water and/or domestic wastewater. In domestic effluents are included domestic and/or storm water. Average traffic of ships, from 1999 to 2003, in the main commercial harbours and average traffic of fishing ships, from 1998 to 2002, in the fishing docks. Population density of 2002 year....129
Figure 6.4 – Main pollutant types in each effluent discharge into the Sado Estuary....130
Figure 6.5 – Loads of BOD, N, P and SS from point and non-point sources in the Setúbal sub-watershed....131
Figure 6.6 – Groups of Salt-pans/aquacultures and their areas in the Sado Estuary....132
Figure 6.7 – Traffic of ships in the main harbours from 1999 to 2003. Eurominas and Auto-Europa correspond to data for more than one harbour that for simplification reasons was joined....133
Figure 6.8 – Fish fresh-weight caught and number of fishing boats from 1998-2003 (average of the 3 docks)....134
Figure 6.9 –Most important commercial fish species a) estuarine and b) marine) captured in the Sado Estuary and their fresh weight discharged in the period from 1998 to 2002. These values correspond to the average value of the species discharged in the three fishing docks....135
Figure 7.1 – Sado Estuary sediment sampling design (Adapted from Caeiro et al., 2002a)....148
Figure 7.3 – Estimation error variance and cost versus number of monitoring stations.... 154
Figure 7.4 – Monitoring networks a) for ω value = 60 stations; b) with 60 optimal stations and
additional expertise criteria (17).... 155
Figure 8.1 – Location of the sampling points in Sado Estuary and the management units. These areas are divided in four groups according to their organic load.... 169
Figure 8.2 – Background enrichment of each heavy metal using robust regression. Lines represent PEL or TEL when concentration values were lower, for each metal. Examples of outliners are shown in circles.... 175
Figure 8.3 – Spatial distribution of the metals in Sado Estuary. Classification according to DR (1995).
... 177
Figure 8.4 – Results of the indices to assess coontamination in the sampling points and management units in the Sado Estuary.... 178
Figure 9.1 – Location map of 131 sampling locations and benthic communities in Sado Estuary. Data from (Rodrigues, 1992).... 198
Figure 9.2 – Maps of the values of the index Bibio at sampled locations and averaged within
management unit in the Sado Estuary.... 206
Figure 9.3 – Spatial distribution of the Bibio in Sado Estuary.... 206
Figure 9.4 – Spatial distribution of sediment fine fraction (< 63 µm) in Sado Estuary.... 207
Figure 9.5 – Frequency distributions of the community types found in 1986 and the ones predicted in 2000/01.... 208
Figure 10.1 – Sado Estuary sediment sampling design overlaid on the sediment management units.223
Figure 10.2 – Cost versus number of monitoring stations.... 229
Figure 10.3 – 30 stations monitoring network without additional constraints.... 230
Figure 10.4 – Final monitoring network and scores of the ecological risk index.... 230
Figure 11.1 – Nineteen Management units of Sado Estuary and Natural reserve boundary.... 239
Figure 11.3 – Factor score estimated from FA for each management unit....251
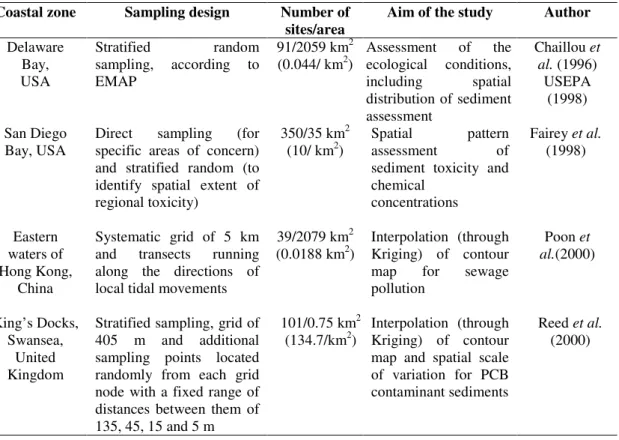
Table 3.1 – Examples of spatial sampling designs in coastal sediment studies.... 77
Table 4.1 – Statistics regarding the number and area of patches produced by the four classification approaches. LO – Low Organic load; MO – Medium Organic load; MHO – Medium High Organic load; HO – High Organic load; Und- Undefined.... 93
Table 5.1 – Kstandard and Klocation for the different resolutions and according to hard and soft classification (maximum similarity = 1).... 110
Table 6.1 – Selected indicators, unit, GIS representation and source of information.... 127
Table 7.1 – Physical and chemical parameters of each cluster and their frequency.... 153
Table 8.1 –Indices to assess contamination applied to estuarine environments.... 164
Table 8.2 – Index calculated in this study and guidelines used.... 171
Table 8.3 – Classification of dredge material in coastal zones according to DR, (1995).... 171
Table 8.4 – Spearman correlation between the indices, contaminants and sediment characteristics. All correlations are significant (p < 0.05).... 180
Table 8.5 – Score of the metal assessment indices, based on several criteria.... 182
Table 9.1- Literature review of macrozoobenthics indices applied to estuarine ecosystems.... 194
Table 9.2 – Summary statistics of the physical and chemical variables in each community type for Sado Estuary.... 196
Table 9.3 – Results of forward stepwise discriminant analyses conducted for combining the physical and chemical variables into the BIbio. The Wilk’s Lambda (0 perfect discrimination to 1 no discrimination), F statistics and their p values are given first for the overall model, then after elimination of the respective variable. The percentages of locations, which were correctly classified in the predictive and validation sub-sets, are also listed.... 202
Table 9.4 – Pearson correlations between the physical and chemical variables. Significant correlations (P< 0.05) marked with *.... 203
Table 9.5 – Classification functions of Model II for BIbio calculation.... 205
Table 11.1 – Ordinal ranking scheme applied for weight of evidence categorization....244
Table 11.2 – Factor loadings from FA analysis. Loading >0.4 in bold....247
PART I
GENERAL INTRODUCTION
1.1 COASTAL ZONE MANAGEMENT: THE IMPORTANCE OF THE DATA
Coastal zone management (CZM), also referred as Integrated Coastal Zone Management (ICZM), is an issue that has been largely discussed during the last decades. There are many ways in which the CZM process can be summarized, although as a general definition, CZM can represents a dynamic process which develops and implements a co-ordinated strategy to allocate resources to achieve the conservation and sustainable multiple use of coastal zone (French, 1997).
Coastal management has become the framework of choice in the major international pronouncements and agreements emanating from the United Nations Conference on Environment and Development (UNCED), held in Rio de Janeiro in June 1992 (Chapter 17 of Agenda 21) and underlies the Law of the Sea Convention which came into force in 1994 (Sherman and Duda, 1999). Also the Global Program of Action on Protection of the Marine Environment from Land-Based Activities has been adopted, the implementation of the Conventions on Biological Diversity and on Climate Change are proceeding successfully (Cicin-Sain and Knecht, 1998).
Numerous case studies of CZM practices have been applied in developed and developing countries. Clark (1996), French (1997), Cicin-Sain and Knecht (1998) and Salomons et al., (1999) presented, discussed and compared some of them.
Nevertheless coastal areas continue to experience intense and continuous environmental pressures from a range of driving forces that have been increasing in their intensity over many decades (Turner and Salomons, 1999; Kay and Alder, 2000). Little progress has been made in sustained global actions to reverse their degraded state (Sherman and Duda, 1999). Estuaries, as transitional river-marine environments, continue to be widely recognized as one of the most threatened components of the coastal environment, primarily because they are threatened from both land and sea based impacts (Cooper, 1994).
values (Moriki et al., 1996). Integrated planning for coastal areas, including land use, resources and pollution management, is needed to solve conflicts that occur frequently among residential, tourist, commercial, industrial, transportation, recreational, and agricultural activities competing within limited space. Coastal zone management role is to sort out the uses and recommend the optimal land use mix in other to advise the decision-makers and managers (Clark, 1996).
Governments are now committed to the policy goal of sustainable development. But the fulfilment of the sub-goal of sustainable utilization of coastal resources via integrated management is likely to prove to be an especially difficult task (Turner and Salomons, 1999). In may ways coastal zones typify the problems and policy challenges presented by the process of Global Environmental Change. These zones are under increasing pressure and are exhibiting unacceptable environmental state changes as a consequence of population growth, urbanization, tourism and other multiple and often conflicting resources usage trends. The mitigation of the resource conflict problems and the practical adaptation of the sustainable economic development policy objective requires innovative policy responses. It should be a process which enables policy makers to strike a socially acceptable balance between conflicting stakeholder resource demands as they manifest themselves in different economic, socio-political, institutional, cultural and environmental contexts (Turner and Bower, 1999). The coast is then a place where the issues of economic development and environmental management, and their interactions with social and cultural values are brought into a sharp relief (Kay and Alder, 2000) and that the costal zone management effectiveness is not an easy task (Cicin-Sain and Knecht, 1998) .
The coastal zones should be analysed in terms of two systems that should interact for a correct management of these resources (Van Der Weide and Vrees, 1999):
i) The natural system which provides space, substratum, renewable and non-renewable resources and which regulates physical, biological and chemical processes in the coastal zone. In economic terms the value of this system if often categorized as natural capital.
In addition coastal management does not have to be applied to a country’s entire coastal zone simultaneously. It can be implemented first where it is needed most – in those areas having urgent problems and needs (Cicin-Sain and Knecht, 1998).
CZM usually includes four stages (Clark, 1996):
1. Policy formulation - creation of a policy framework to establish goals and to authorize and guide the CZM;
2. Strategic planning - process that explores options and develops an optimum strategy for a management program;
3. Program development - starts after the policy makers accept the strategic planning; a detail master plan is created;
4. Implementation - starts once a master plan is approved and a budget and staff authorized.
Strategic planning is the key step in the process of organizing CZM and where the methods are determined. In this phase scientific information with a strong basis is needed to conduct coastal management, including both the natural and the social sciences (Cicin-Sain and Knecht, 1998). In fact one of the major objectives of coastal zone management is to identify the sources of adverse impacts including a vital first step to determine the present condition of the environment (Cooper, 1994). Without the steps of collecting, gathering, management and assessment of data, difficulties arise in implementing partnership and public participation for policy decision and management plan implementation.
1.2 DATA MANAGEMENT: INDICATORS FRAMEWORKS
There seems to be a gap between experimental work and decision-making, mainly because of the incompatibility of methods for the policy interpretation of scientific analysis. Environmental-ecological aspects appear only theoretically in the actual decision-making process; huge data bases, originated from physical and chemical monitoring of the marine environment, remain unexplored, restricted to academic purpose only (Moriki et al., 1996). It is important for managers to understand the nature of changes of the marine system even if they are not specialists in all the fields. In addition, there is an increasing involvement by environmental lawyers, environmental economists and numerical modellers, many of whom are unlike to be specialists in marine science, or even to have a science background, and thus they may be unaware of the interlinking and complexity of the marine system. This difficulty may be compounded by an increasing trend to bring in business managers to handle environmental organizations (Elliott, 2002).
This may result in either poor or non-reproductive data collection procedures or sub-optimal utilization of information, which ultimately impact on the quality of coastal zone management decisions (Cooper, 1994).
There is the need to demonstrate the bottom-up processes, for example the manner in which natural changes in the physical system create the conditions for biota colonization and the way in which Man influences those changes. Similarly, there is then the need to show the top-down responses in which the higher marine trophic levels are affected by changes in the lower components. Following all this, there is the need to link science to the causes of change and to the social, economic and legal responses by Man to the change (Elliott, 2002).
Coastal management requires effective decision in a reasonable time-scale. Therefore holistic approaches for data management should be based on realistic methods rather than complicated ones, with high level of detail and time-consuming techniques.
An indicator is a sign that relays a complex message, potentially from numerous sources, in a simplified and useful manner. The primary uses of an indicator are to characterize current status and to track or predict significant change (Jackson et al., 2000) (see Annex I – indicators concepts). The use of indicators and indices for the evaluation and assessment of the environmental status of different ecosystems is becoming a widespread procedure to analyse the various and often complex components of a system like the marine environments (Casazza et al., 2002).
To assure that indicators serve the purpose for which they are intended and control the way they are specifically selected and developed, it is important to organize them in a consistent framework.
Different methodologies are used for structuring different types of indicators and/or indices. Despite the large variety of frameworks developed so far, many of them are quite similar in their methodological approaches and most is based on causality chains (Ramos et al., 2004 - see Annex I an overview and discussion of these frameworks). DPSIR, developed by the European Environmental Agency, is one of the frameworks for data synthesis and links environmental information using indicators of different categories (Driving forces, Pressure, State, Impacts and Responses) (RIVM, 1995). This framework will be explained in Part II of this study.
and predictive models will not be possible for many stressors on the system, however decision makers can rely on quantitative relationships and expert judgments (Elliott, 2002).
1.3 COASTAL MANAGEMENT UNITS
A Costal zone management program should have well defined zones that should be subject to management and that can be used as management units. A zoning plan can provide the establishment of smaller areas, which can be applied in a more flexible way (Cicin-Sain and Knecht, 1998). Over the last few decades there has been a move towards identifying these units (McGlashan and Duck, 2002).
The definition of the transition zone between the ocean and terrestrial environment, ocean and coastal zone, and zones (or units) within the coastal areas is sometimes not an easy task. Physical criteria, political boundaries, administrative boundaries, arbitrary distances or selected environment units can and are often used (Clark, 1996).
Boundaries for coastal zone management programs should be located so as to capture and enable resolution of all major coastal issues. Because there is a broad array of possible coastal issues, there is a broad array of possible CZM management boundaries. Most CZM projects use administrative boundaries instead of adopting an ecosystem approach looking at impacts coming from outside the area considered (Belfiore, 2000). Coastal management units are evolving by becoming more inclusive, relying more on processes than administrative boundaries and by incorporating a wider range of expertise in defining relevant areas (McGlashan and Duck, 2002). For example MacDonald et al. (2000) developed an ecosystem-based framework for assessing and managing sediment quality conditions in Tampa Bay previously defining management areas. Those areas were defined using interpolated contour lines based on sediment chemistry data and guidelines of potential adverse effects. Picollo et al. (2003) used homogenous units for the coastal zone management of the Ligurian region. These subdivisions of the coast corresponded to physiographic units (topographic elements).
in the type of zones and their arrangement depending on the intensity of use of a particular area as well as the overall size of the area to be zoned (Clark, 1996).
1.4 GIS AND SPATIAL ANALYSIS FOR COASTAL ZONES MANAGEMENT
Scientists have only recently made attempts to transfer information effectively to the end-user, using such high-technology approaches as Geographic Information Systems (GIS) and expert systems models (Cooper, 1994).
GIS are emerging as crucial technology tools for addressing many of the world’s most pressing problems, from infrastructure development to environmental and resource management (Sweeney, 1998). GIS provides a convenient tool for resource assessment planning, and management because they carry out analytical functions, are integrative and can be updated. GIS are integrative because they can take data of different formats from different sources. These data are converted into a consistent internal format and scaled within the GIS. The various map layers for a particular area are geometrically registered with one another and with a base map (Clark, 1996).
Different types of information can easily be overlaid, spatial analysis conducted and queries can be perform within one layer or among objects in two or more layers to help identify and assess the effects of human activities on resource systems (Stanbury and Starr, 1999). GIS can provide designating exclusionary areas, high-risk zones, habitat zones, and the like. It can be used to analyse other kinds of information and data derived from remote sensing activities (Cicin-Sain and Knecht, 1998). Resulting overlay maps would give planners and policy makers tools to guide the type and intensity of new developments to choose priority areas for protection or acquisition. It allows more than an educated guess about the intensity and risk of impact that may occur. It does not make the final decision but provides additional information in a readily understood medium so that the decision can be made with a greater degree of confidence (Clark, 1996).
The appropriate scales to be used in the mapping depend, of course, on both the potential use to which the maps will be put and the nature of the data being mapped (Cicin-Sain and Knecht, 1998).
While advances in expert systems data capture and data storage techniques are forthcoming, coastal scientists and managers themselves have to explore the capabilities of contemporary technologies such as GIS (Ricketts, 1992, Clark, 1996, O'Regan, 1996, Cicin-Sain and Knecht, 1998). The use of key indicators and GIS maps to visualize complex scientific information in natural resources helps to identify particular regions which should receive a higher priority for management and has been well received as a decision support tool (Zandbergen, 1998). Additionally by combining data types, such as socio-political boundaries, bottom types, habitat, species distribution, among other, resource managers can use GIS to make informed management decisions. In this way, GIS provides resource managers with a means to integrate scientific data with prevailing cultural values and traditions (Stanbury and Starr, 1999).
Geostatistical tools, by providing a set of statistical tools for incorporating the spatial and temporal coordinates of observations in data processing, can be integrated in GIS working also as powerful tools for coastal planning purpose. Geostatistics allow the analysis of spatial patterns and the interpolation of the attribute of interest at unsampled locations, assess local and spatial uncertainly about unknown values and integration of secondary data in prediction and simulation algorithms. Geostatistical interpolation methods provide ways to deal with the limitations of other deterministic interpolation methods, like thiessen polygons, inverse distance interpolation or splines. It ensures that the prediction of an attribute value at unsampled points is optimal in terms of the minimization of the expected squared errors of estimation (Burrough and McDonnell, 1998). Geostatistical tools have been largely used in natural resource evaluation like in mining, petroleum, soil science, oceanography, hydrogeology, remote sensing and environmental science (Goovaerts, 1997).
illustrations that may be useful in the context of indicator reporting and visualization are reference or index maps, showing the locations of measurement stations (Langaas, 1997). Despite these advantages few studies in coastal management use integrated these spatial analysis and GIS (e.g. Kitsiou, 1998 and Preston, 2002).
1.5 ENVIRONMENTAL MONITORING AND SAMPLING DESIGNS
In coastal zone management studies, estuaries in particular, the monitoring process is fundamental though difficult and time and cost consuming. Estuaries compared with other aquatic ecosystems have several spatial heterogeneities (Kitsiou et al., 2001). In any environmental assessment process a monitoring step should be included to both ensure that mitigation and other countermeasures are carried out and to determine the actual impacts of the action as implemented (Clark, 1996).
Monitoring is a process where repetitive measurements in time and space are recorded to indicate natural variability, and changes in environmental, social and economic parameters. Measuring theses changes contributes to the information base needed by managers to evaluate a plan’s effectiveness. Evaluation is analysing information, some of it gained through monitoring, then comparing the results of the analysis against predetermined criteria. A well designed, ongoing monitoring program is fundamental for plan evaluation. (Kay and Alder, 2000). The design of an effective monitoring program depends on the plan’s objectives, resources (funding and staff) and available technology. The variables to measure, where to be measured and desired levels of information must be balanced against costs.
Two common types of information used in environmental management are a) baseline information that measures the environmental conditions and status of resources before a project is commenced and b) monitoring information that measure the changes, if any, that occurred after the project was built and operated (Clark, 1996). The statistical reliability of the sampling strategy and parameters used in the baseline surveys and monitoring programs is a key factor.
1.6 SEDIMENT AS A ESTUARINE ENVIRONMENTAL SIGNAL
to complex mixtures of chemicals that commonly characterize contaminated sediments (DelValls et al., 1999). Sediments act as an integrator and amplifier of the concentrations of anthropogenic chemicals in the waters which pass over and transport them, and play an important role in the shallow water estuarine areas. For this reason sediments have been widely used to identify sources of contamination, to measure its extent, and to diagnose the environmental quality of aquatic systems (Luoma, 1990).
The majority of contaminants reaching the costal zones tend to be adsorbed to particulate matter and eventually settle on the water floor, where they can deleteriously affect the sediment-associated community. The degree to which a receiving body is impacted is usually assessed by the analysis of the sediments from the area of concern (Nipper, 2000).
Independent of the geoecological role played by sediments in accumulating or transporting contaminants within a geographic area, the first step is the complete characterization of sedimentary bodies to assess the contamination levels and the distribution of contaminants in order to further identify sources, trends and pathways of pollutants (Queralt et al., 1999).
Although a powerful approach, few studies of estuaries have attempted to explore the relationship between the sediment quality and human activity throughout the coastal zones (e.g. Comeleo et al., 1996 and Dauer et al., 2000). Those authors found successful correlations between human pressures like population density, land use or point and non-point loadings, and sediment contamination or benthos integrity.
1.7 WEIGHT-OF-EVIDENCE AND FRAMEWORKS FOR SEDIMENT QUALITY ASSESSMENT
Several methods have been developed for sediment quality assessment for quite a few decades but most of them only focused on one single Line of Evidence (LOE). Line of evidence is a set of information that pertains to an important aspect of the environment (Smith et al., 2002). Ramos (1996), presented an overview of these different methods discussing their advantages and drawbacks. However environmental decision-making should be carried out on multiple sets of information or LOE.
contaminant movement through the aquatic food web. In addition the difficulty surrounding the integration of the various LOE, required to determine the significance of sediment-associated contaminants, has been problematic. This integration is necessary to justify any remedial action, which requires both characterizating ecological hazard as well as the demonstrating a link between exposure and biological effect (Shin and Fong, 1999, Grapentine et al., 2002).
There is no consensus on a single process to evaluate the multiple LOE in sediment quality, a process called Weight of Evident (WOE). There is also no standardized method or regulatory guidance on how to conduct WOE studies. The Sediment Quality Triad (first version in Long and Chapman, 1985), the Consensus-based Approach (Menzie et al., 1996 fide Burton et al., 2002), and Considerations Recommended for Relative Chemical Ranking (Swanson and Socha, 1997 fide Burton et al., 2002) are the only published approaches of which we are aware that provide any degree of guidance on conducting environmental WOE assessments (Burton et al., 2002). The WOE process can help to determine the extent of pollution, its ecological significance, the optimal remedial options and the urgency of corrective actions (Burton et al., 2002).
Sediment Quality Triad (SQT) is the first WOE approach and more largely used and where more improvements and guidelines have been made (e.g. Long and Chapman, 1985; Chapman et al., 1987; Chapman, 1990, Chapman, 1996, Chapman et al., 1997).
The SQT incorporates three essential components or LOE: i) measures to determine the presence and degree of anthropogenic contamination; ii) measures to demonstrate that substances that are present can interfere with the normal functioning of at least some biological organisms tested in the laboratory; iii) assessment of in situ alteration of resident biological communities (DelValls et al., 1999). Batley et al. (2002) discuss the advantages and limitations of observational and investigative lines of these and other LOE.
They provide ecologically meaningful information about the threat posed by pollution, while analytical chemistry alone contributes to the interpretation and explanation of toxicity patterns (Beiras et al., 2003). Macroinvertebrate field surveys and laboratory toxicity tests yield different types of information on ecological effects, and both are necessary (Chapman et al., 2002). Condition of the ambient benthic community can serve as a reliable and sensitive indicator of potential disturbances resulting from chemical stressors (Hyland et al., 2003). Faunal components of the benthic environment are usually used as integrated indices to analyze the biological indicators. Benthic communities represent powerful tools to reveal disturbance of natural conditions (Casazza et al., 2002).
Single LOE are useful as screening tools but the reality of conflicting results from different lines of evidence requires a WOE assessment for final decision-making (Hall and Giddings 2000 fide Chapman et al., 2002). It is difficult to combine the information from these multiple sources into a single measure for decision-making.
There are three different means to assess SQT Weight of Evidence, which are not mutually exclusive: summary indices, multivariate analyses and tabular decision matrices. All require an appropriate reference station or group of stations (Chapman, 1996). Reference sites are similar areas to a test site in regard to physicochemical and biological characteristics and should be the least impacted for purpose of determining unacceptable impairment (Burton et al., 2002).
The first formalized SQT, was based on indices, specifically the development of ratio to reference (RTR) values for each of chemistry, toxicity and benthic community structure (Long and Chapman, 1985; Chapman, 1990). These different variables can also be integrated in one single value with a scoring system. This approach synthesizes integrative data and rank stations and is easily understood by non-scientists (Schmidt et al., 2002). However it is inappropriate to integrate the various LOE findings into one number since important unique information is lost when the LOE ranking are summarized into a single measure, leading to potentially misleading conclusions (Burton et al., 2002).
heterogeneous bulk of data generated by the chemical, toxicity and in situ benthos, multivariate statistical methods are currently and successfully employed (Shin and Fong 1999; Beiras et al., 2003). These multivariate tools can be Principal Component Analysis (PCA) (e.g. Chapman et al., 1996, Anderson et al., 2001), cluster analysis (e.g. Shin and Fong, 1999), non-metric multidimensional scaling (e.g. DelValls et al., 1998, Beiras et al., 2003), Discriminant Analysis (e.g. Shin and Fong, 1999), correspondence analysis (e.g. Rakocinski et al., 1997), BIO-ENV procedure (e.g. Mucha et al., 2003) among others.
There are different ways and aggregation methods to built indices, that despite data compression and some loss of information, their results are easy to understand and informative. Indices can also be very useful to complement the WOE assessment.
Tabular decision matrices are based on hit/no hit alternatives formatted for decision-making and is neither new nor complex, and comes from one of the few existing frameworks in which Weight of Evidence can be applied. A primarily limitation of this approach as initially proposed (Chapman, 1990) is that it does not explicitly incorporate variance in the quality of the lines of evidence. The assumption is that the data from each Triad component are appropriate. For example, if chemical data are not measured at toxic concentrations and toxicity tests are negative but the community is altered, alteration can not be due to toxic contamination, or the chemical analysis and/or toxicity test may be inappropriate (Chapman, 1996). The hit alternatives are therefore classified according to a logic system probably originated in Koch’s postulates (1884) as refered by Chapman et al. (2002), that weights the strength of evidence that supports each potential cause (Burton et al., 2002):
i.The adverse effect must be regularly associated with exposure to the stressor; ii.The stressor must be found in the affected receptor;
iii.The adverse effect must be manifest in unimpaired species, following under controlled experimental conditions;
iv.The stressor (or indicator of exposure) must be found in the experimentally affected species.
The integration of each LOE into a WOE matrix table allows for a comprehensive review and determination of reasonable conclusions on the level of impairment and characterization of stressors. Multivariate analyses can be incorporated in a final tabular decision matrix, as for example Chapman et al. (1996) did.
exposure. Information on chemical contamination provides data for assessing exposure, however, biological effects data are required for determining the probability of adverse impacts and their potential magnitude. Effects should be associated with stressor exposure and plausible mechanisms are required to link cause and effects (Chapman et al., 2002). WOE approach can then be seen in an ecological risk assessment (ERA) context, defining WOE as the approach by which measurement endpoints are related to assessment endpoints based on weight, magnitude and concurrence, to determine risk of harm.
Best Professional Judgments (BPJ) should also be taken in to account in WOE framework for contaminated sediments. BPJ comprises the use of expert opinions and judgement based on available data and site and situation specific conditions to determine, for example, environmental status or environmental risk. BPJ can be initiated when there are extensive data but few uncertainties, and when there are few data and many uncertainties. Measurements are weighted by stakeholders based on best professional judgment, relative to the assessment endpoint, the study’s quality and design, and on the confidence in the measurement (Menzie et al., 1996 fide Chapman et al., 2002).
Sometimes BPJ may be more relevant than statistical comparisons (Chapman et al., 2002). Several more recent studies have been using successfully the WOE approach with BPJ for ecosystem assessment (e.g. Anderson et al., 1998, Albertelli et al., 2003). Albertelli et al., (2003) developed a Coastal Sediment Quality Index based on the SQT incorporating BPJ. The weight of the different components was computed based on an expert judgement according to the Delphi method for better decision-making. The results of each LOE were calculated using the Dashboard freeware software and overall assessment was scored from excellent to critical. This free software allows to present complex relationships between economic, social and environmental issues in a highly communicative format aimed at decision-makers and citizens interested in Sustainable Development (Processdash, 2004). This approach is very interesting and easy to transmit, but still does not allow the association between the indicators, as multivariate analysis does.
appropriate for all assessments of ecosystem impairment, given the wide range of stakeholders concerns and resources availability, and the differences in ecosystems study design, expertise, and execution (Burton et al., 2002). These authors propose a framework that begins by defining key “Certainty Elements” for reliable WOE assessments and accurate decision-making, reducing the role of BPJ and increasing the quantitative assessment components that can be used in sediment quality assessment:
i.Development of a conceptual model, showing linkages of critical receptors (organisms, population or community) and ecosystem quality characteristics;
ii. Explanation of linkages between measurement endpoints responses, direct and indirect with associated spatial/temporal dynamics, and conceptual model components;
iii.Identification of possible natural and anthropogenic stressors with associated exposure dynamics;
iv.Evaluation of appropriate and quantitatively based reference (background) comparison methods;
v.Consideration of advantages and limitations of quantification methods used to integrate LOE;
vi.Consideration of advantages and limitations of each LOE used;
vii.Evaluation of causality criteria used for each LOE during output verification and how they were implemented;
viii.Combining the LOE into a WOE matrix for how they were implemented for interpretation, showing causality linkage in the conceptual model.
All aspects of each WOE, like selection of specific species, toxicological endpoints, WOE categorization criteria, use and number of reference stations, use of background conditions, and the total number of stations needed to characterize the site, should be developed a priori in a Problem Formulation/Sampling and Analysis Plan (PF/SAP) that is used as the basis of discussion with regulatory agencies. Development of a PF/SAP (and modification based on stakeholders and regulatory feedback) is essential for the success of the WOE process (Chapman et al., 2002).
1.8 THE NEED FOR AN ENVIRONMENTAL DATA MANAGEMENT IN THE SADO ESTUARY:
PORTUGAL
the environment and sustainable development provides for an initiative in response to the council’s request for an overall Community strategy on CZM. In this context in 1994 the European Council emphasized the need to develop a European Community strategy for CZM and called on the Commission for drafting such strategy. The exercise aimed at providing results and experiences useful to define and implement a European strategy for CZM based on the “principle of subsidiarity” and taking into account legal, economic and policy instruments, as well as making better use of existing funding schemes. In Portugal, Vale do Lima, Ria de Aveiro and Algarve participate as demonstrative projects. The experience of the demonstration program has underlined, among other things, that reliable and timely information is required within a strategy for collection, processing and diffusion of comparable data and information. This requires the involvement of specialists, in order to analyse raw data and transform them into useful information. The use of spatial analysis, risk assessment, environmental impact assessment, GIS, Gobal Positioning System, indicators, appears particularly promising (Belfiore, 2000). Within the European Union Demonstrative Program on CZM it was also stressed that information must play a central role in the development of a more integrated approach to management. For a better information use in CZM the European Union decided to adopt the indicator framework DPSIR (Doody et al., 1998).
The Water Framework Directive (2000/60/EC - EC, 2000) provides an extra motivation to search for methodologies for ecosystem management as it imposes procedures for the characterization of the ecological and chemical condition of water bodies as well as to clearly define what is the unimpacted state (Silva and Rodrigues, 2002). Other Directives, like urban waste water treatment (91/271/EEC – EC, 1991a), nitrates (91/676/EEC – EC, 1991b), dangerous substances ( 76/464/EEC – EEC, 1976) and natural habitats and wild fauna and flora (92/43/EEC – EC, 1992), also obligates correct management practices at the European coastal areas.
Coastal nations, like Portugal, have an unprecedented opportunity to set a new course towards sustainable use of the world’s coastal and ocean heritage (Cicin-Sain and Knecht,1998).
Guadiana River estuary, involving several interdisciplinary teams (River, Estuary, groundwater, ecosystem and socio-economic). Alves et al.(2002) developed an integrated management program for the Ria of Aveiro focused on the partnership and public participation to solve the problems and conflicts aiming at the maintenance of social and economic development, as well as the preservation of the natural environmental and the cultural identity. The application of indicators and indices as tools for coastal zone management has also been used in Portugal, although in most cases only in a conceptual way. Painho et al. (1996) proposed a conceptual model using indicators of sustainable development for CZM based on coastal management units. Those units can be delineated based on spatial tools that take in to account the ecology, administrative and economic issues. Ramos et al. (1998) proposed a list of sustainable indicators to be applied in Portugal, classified according to the Pressure, State, Responses (PSR) indicator framework of the Organization for the Economic Cooperation and Development (OECD) and where the coastal and marine environment was considered. Barbosa and Silva (2001) have delineated and adopted a list of environmental indicators for CZM aiming at the valorisation and protection of the Portuguese coast. Silva and Rodrigues (2002), developed and applied environmental indicators for Tagus Estuary using PSR model.