1 A Work Project, presented as part of the requirements for the Award of a Master Degree in Management from the NOVA – School of Business and Economics and INSPER.
HOW DOES THE DIVERSITY OF THE BOARD MEMBERS AFFECT FIRM PERFORMANCE? THE CASE OF BRAZIL
Fernando Zanotti Schneider -27601/3634
A Project carried out on the Master in Management Program, under the supervision of: Professor. Dr. Guilherme Fowler / INSPER and Professor Dr. Duarte Pitta Ferraz – Nova de Lisboa / Universidade Nova de Lisboa
2 How does the diversity of the board members affect firm performance? The case of Brazil.
Fernando Zanotti Schneider
April 2017
Abstract
This research investigates the relationship between the diversity on the composition of Board of Directors and the financial performance of Brazilian listed companies in BOVESPA, in a corporate segment called “Novo Mercado”. Despite being an increasingly studied topic abroad, Brazil has limited studies in diversity when compared with other countries. In a global level, most of the studies regarding this topic are focused on the gender composition of the Board. In this article, diversity is measured by four variables: gender, age, education and independence (or not) of the Board members. Analyzing a sample of 119 companies in Brazil, 967 individuals as board members, covering the period of 2013-2015, this quantitative study has as its core method an ordinary least squares (OLS) for estimating the parameters in a linear regression model, using as controls variables board size, industry (economic segment), the types of capital of listed companies, categorizing them as State, Private and Private Holding. In accordance with the theory, the research finds that a more diverse board (in terms of gender) has positive impact in the financial performance, measured by Return over Assets. In the other hand, the results show that diversity in terms of education and age has a negative impact in terms of ROA. In addition to the overall contribution to the discussion of diversity on Boards of Directors, the findings of the research may help shareholders, stakeholders and policy makers using such knowledge to use the Board more efficiently and strategically.
3
1. Introduction
Corporate governance is usually defined as the system by which companies are directed and controlled (Cadbury, 1992). Corporate governance also provides the structure through which the objectives of the company are set and the means of attaining these objectives and the monitoring of performance are determined (OECD, 2015). In the corporate governance of listed companies, the board of directors is the most important body since it is ultimately responsible for the direction and, therefore, has been the most studied corporate governance mechanism (Goodstein, Gautam, & Boeker, 1994; La Porta et al., 2000; van der Walt & Ingley, 2003).
A board of directors is a group of individuals elected by the shareholders to oversee the strategy of a company (Baysinger & Butler, 1985; La Porta et al., 2000). The company is owned by the shareholders, who elect the board to implement the strategy of the company and protect its investments and interests (Adams & Ferreira, 2009; Jhunjhunwala & Mishra, 2012).
Among the most significant governance issues currently faced by the modern corporation is board member diversity (Lopes, Ferraz, & Martins, 2016) and how it affects the firm’s performance. A standard argument in favor of diversity is that board performance should improve with a better mix of skills or backgrounds (Devillard, S, Sancier-Sultan, S., & Werner, 2014; Joy, Carter, Wagner, & Narayanan, 2007; Post & Byron, 2015) because a diversity of perspectives among individuals can be a relevant strength on boards to define the company strategy over the long term.
The objective here is to investigate the relationship between diversity in the composition of boards of directors and the financial performance of Brazilian listed traded companies, based on the return over assets (ROA). Our sample comprises 119 companies that are listed in the New Market (“Novo Mercado”), as per the Brazilian Stock Market’s (BOVESPA) segmentation. Novo Mercado is a voluntary listing level, with increasingly corporate governance requirements. The higher levels provide investors with a readily understood signal of their corporate governance posture. Corporate segmentation is considered a success in Brazil, and it now includes 5 different corporate levels. In the highest two BMF&Bovespa corporate governance levels (Level 2 and Novo Mercado), there is influence regarding the composition of the board (at least 5 members, instead of the minimum 3 mandatory in accordance with Brazilian corporation law), and 20% of the board members must be independent.
Different from other papers that have usually approached diversity with a single variable, normally gender (Adams & Ferreira, 2004; Bilimoria, 2006; Devillard, S, Sancier-Sultan, S., & Werner, 2014; Low, Roberts, &
4 Whiting, 2015; Nguyen, Locke, & Reddy, 2015; Rao & Tilt, 2016; Saeed, Belghitar, & Yousaf, 2016; Terjesen, Sealy, & Singh, 2009; van der Walt & Ingley, 2003), diversity is measured here by four different variables: gender (male or female), age (5 different divisions), educational background (engineers, lawyers, etc.) and independence (or not) of the board members from the executive bodies of the firm, in accordance with the definition provided.
Despite being an increasingly studied topic abroad, Brazil has had only limited studies of diversity compared with other countries (Fraga & Silva, 2012), and most of these studies have focused on the gender composition of boards (Lazzaretti, Kleinübing Godoi, Parodi Oliveira Camilo, & Marcon, 2013). The goal of this study is to be able to identify whether Brazilian boards of directors are in agreement with a literature review and to determine how diversity, as proposed, might explain the financial indicators.
Diversifying the board is supposed to offer such benefits as more effective decision making, better use of the talent pool and enhancement of corporate reputation with stakeholders (Buse, Bernstein, & Bilimoria, 2016; Carter et al., 2003; Carter, D’Souza, Simkins, & Simpson, 2010; Erhardt, Werbel, & Shrader, 2003; Kang, Cheng, & Gray, 2007; Randøy et al., 2006; van der Walt & Ingley, 2003). Of course, gender diversity is a political and sociological event of great relevance, which is why it has been the most studied variable in this context (Devillard, S, Sancier-Sultan, S., & Werner, 2014; Saeed et al., 2016). The difference among the presence of female directors and male directors should be always examined, especially the reasons there are so few female board members. However, diversity include more than gender, which is the simple reason we chose four variables (gender, age, education and independence). All these variables are easier to observe in accordance with public data, and they can be used to verify the effects of board composition on financial performance.
From a sociological perspective, after gender, ethnicity is a potential diversity variable that could create public awareness of the importance of the study and of the composition of members of the board (Brammer, Millington, & Pavelin, 2007; van der Walt & Ingley, 2003). In theory, it is possible to include ethnicity (race) as a variable of board members, and such a study could provide contributions regarding corporate governance in Brazil. This study could be of great value, especially considering that Brazil is a very mixed society with strong inequalities among different ethnic groups. However, the information provided by listed companies in Brazil does not include this information on its forms. To avoid any prejudice or subjectivity, this research refrains from making assumptions from pictures.
In addition to the overall contribution to the discussion of diversity on boards of directors, the findings of this research could help shareholders, stakeholders and policy makers to use such knowledge to use boards more efficiently and strategically. The choice of who will monitor the firm is always a challenge, and there is a global need to understand how board composition works
5
2. Literature Review and Hypothesis
One of the most important theories for understanding the importance of the board of directors in corporate governance is agency theory (Fama & Jensen, 1983; Helland & Sykuta, 2005). Briefly, agency theory addresses problems that arise due to differences between the goals or desires between the principal and agent. For example, a company executive (agent) might prefer business-class air tickets rather than economy-class tickets to provide comfort to perform the job with excellence, while shareholders (principals) might desire lower costs and a higher profit margin.
To ensure that the interests of shareholders and agents are aligned, corporate governance establishes certain monitoring and control methods (Jensen & Meckling, 1976), through several internal and external mechanisms (Adams & Ferreira, 2009; Denis & McConnell, 2003). Agency issues can be solved by different approaches. They could be solved by setting a variable of compensation for the executive managing the corporation (i.e., bonus accordance the financial performance of the firm) to align interests or to replace bad managers who are not creating value for shareholders. (Schepker & Oh, 2012; Stroh, Brett, Baumann, & Reilly, 1996; Terjesen et al., 2009).
The board of directors has the ultimate responsibility for the manner in which a corporation’s business is conducted (Baysinger & Butler, 1985; La Porta et al., 2000). The board sets the strategy of the company, appoints the management, establishes the internal operational polices and accepts responsibility before third parties, such as depositors, regulators, shareholders and other public stakeholders (Carter et al., 2003; Jhunjhunwala & Mishra, 2012; Joy et al., 2007). In such an arrangement, the members of the board and the decisions made by them are crucial for firms. One of the key elements of an agency view of the board is that outside board members will not collude with inside directors to subvert shareholders’ interests because directors have incentives to build reputations (Adams & Ferreira, 2004).
On the board, diversity consists of heterogeneity among its members, and it has an infinite number of dimensions, ranging from age to nationality, from religious background to functional background, from task skills to relational skills and from political preference to sexual preference (Lückerath-Rovers, 2013; Pfeffer & Salancik, 1978; van Knippenberg, De Dreu, & Homan, 2004). Diversity can be either visible/observable (race/ethnic background, nationality, gender, age, etc.) or less visible (educational, functional and occupational background, industry experience and organizational membership).
Diversity is a combination of the qualities, characteristics and expertise of the individual members relative to decision-making and other process within the board (van der Walt & Ingley, 2003). Therefore, diversity
6 of board members includes a mix of different personalities and experiences to ensure that the board does not consist solely of like-minded members.(Abdullah & Ismail, 2013). Supposedly, a myriad of perspectives would prevent “groupthink”. Groupthink (Janis, 1973) is a psychological phenomenon that occurs when a group of people works together and tends to desire harmony or conformity in the group. Groupthink requires individuals to avoid raising controversial issues or alternative solutions, and there is a loss of individual creativity, uniqueness and independent thinking.
The dysfunctional group dynamics of the "ingroup" produces an "illusion of invulnerability" (an inflated certainty that the right decision has been made), which can result, especially if the individuals have similar backgrounds, in excessive optimism, which encourages the taking of extreme risks or the members to discount warnings and not reconsider their assumptions among other systems that might be extremely harmful to a company. Groupthink phenomenon might pose a great danger to firms and to the economy in general and to diversity can influence the decisions of a group.
Today the requirement is that boards appoint directors who can add value to board processes and governance functions. Much greater attention is paid to selecting directors on the basis of a range of criteria, based on merit and the performance required of the board and the organization (Bilimoria, 2000).
The basic argument in favor of diversity is that heterogeneity results in a broader perspective, which in turn allows groups to be involved in in-depth conversations and to generate different alternatives (Watson, Johnson, & Merritt, 1998). This change is possible because diverse team members perceive problems from a variety of perspectives (Kathy Rao, Tilt, & Lester, 2012; Post & Byron, 2015; Rao & Tilt, 2016), resulting in a broad range of solutions and an even broader range of consequences for each option (Robinson & Dechant, 1997).
From a firm competition perspective, to compete at the global level demands a process of innovation, which can be generated only by talented and diverse members, a more diversified board would have better opportunities and increase analytical skill to affect the financial performance of the firm positively.
Diversity, in contrast, can have negative or negligible effects on group processes or decision-making processes. Group members who are different from each other tend to have lower group loyalty (Munisi, Hermes, & Randoy, 2014), lower levels of commitment and higher levels of turnover intent and absenteeism (Marimuthu & Kolandaisamy, 2009). The literature also describes the possibility of diversity triggering negative group behaviors (Buse et al., 2016; Carter et al., 2010).
7 Whether favorable or not, diversity on boards has attracted significant attention from the public, researchers and even the media. The media and business opinion makers regularly report that diversity on boards leads to higher performance. On an international level, two studies are usually cited: one from a consultancy firm (Devillard, S, Sancier-Sultan, S., & Werner, 2014; McKinsey & Company, 2007) and another from a nonprofit organization (Joy et al., 2007) offer support for a positive relationship between diversity and board performance. In accordance with (IBGC, 2016), representing 33,5% of the work force in Brazil, only 7,2% of high management positions are occupied by women, demonstrating the importance.
For further social and ethical reasons, the economic arguments have stirred demands for increased diversity on boards globally. Several countries (Norway, for example) have introduced laws mandating female representation on corporate boards, while others (such as the United Kingdom) have incorporated recommendations on corporate governance codes. As a result, women’s membership on boards has been increasing in developed economies. In particular, Norway leads the world in its percentage of female directors, with 36.1% (GMI, 2013).
In this sense, there is a political dimension regarding gender diversity (Adams & Ferreira, 2004:14): “Companies may care more about diversity when they are concerned about their public image, either because they are large firms which are visible to outsiders or because they are required to deal with government agencies which have preference for diversity”.
In Brazil, there is a law project of Senator Maria do Carmo Alves that proposes a minimum percentage of women on boards of directors. In 2017, this law project was still being debated in the Congressional Constitutional, Justice and Citizenship Commissions and is, therefore, not in force.
Gender has been the most studied variable regarding diversity (Erhardt et al., 2003; Singh, Terjesen, & Vinnicombe, 2008; Torchia & Huse, 2011). These studies have reported mixed or inconclusive results. The studies have failed to establish any clear relationship between gender diversity and firm performance (Macus, 2008; Zahra, Neubaum, & Huse, 2000). In contrast, there have been studies with evidence that gender might be related positively with firm performance (Adams & Ferreira, 2004; Carter et al., 2003; Devillard, S, Sancier-Sultan, S., & Werner, 2014; Lückerath-Rovers, 2013; McKinsey & Company, 2007), leading to different findings.
In light of growing concerns and legislative progress toward greater diversity, several studies have analyzed the presence of women's decision-making bodies and the conditions of this presence (Mínguez-Vera & Martin, 2011; Nekhili & Gatfaoui, 2013). A potential explanation for a favorable view of gender diversity is
8 that appointing female directors can provide benefits to companies by their stakeholders (Torchia et al., 2011). Providing legitimacy is mentioned since female directors can be a source of a valuable form of legitimacy before stakeholders (employees, service provides etc.) (Zahra et al., 2000). In addition, consumer-centric businesses are more inclined to appoint female directors (Brammer et al., 2007).
In any scenario, most studies have primarily examined developed markets. There have been limited studies of board diversity in emerging economies, presenting a completely different context. Regarding emerging economies, in China and India, women’s presence on boards is above average in large firms and firms in the financial services sector (de Jonge, 2015). There have been studies (Liu, Wei, & Xie, 2014) demonstrating a positive relationship between firm performance and board gender diversity in China, showing that the probability of women on boards increases with state ownership.
In Brazil, there have been two main articles frequently accessed regarding board diversity: Fraga & Silva, 2012 and Lazzaretti et al., 2013. Fraga and Silva’s study is similar to the present research. It investigated the diversity of the boards of directors of Brazilian companies listed on the BOVESPA with regard to gender, age, educational attainment and independence, to ascertain whether there are relationships between any of these diversity measurements and firm performance. However, this study covered only companies without majority control, which numbered 35 in 2011. Nevertheless, its findings were important: the presence of female board members was small, but firms that had at least one female director outperformed those that did not.
The second Brazilian article (Lazzaretti et al., 2013) analyzed the gender composition of the 99 most liquid Brazilian companies listed on the Brazilian stock exchange (BM&FBovespa) in 2011. Its survey showed that the participation of women on the boards of directors of Brazilian companies was very low (5.4%) and less than in most countries, with Brazil ranking equally with India, ahead of only four other countries and a long way from pioneering countries with quota laws, such as Norway.
It is interesting to note that similar studies conducted in Portugal had comparable results. Although Portugal is a more developed economy and member of the European Union, there are some similarities with and a strong influence of Portuguese culture on Brazilian culture. A recent study (Lopes, Ferraz, & Rodrigues, 2016) based on 124 non-financial listed companies, all of them integrated with the Iberian stock exchange (Portugal: 37 companies; Spain: 87 companies), could not support a relationship between performance (measured by ROE, ROA and other indices) and diversity.
9 The stakeholder theory (Freeman, 1984) has a number of implications for the relationships between board members characteristics and various stakeholders. As mentioned, maintaining good relationships with stakeholders and having diversity (especially in terms of gender) increase firm legitimacy, while they can have financial impacts by reducing legal prosecutions, regulatory sanctions, customer boycotts and labor-related problems (Waddock & Graves, 1997). Additionally, socially responsible firms might be perceived as better managed and, as a result, less risky. In light of the theoretical background and prior empirical findings, we understand that Brazilian companies might benefit from gender diversity. In other words, the following hypothesis is proposed:
Hypothesis 1: Board gender diversity correlates positively with firm financial performance.
It is unclear in the literature how age differences affect firm performance. A basic diversity argument is that decision making by more heterogeneous teams can be more effective in solving problems (Watson et al., 1998). Age diversity increases board independence because people of different ages are influenced by different cultural backgrounds and might ask different questions (Rao & Tilt, 2016).
Age diversity increases board independence because people of different ages are influenced by different cultural backgrounds and might ask different questions that would not be asked by directors of the same ages. In other words, a more diverse board from an age perspective could be a more analytical, questioning board that could positively affect firm performance. In contrast, other studies have argued that the same diversity can lead to conflicts in communication and cooperation in the group, which could have negative effects on the board’s performance (Dobbin & Jung, 2011). In some industries, there is a general feeling that younger board members should be recruited for the potential that they bring to the board and a rapidly increasing need for future-focused thinking and vision (Fineran & Matson, 2015). The rationale is that technological businesses might need younger board who can contribute with knowledge and insight regarding technology that might not exist with older members.
However, a study of 288 organizations from the Australian Securities Exchange (Ali, Ng, & Kulik, 2013) found a negative linear relationship between age diversity and return on assets. The results support social identity theory (Tajfel & Turner, 1979), indicating that age diversity can lead to psychological groupings of younger board directors and older board directors, triggering negative group behaviors. These results are consistent with those of the study of (Hafsi & Turgut, 2013), who found a negative association between age diversity and corporate social performance. There have been other studies that found either a significant, positive relationship between age diversity and performance or a nonsignificant relationship between age and performance (e.g., Jhunjhunwala & Mishra, 2012).
10 Considering that the research on Australian Securities Exchange is similar to the methodology developed herein and to the Brazilian study (Fraga & Silva, 2012), with similar hypotheses and conclusions, we propose our hypothesis concerning age as follows:
Hypothesis 2: Board age diversity correlates negatively with firm financial performance.
Prior research in Brazil (Fraga & Silva, 2012) demonstrated that there is a negative relationship between the diversity of board members in the areas of education and the performance of the company. Companies receiving advice from people with diverse educational backgrounds would have inferior performance, which is a conclusion opposite from the arguments normally developed.
In addition, a paper investigating the demographic diversity of board members in the Sri Lankan boardroom (Wellalage & Locke, 2012)) and its effects on firm financial performance using similar methods to those presented herein found that though board ethnicity and age diversity increase firm financial performance, while board gender, education and occupational diversity reduce firm financial performance.
It is important to note that we will not measure the level of education of the members of boards. Typically, the mean number of years of education is relatively high in on corporate boards. Limited education is likely to be the experience of the founding entrepreneurs of younger firms, and they might bring more intuitive skills and tacit knowledge, while directors with postgraduate degrees might bring more analytical skills (Arat, 2015). What will be measured is the diversity of education, i.e., professionals from different backgrounds (for example, board members with different degrees, such as engineers, law, medicine, business, economics, etc.), on the board and how this difference could affect the performance of the firm. Therefore, we propose our hypothesis regarding education diversification as follows:
Hypothesis 3: Board education diversity correlates negatively with firm financial performance.
Board composition is the distinction between executive directors and non-executive directors (NEDs). The agency theory promotes the need for boards to be as independent as possible to be effective in monitoring and controlling top management and to protect stakeholders’ and shareholders’ value (Jensen & Meckling, 1976; Lopes, Ferraz, & Martins, 2016).
11 The importance of NEDs in agency theory is that outside board members will not collude with inside directors to go against shareholders’ value because directors have an incentive to build reputations as expert monitors. A large proportion of outside directors are, consequently, viewed as the key to board independence. Therefore, theoretically, a larger proportion of outsiders on a board can better monitor and control the opportunistic behavior of the incumbent management, thus minimizing the agency problem and maximizing shareholders' wealth.
In this sense, some studies have claimed that the board composition of NEDs is positively correlated with firm performance (Baysinger & Butler, 1985; Pearce II & Zahra, 1992; Rose et al., 2013); therefore, lower performing firms are more likely to add outside or independent directors to their boards.
In Brazil, the only recent study (Fraga and Silva, 2012) found that diversity in independence had a negative effect, causing increased likelihood of considering that the presence of independence in NEDs on boards led to unprepared or unqualified personnel. Despite this last finding, to be consistent with the global results and theory mentioned previously, we propose our hypothesis regarding independence diversification as follows:
12
3. Method
We explore diversity in Brazilian listed companies in a corporate governance segment called New Market (Novo Mercado), composed of 119 companies. The BOVESPA is the only stock market in Brazil and is duly regulated by CVM (Brazilian Securities Exchange Commission). Of the total number of approximately 400 listed companies in CVM and BOVESPA, the New Market segment represents the most important companies with relatively complete data on the key variables (dependent and control) over the 3 year period between 2013 and 2015. The choice of the highest corporate governance segment was to reduce heterogeneity and to increase comparability among companies. In Brazil, listed companies can have a preferred share without voting rights, which creates anomalies when comparing board compositions and firm performances with international standards.
The information on board composition and firm characteristics was collected manually from BOVESPA and CVM since none of the normal data from central information companies (such as Bloomberg or ECONODATA) had the precise information required for each of the 967 board members. The firm financial performance data (ROA), our dependent variable, was collected from Bloomberg. Among different financial performance indicators, the ROA indices for 2013, 2014 and 2015 were chosen because they show as a percentage how companies are generating revenue (Lückerath-Rovers, 2013), providing good evidence for the firm’s financial performance (Carter et al., 2003; Dagsson, Larsson, & Sällberg, 2011; Randøy, Thomsen, & Oxelheim, 2006; Rose, Munch-Madsen, & Funch, 2013).
ROA is used as the measurement of firm financial performance and is a dependent variable. As a market-based measurement of financial performance, ROA is a universal method for quantifying the return of the company, which can be interpreted and can render uniform the differences among different samples.
Regarding the independent variables, gender, age, education and independence are used as separate dimensions of diversity because scholars advise against aggregating multiple dimensions of diversity into a single index (Lazzaretti et al., 2013). There have been studies (Ararat, Aksu, & Tansel Cetin, 2015) calculating board diversity as a single index of differences in a number of categories. However, the purpose herein is to analyze each of the independent variables individually, per our hypothesis model.
Gender is measured by the percentage of female members on boards of directors, as conducted by (Carter et al., 2003). Although there are some critics of this method, IBGC has previously demonstrated that the number of female members of boards in Brazil is very low. Hence, the proportion between men and women is measured by women.
13 For age (age), the calculation is made in accordance with the Blau index (Keylock, 2005) for age diversity as: 1 − ∑𝑘
𝑃
𝑖,𝑗,𝑡2,
𝑗=1 where i is the maximum number of categories. The directors of firm i were classified
into five age categories: 1 – 25-35 years old; 2 – 36-45 years old; 3 – 46-55 years old; 4 – 56-65 years old; and 5 – older than 65 years old. The maximum number of categories (k) was 5. P was the individual category. The diversity index was 1 if the members were distributed evenly in the five categories and zero if all were in a single age range.
For education (education), the degree held by each board member of a firm was identified, such as law, engineering, economics, business administration, etc. Each discipline was assigned to a category. Different types of engineers (civil, mechanics etc.) were compiled in a single category. The maximum number of categories (k) possible for a board was the number of members. The maximum index of 1 indicated that each director had a different educational discipline, and zero indicated that everyone had the same training.
Finally, for independence (independence), the percentage of independent board members is considered. In accordance with BOVESPA regulations, which set forth enhanced corporate governance standards for listed companies.
To control for endogeneity issues, we controlled for some aspects of the firms. Ownership and control structure are key determinants of the type of agency problems that affect firms. In this sense, we controlled for state control, private control, and private holding control. Economic segment also predicts the level of age and gender diversity of boards (Brammer et al., 2007; Kang et al., 2007). A segment for activities was created in accordance with the registries provided by the BOVESPA.
As suggested by the literature, to verify whether the diversity of the board affects the financial performance of the firm (ROA) and to examine whether diversity (H1, H2, H3 and H4) matters, we estimate a model of performance expressed by the equation:
𝑹𝑶𝑨 = 𝜶 + 𝜷𝟏𝑭𝒆𝒎𝒂𝒍𝒆 + 𝜷𝟐𝑨𝒈𝒆 + 𝜷𝟑𝑬𝒅𝒖𝒄𝒂𝒕𝒊𝒐𝒏 + 𝜷𝟒𝑰𝒏𝒅𝒆𝒑𝒆𝒏𝒅𝒆𝒏𝒄𝒆 + 𝜷𝟓𝑩𝒐𝒂𝒓𝒅 𝑺𝒊𝒛𝒆 + 𝜷𝟕𝑭𝒊𝒓𝒎_𝑨𝒈𝒆 + 𝜷𝟖 𝑰𝒏𝒅𝒖𝒔𝒕𝒓𝒚 + 𝜷𝟗 𝑶𝒘𝒏𝒆𝒓𝒔𝒉𝒊𝒑 + 𝜺
14 For the analysis of the data, multiple regression is used, and to estimate the parameters, the ordinary least squares (OLS) method was used since it is the common methodology used to measure the impacts of diversity variables on the firm performance (ROA) of companies.
The intercept coefficient (α) of the model represents the general mean of the dependent variable, the parameter vector indicates the linear relationship between the dependent variable and the independent variable, and the regression error represents what cannot be explained by the independent variables or by the overall mean.
Multiple regression analysis is more receptive to ceteris paribus analysis since it allows for explicit control of many other factors that simultaneously affect the dependent variable since the model can have more factors added that are useful for explaining the dependent variable (J.m.wooldridge, 2011).
Therefore, multiple linear regression was used to evaluate statistically the association of a set of independent variables with a dependent variable. The main difference between multivariate analysis and bivariate analysis is that in multivariate analysis, we consider the effects of several variables simultaneously, allowing us to evaluate the effect of each independently of the others, that is, considering the other constant variables.
Regression models assume normality and homoscedasticity of the residues, checked through graphic analysis. Another analysis concerns multicollinearity (multivariate correlation), which was assessed via the variance inflation factor (VIF), in which VIFs smaller than 10 indicate an absence of multicollinearity (HAIR, 2009). All the hypothesis tests developed in this study considered a significance of 5%; that is, the null hypothesis was rejected when the p-value was less than or equal to 0,05.
The adjustment of the model produces residues (the difference between the observed value and the adjusted value), and to accept the adjusted model, some assumptions about these residues must be satisfied, such as normality, homoscedasticity and independence. These assumptions can be verified by graphical methods, and in practice, these assumptions need not all be rigorously met. The results are empirically true whenever the populations are approximately normal (that is, not very asymmetric) and they have close variance.
In addition, we employ exploratory measures, including Spearman’s and Pearson’s correlation analyses and the Kruskal-Wallis test, for comparison between samples (t-test). The correlation analyses are
15 performed before the regression model and are allowed certain directions regarding the expected results in the modeling. The difference between the two applied methodologies lies in Pearson's correlation assuming that the correlation is presented in a linear fashion, while the Spearman correlation is a nonparametric, point-based methodology.
The Kruskal-Wallis test for k samples was applied to evaluate whether there is a difference in ROA per year in the different categories of the qualitative variables of the sample with industry and capital composition. The Kruskal-Wallis test is a non-parametric test that is equivalent to the F-test of ANOVA; that is, the Kruskal-Wallis test aims to detect whether there is a significant difference between the means (parameter of location of the distributions) of k different samples.
This non-parametric test has the advantage, given the ANOVA F test, of not assuming normality in the distribution of the variable of interest or homoscedasticity (equality of variance of the different populations), depending only on whether the variable is of an ordinal scale.
The most common measurement of correlation, known as Pearson's correlation coefficient, measures the linear relationship between two variables. Spearman's correlation coefficient, which is based on the assignment of stations, is a good alternative to Pearson's correlation coefficient because it does not depend on any specific relationships assumptions about the two variables under study.
16
4. Results
The sample under analysis consisted of 119 companies, and the ROA of each company was evaluated in 3 different years: 2013, 2014 and 2015. The independent variables (gender diversity, age diversity, education diversity and independence) of the sample were all evaluated in accordance with the observation of 967 individuals as board members, taking as a parameter 2013.
The variable referring to meetings was discarded from the analyses due to the small amount of information available; 108 of the 119 companies did not make this information available.
It is important to emphasize that in accordance with the proposed data collection, only the dependent variable varies over time. The remainder remain static. This format of information disposition renders the use of fixed and random effects models impossible. Therefore, the applied model was the OLS model, with the use of years as indicator variables.
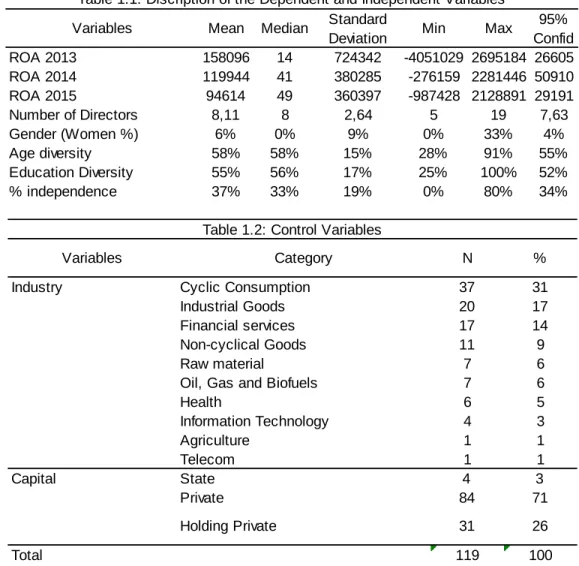
The analysis began with a description of the sample under study, and we observed that the ROA ranged from -4051029 to 2695184 in 2013, from -276159 to 2281446 in 2014 and from -987428 to 2128891 in 2015. The mean ROA value decreased over the 3 years of analysis, from 158095.6, falling to 119943.94 in 2014 and 94614.27 in 2015, which might reflect the Brazilian economic depression.
The number of board members is, on average, 8 individuals per company, the average age of the companies was 10 years (calculation for 2013), the maximum percentage of women on boards was 33%, with a minimum of 0 and a mean of 6%, the mean age diversity was 58%, with a minimum of 28% and a maximum of 91%, the average profession diversity was 55%, with a minimum of 25% and a maximum of 100%, and the independents averaged 37%, with a minimum of 0 and a maximum of 80%. We observed that only 4 (3%) companies are state-owned; 31 (26%) proved to be holding capital companies and 84 (71%) private capital companies.
For sectoral classification, the use of complete information (as originally provided in the BOVESPA) led to a large spread of companies across small groups, often with only 1 company per group, so it was decided to consider the first sector classification instance. We observed that 31% of the companies in the sample are in the cycle consumption sector, 17% in industrial goods, 14% in financial services, and 9% in non-cyclical consumption; the remaining categories were still sparsely populated with a maximum occurrence
17 of 8 public utilities companies, 7 companies in basic materials, and 7 companies in petroleum, gas and biofuels. Table 1.1 and 1.2. provide a brief summary and statistics of all variables.
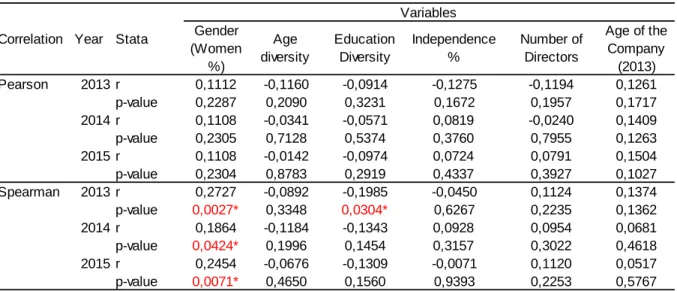
After this analysis, we then set under the bivariate analysis of the independent variables as the ROA interest variable. The analysis was performed separately for each year. Table 2.1 below provides the value of the correlation (r statistic) and the p-value of the hypothesis test that evaluates whether the correlation is statistically significant: p-values smaller than 0.05 show statistical significance.
In this bivariate analysis, no variable was observed the parametric correlation of which was statistically significant since all p-values from Pearson’s correlation were greater than 0.05, after evaluating non-parametrically a significant association between ROA in 2013 and diversity of education (p-value = 0.0304). The value of the correlation was negative (r = -0.1985), which indicated that the association is inverse; that is, the greater the diversity of education, the smaller the ROA. This relation is a small demonstration that H3 might be acceptable. (p-value 0.0027).
Variables Mean Median Standard
Deviation Min Max
95% Confid ROA 2013 158096 14 724342 -4051029 2695184 26605 ROA 2014 119944 41 380285 -276159 2281446 50910 ROA 2015 94614 49 360397 -987428 2128891 29191 Number of Directors 8,11 8 2,64 5 19 7,63 Gender (Women %) 6% 0% 9% 0% 33% 4% Age diversity 58% 58% 15% 28% 91% 55% Education Diversity 55% 56% 17% 25% 100% 52% % independence 37% 33% 19% 0% 80% 34%
Table 1.1: Discription of the Dependent and Independent Variables
Variables Category N %
Industry Cyclic Consumption 37 31
Industrial Goods 20 17
Financial services 17 14
Non-cyclical Goods 11 9
Raw material 7 6
Oil, Gas and Biofuels 7 6
Health 6 5 Information Technology 4 3 Agriculture 1 1 Telecom 1 1 Capital State 4 3 Private 84 71 Holding Private 31 26 119 100 Total
18 Another statistically significant finding was the variable gender diversity (percentage of women on boards of directors), and the significance was consistent in the 3-year analysis of 2013 value 0.0027), 2014 (p-value 0.0424) and 2015 (p-(p-value 0.0071). This fact is also a sign that H1 might be acceptable. The positive sign (r > 0) indicated that the higher that the percentage of women was, the higher that the ROA was (financial performance of the firm).
It is noteworthy that despite consistent significance in the non-parametric testing, the percentage of women was not significant in the parametric testing, which indicates that the linearity assumption of Pearson’s correlation was not satisfied, and the data did not fit this format. Thus, because the linearity assumption also occurs in the linear regression model, it is possible to conclude that categorization of this variable should be undertaken so that it can be correctly considered in the model.
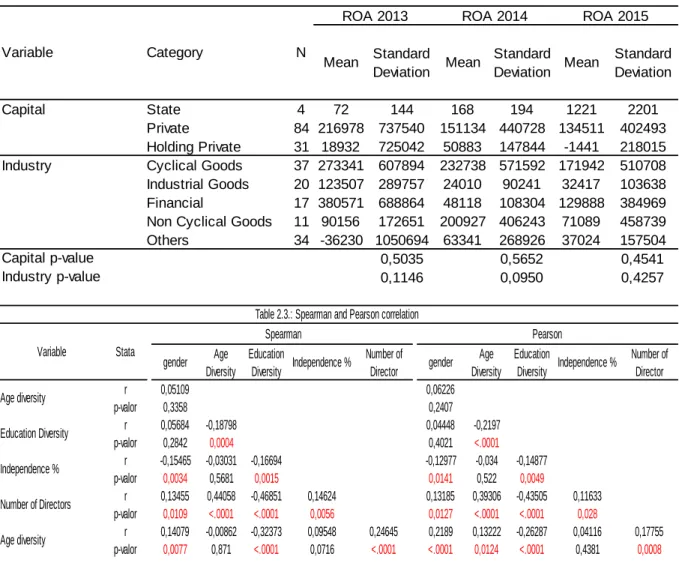
For the capital and industry variables, bivariate analysis was performed using the Kruskal-Wallis test. For the sector variable, we considered only the sectors with more than 10 companies, and the others were grouped as "others". We observed that in none of the cases was statistical significance identified since all p-values were greater than 0.05.
Gender (Women %) Age diversity Education Diversity Independence % Number of Directors Age of the Company (2013) Pearson 2013 r 0,1112 -0,1160 -0,0914 -0,1275 -0,1194 0,1261 p-value 0,2287 0,2090 0,3231 0,1672 0,1957 0,1717 2014 r 0,1108 -0,0341 -0,0571 0,0819 -0,0240 0,1409 p-value 0,2305 0,7128 0,5374 0,3760 0,7955 0,1263 2015 r 0,1108 -0,0142 -0,0974 0,0724 0,0791 0,1504 p-value 0,2304 0,8783 0,2919 0,4337 0,3927 0,1027 Spearman 2013 r 0,2727 -0,0892 -0,1985 -0,0450 0,1124 0,1374 p-value 0,0027* 0,3348 0,0304* 0,6267 0,2235 0,1362 2014 r 0,1864 -0,1184 -0,1343 0,0928 0,0954 0,0681 p-value 0,0424* 0,1996 0,1454 0,3157 0,3022 0,4618 2015 r 0,2454 -0,0676 -0,1309 -0,0071 0,1120 0,0517 p-value 0,0071* 0,4650 0,1560 0,9393 0,2253 0,5767 Stata Year Correlation Variables
19 According to the methodology, one of the assumptions of the model is that the residuals must follow a normal distribution and must be homoscedastic, and the model cannot have multicollinearity. To guarantee the normality of the data, it was necessary to treat outliers together with the transformation of the response variable. The graphs below show the presence of outliers in negative ROA values.
Mean Standard Deviation Mean Standard Deviation Mean Standard Deviation Capital State 4 72 144 168 194 1221 2201 Private 84 216978 737540 151134 440728 134511 402493 Holding Private 31 18932 725042 50883 147844 -1441 218015 Cyclical Goods 37 273341 607894 232738 571592 171942 510708 Industrial Goods 20 123507 289757 24010 90241 32417 103638 Financial 17 380571 688864 48118 108304 129888 384969 Non Cyclical Goods 11 90156 172651 200927 406243 71089 458739 Others 34 -36230 1050694 63341 268926 37024 157504
0,5035 0,5652 0,4541
0,1146 0,0950 0,4257
Industry p-value
Table 2.2: ROA's mean and standard deviation for each year in regard to Capital and Industry. Kruskal-Wallis p-value Industry ROA 2013 N Variable Capital p-value ROA 2015 Category ROA 2014 gender Age Diversity Education Diversity Independence % Number of Director gender Age Diversity Education Diversity Independence % Number of Director r 0,05109 0,06226 p-valor 0,3358 0,2407 r 0,05684 -0,18798 0,04448 -0,2197 p-valor 0,2842 0,0004 0,4021 <.0001 r -0,15465 -0,03031 -0,16694 -0,12977 -0,034 -0,14877 p-valor 0,0034 0,5681 0,0015 0,0141 0,522 0,0049 r 0,13455 0,44058 -0,46851 0,14624 0,13185 0,39306 -0,43505 0,11633 p-valor 0,0109 <.0001 <.0001 0,0056 0,0127 <.0001 <.0001 0,028 r 0,14079 -0,00862 -0,32373 0,09548 0,24645 0,2189 0,13222 -0,26287 0,04116 0,17755 p-valor 0,0077 0,871 <.0001 0,0716 <.0001 <.0001 0,0124 <.0001 0,4381 0,0008 Spearman
Table 2.3.: Spearman and Pearson correlation
Age diversity Education Diversity Independence % Number of Directors Age diversity Pearson Stata Variable
20 The treatment of outliers was conducted as follows. All ROA values below the 5th percentile (-3380) were overwritten with the percentile value (-3380). After the treatment of outliers, the analysis of the most adequate transformation for the normalization of the data was performed. The transformation that best approximated the normality of the data was the logarithmic transformation; to guarantee the calculation of the logarithm in strictly positive numbers, the transformation was given by log (x + 3400). Just for the sake of simplicity, the smallest value of ROA was considered, which is now truncated at -3380; we will report the variable responses of the model log (-3380 + 3400) = log (20).
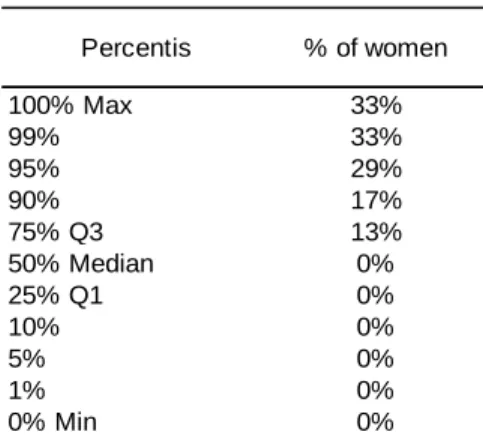
After treatment of the dependent variable, the independent variable gender diversity was transformed. This variable was transformed into a qualitative variable based on a classification rule also defined by the percentile analysis. In this case, the objective was to obtain different categories, but with a minimum number of companies in the group, we then arbitrarily defined that each group should have at least 25%
21 of the sample. Table 3 shows that 50% of companies have 0% women on the council, 25% have 0-13% women on the board, and the remaining 25% have 13% to 33%. These 3 categories were considered in modeling.
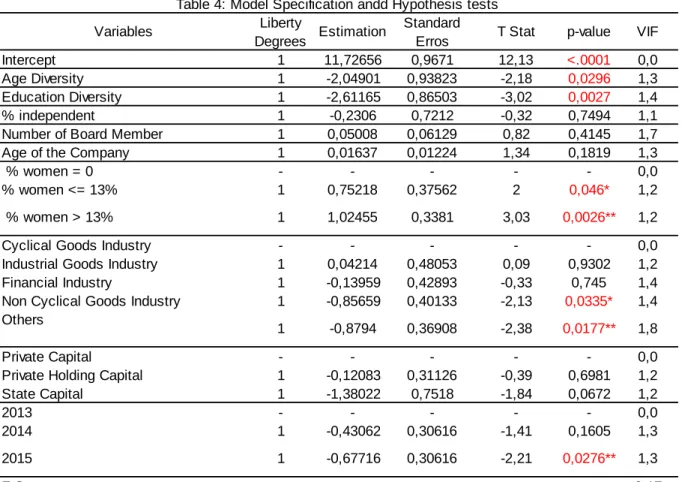
Finally, the model was adjusted. The model should be interpreted as follows: p-values less than 0.05 indicate the significance of the parameter and the signal in the case of the numerical variable indicating whether the relationship is positive or negative. For categorical cases, the interpretation is always to a reference category without an effect on the model but that represents a parameter equal to 0.
Overall assessment of the model is statistically significant (p-value ANOVA <0.001). Therefore, the variables mentioned in the model are statistically associated with ROA. However, when evaluating the value of R2, it is possible to conclude that the percentage of explanation of these variables is still low (12%), indicating that for the full explanation of the ROA, important information remains missing.
This finding is not against the objectives of this work because the objective is not to predict the ROA but to evaluate specifically its association with some information. The modeling assumptions were satisfied for normality and homoscedasticity (graphical analysis in appendix) and also for multicollinearity since we observed that the VIF values of each variable were less than 10.
Per the diversity variables of the model, we observed significance of age diversity (p-value 0.0296), and the larger that this diversity was, and the lower that the ROA was, a significant educational diversity was observed (p-value 0.0027), being larger than the diversity and lower than the ROA.
Percentis % of women 100% Max 33% 99% 33% 95% 29% 90% 17% 75% Q3 13% 50% Median 0% 25% Q1 0% 10% 0% 5% 0% 1% 0% 0% Min 0%
22 Regarding gender diversity, one of the most studied topics regarding diversity, there is significance of the percentage of women on boards of directors from a statistical point of view. Companies with up to 13% women (p-value 0.0460) have higher ROA than companies with 0% women, and companies with more than 13% women (p-value 0.00206) have higher ROA than companies with 0% women.
Finally, there is significance for the year of ROA measurement, and 2015 (p-value 0.0276) presented lower ROA than 2013, which could be the result of the Brazilian economic slowdown.
Variables Liberty
Degrees Estimation
Standard
Erros T Stat p-value VIF
Intercept 1 11,72656 0,9671 12,13 <.0001 0,0
Age Diversity 1 -2,04901 0,93823 -2,18 0,0296 1,3
Education Diversity 1 -2,61165 0,86503 -3,02 0,0027 1,4
% independent 1 -0,2306 0,7212 -0,32 0,7494 1,1
Number of Board Member 1 0,05008 0,06129 0,82 0,4145 1,7
Age of the Company 1 0,01637 0,01224 1,34 0,1819 1,3
% women = 0 - - - 0,0
% women <= 13% 1 0,75218 0,37562 2 0,046* 1,2
% women > 13% 1 1,02455 0,3381 3,03 0,0026** 1,2
Cyclical Goods Industry - - - 0,0
Industrial Goods Industry 1 0,04214 0,48053 0,09 0,9302 1,2
Financial Industry 1 -0,13959 0,42893 -0,33 0,745 1,4
Non Cyclical Goods Industry 1 -0,85659 0,40133 -2,13 0,0335* 1,4 Others
1 -0,8794 0,36908 -2,38 0,0177** 1,8
Private Capital - - - 0,0
Private Holding Capital 1 -0,12083 0,31126 -0,39 0,6981 1,2
State Capital 1 -1,38022 0,7518 -1,84 0,0672 1,2 2013 - - - 0,0 2014 1 -0,43062 0,30616 -1,41 0,1605 1,3 2015 1 -0,67716 0,30616 -2,21 0,0276** 1,3 F Stat 3,17 p-value (ANOVA) <0.0001 R2 0,12 Adusted R2 0,08
23
5. Conclusion
The ordinary least squares (OLS) for estimating the parameters in a linear regression model suggest that board gender diversity (measured in percentage of women on boards) is statically significant and positively correlated with firm performance (measure by return over assets). This result is obtained when comparing companies that have at least 13% of the members being women with companies without any women on the board. In this sense, there is empirical and statistical evidence that H1 is confirmed.
This finding is in agreement with most findings from other countries and Brazil but not in accordance with all literature and research regarding gender diversity and Boards. It is an area of research that will gain more evidence for the future (Saeed et al., 2016), especially if the law project of Senator Maria do Carmo Alves, which proposes a minimum percentage of women on boards of directors, advances in the Brazilian Congress. The reasons for this positive relationship of gender diversity and financial performance (ROA) have not yet been fully explored. A potential explanation for a favorable view of gender diversity is that it provides companies with a different perspective with at least one director being female. Appointing female directors can provide benefits to the companies for its stakeholders (Torchia et al., 2011). Providing legitimacy is related to in gender diversity since female directors can be a source of a valuable form of legitimacy before stakeholders. In addition, consumer-centric business are more inclined to appoint female directors (Brammer et al., 2007).
A range of factors can be identified as motivators for appointing appointing women to boards (van der Walt & Ingley, 2003). These factors include changing demographic trends and the available pool of suitability qualified candidates, their individual characteristics and a variety of situational factors (Bilimoria, 2000; Burke, 1997). On the other hand, age diversity (measured in tranches) and educational diversity (measured as the Bachelor’s degree of each individual, e.g., engineers, lawyers, etc.) are correlated negatively with firm performance because its estimator is negatively correlated to ROA. Both H2 and H3 are confirmed.
As mentioned previously, studies regarding diversity of board members in Brazil have been scarce. The reasons age diversity (measured in tranches) and educational diversity are correlated negatively with firm performance are also unknown, but prior research in Brazil (Fraga & Silva, 2012) has demonstrated that there is a negative relationship between the diversity of board members’ areas of education and the performance of the company. These results are consistent with those of the study of (Hafsi & Turgut, 2013), who found a negative association between age diversity and corporate social performance.
24 One aspect that could explain the reason there is negative performance is that the mean years of education is typically relatively high on corporate boards of directors, and this fact might be a future area of study. Most board tables have been shared by middle to retirement aged members who have previously served as executives of other companies in the same industry. This perception, however, is slowly changing, and there is active promotion of age diversity to encourage the different perspectives of different age groups as an integral part of succession planning (Kang et al., 2007).
A phenomenon that was previously reported that might explain why greater diversity in terms of age and education leads to poor financial performance is social identity theory (Tajfel & Turner, 1979), which can provide psychological groupings of younger board directors and older board directors, triggering negative group behaviors. According to social identity theory, people tend to classify themselves and others into various social categories, such as organizational membership, religious affiliation, gender, and age cohort. Therefore, boards might be divided into “them” and “us” based on a process of social categorization (i.e., age, education).
Other researchers suggested that diversity could potentially be a disadvantage in terms of group performance. For example, (Hambrick, Cho, & Chen, 1996) conducted a longitudinal study on the effects of diversity on top management team performance in 32 major US airlines. Diversity was measured by functional, educational and tenure heterogeneity. Their findings indicated that homogeneous top-management teams actually outperformed heterogeneous teams. The explanation that they offered was that individuals were more likely to disagree when in a heterogeneous group, thereby weakening team consensus. (Knight et al., 1999) also found that demographic diversity was negatively correlated with consensus. They further suggested that greater time and effort were necessary for heterogeneous teams to reach decisions, ultimately reducing team performance. Finally, the potential negative effects regarding age and education diversity could be due to the difficulty of integrating these resources into an effective harmonized group or team. H4 is neither confirmed nor rejected.
Considering that the p-value of the regression is high, there are only a few possibilities to explain whether there is any relationship. However, we would expect a positive relationship since agency theory promotes the need for boards to be as independent as possible to be effective in monitoring and controlling top management and to be protectors of stakeholders and shareholders’ value. It appears that there is evidence for the effects of diversity on group performance. Diversity both enhances performance by increasing decision-making capacity in terms of gender (presence of women on boards), but it detracts from group performance by increasing conflict or group segmenting in terms of age and education. From a business perspective, we have verified that gender diversity is importance and whenever electing board members, shareholders should be aware of the impact of the profile of each board member in order to allow a better distribution of talent among the Board.
25
6. Limitations
There are important limitations that must be addressed. The limitation that might be the most important, assuming that the board of directors of a company is responsible for the long-term strategy of the firm, is that we are analyzing a relatively short period to identify the effects of the diversity of the board.
Second, the sample is drawn from large Brazilian companies listed on the Novo Mercado, which is a specific corporate segment (with more corporate governance rules), and the results might not generalize to smaller companies or companies with different corporate governance. Future research is needed to address diversity at board of director levels and its impact on organizational performance for smaller companies or even to expand this impact to all BOVESPA-traded companies.
Third, the regression analysis in this study suggests that there is a linear relationship between diversity and financial performance. The literature advises that board members characteristics are not exogenous random variables (Sila, 2007). Instead, these variables can be endogenously chosen by firms in accordance with their preferences, the market availability of directors, the desire to maximize the shareholders’ value and the bargaining power of various stakeholders in the firm. In this sense, Fama and Jensen (1983) argued that board characteristics are influenced by the scope and complexity of the firm. Therefore, to verify the impacts of gender, age, education and independence on firm performance, at least two alternative explanations must be considered: that the characteristics of the board members are driven by omitted unobserved factors or by reverse causality.
Fourth, it is important to emphasize that there are significant differences across countries regarding corporate governance due to political, legal and cultural aspects. Consequently, whenever comparing studies between countries, the differences and the functions of the boards of directors in each country should be considered. In some countries, there is a two-tier board system (Germany, for example) consisting of a supervisory board, which means that the board has no executive functions. In other countries such as Brazil with unitary board systems, the board has a broader competence in that it establishes the general framework for the management of the institution. Therefore, the assumptions made in this paper, based on previous discussions in other countries, especially in the hypothesis development section, could present a limitation.
Finally, another limitation to this article is that the study of board diversity often relies on surface-level measurements of diversity, such as gender, race, and age. It does not consider attributes of deep-level diversity related to differences in backgrounds, personalities, value systems, and other individual characteristics. This fact could be critical in comparing the results from different countries regarding diversity. There is definitely room for a better qualitative analysis of board composition, but it will be necessarily costly (in terms of money and time) to conduct research to evaluate the psychological profiles of board members and to compare them with the results.
26
References
Abdullah, S. N., & Ismail, K. N. I. K. (2013). Gender, ethnic and age diversity of the boards of large Malaysian firms and performance. Jurnal Pengurusan, 38, 27–40.
Adams, R. B., & Ferreira, D. (2004). Gender Diversity in the Boardroom. Finance Working Paper, (November), 1–35. https://doi.org/10.2139/ssrn.594506
Adams, R. B., & Ferreira, D. (2009). Women in the boardroom and their impact on governance and performance. Journal of Financial Economics, 94(2), 291–309.
https://doi.org/10.1016/j.jfineco.2008.10.007
Ali, M., Ng, Y. L., & Kulik, C. T. (2013). Board Age and Gender Diversity: A Test of Competing Linear and Curvilinear Predictions. Journal of Business Ethics, 1–16. https://doi.org/10.1007/s10551-013-1930-9
Ararat, M., Aksu, M., & Tansel Cetin, A. (2015). How board diversity affects firm performance in
emerging markets: Evidence on channels in controlled firms. Corporate Governance (Oxford), 23(2), 83–103. https://doi.org/10.1111/corg.12103
Baysinger, B. D., & Butler, H. N. (1985). Corporate governance and the board of directors: Performance effects of changes in board composition. Journal of Law, Economics, & Organization, 1(1), 101–124. https://doi.org/10.2307/764908
Bilimoria, D. (2000). Building the business case for women corporate directors. Women on Corporate
Boards of Directors: International Challenges and Opportunities, 25–40.
https://doi.org/10.1007/978-90-481-3401-4_3
Bilimoria, D. (2006). The Relationship Between Women Corporate Directors and Women Corporate Officers. Journal of Managerial Issues, 18(8), 17. https://doi.org/10.2307/40604524
Brammer, S., Millington, A., & Pavelin, S. (2007). Gender and Ethnic Diversity Among UK Corporate Boards. Corporate Governance : An International Review, 15(2), 393–403.
https://doi.org/10.1111/j.1467-8683.2007.00569.x
Burke, R. J. (1997). Women Directors : selection , acceptance and benefits of board membership.
Corporate Governance: An International Review, 5(3), 118–125.
https://doi.org/10.1111/1467-8683.00052
Buse, K., Bernstein, R. S., & Bilimoria, D. (2016). The Influence of Board Diversity, Board Diversity Policies and Practices, and Board Inclusion Behaviors on Nonprofit Governance Practices. Journal of
Business Ethics, 133(1), 179–191. https://doi.org/10.1007/s10551-014-2352-z
Cadbury, A. (1992). Cadbury Report: The Financial Aspects of Corporate Governance. Science.
Carter, D. A., D’Souza, F., Simkins, B. J., & Simpson, W. G. (2010). The gender and ethnic diversity of US boards and board committees and firm financial performance. Corporate Governance, 18(5), 396– 414. https://doi.org/10.1111/j.1467-8683.2010.00809.x
Carter, D. A., Simkins, B. J., Simpson, W. G., Borokhovich, K., Crutchley, C., Elson, C., … Longhofer, S. (2003). Corporate Governance, Board Diversity, and Firm Value. The Financial Review, 38, 33–53. https://doi.org/10.1111/1540-6288.00034
Dagsson, S., Larsson, E., & Sällberg, H. (2011). How age diversity on the board of directors affects firm performance. MS Thesis, 1–61.
de Jonge, A. (2015). The Glass Ceiling in Chinese and Indian Boardrooms. The Glass Ceiling in Chinese and
Indian Boardrooms. https://doi.org/10.1016/B978-1-84334-617-3.00002-8
Denis, D., & McConnell, J. (2003). International corporate governance. Journal of Financial and …, 38(1), 1–36. https://doi.org/10.2307/4126762
Devillard, S, Sancier-Sultan, S., & Werner, C. (2014). (2014). Why gender diversity at the top remains a challenge. McKinsey Quarterly, 2, 23–25.
27 GAP or Institutional Investor Bias? North Carolina Law Review, 89(2007), 809–838.
https://doi.org/110.1163/22112596-01702003
Erhardt, N. L., Werbel, J. D., & Shrader, C. B. (2003). Board of director diversity and firm financial performance. Corporate Governance, 11(2), 102–111. https://doi.org/10.1111/1467-8683.00011 Fama, E. F., & Jensen, M. C. (1983). Separation of Ownership and Control Separation of Ownership and
Control. Journal of Law and Economics, 26(2), 301–325. https://doi.org/10.1086/467037 Fraga, J. B., & Silva, V. A. B. (2012). Diversidade no conselho de administração e desempenho da
empresa: uma investigação empírica. Brazilian Business Review, (11), 58–80.
Freeman, R. E. (1984). Strategic management: A stakeholder approach. Freeman Edward (Vol. 1). https://doi.org/10.2139/ssrn.263511
Goodstein, J., Gautam, K., & Boeker, W. (1994). The effects of board size and diversity on strategic change. Strategic Management Journal, 15(3), 241–250. https://doi.org/10.1002/smj.4250150305 Grund, N. E., & Fombrun, C. J. (1996). Reputation: Realizing value from the corporate image. Academy of
Management Perspectives (Vol. 10). https://doi.org/10.5465/AME.1996.9603293245
Hafsi, T., & Turgut, G. (2013). Boardroom Diversity and its Effect on Social Performance: Conceptualization and Empirical Evidence. Journal of Business Ethics, 112(3), 463–479. https://doi.org/10.1007/s10551-012-1272-z
Hambrick, D. C., Cho, T. S., & Chen, M.-J. (1996). The influence of top management team heterogeneity on firms’ competitive moves. Administrative Science Quarterly, 41(4), 659–684.
https://doi.org/10.2307/2393871
Helland, E., & Sykuta, M. (2005). Who’s monitoring the monitor? Do outside directors protect shareholders’ interests? The Financial Review, 40(2), 155–172. https://doi.org/10.1111/j.1540-6288.2005.00098.x
IBGC. (2016). Perfil dos Conselhos de Administração.
J.m.wooldridge. (2011). Introductory Econometrics. Journal of contaminant hydrology (Vol. 120–121). https://doi.org/10.1016/j.jconhyd.2010.08.009
Janis, I. L. (1973). GROUPTHINK AND GROUP DYNAMICS: A SOCIAL PSYCHOLOGICAL ANALYSIS OF DEFECTIVE POLICY DECISIONS. Policy Studies Journal, 2(1), 19–25. https://doi.org/10.1111/j.1541-0072.1973.tb00117.x
Jensen, M. C., & Meckling, W. H. (1976). THEORY OF THE FIRM: MANAGERIAL BEHAVIOR, AGENCY COSTS AND OWNERSHIP STRUCTURE Michael C. JENSEN and William H. MECKLING·. Journal of Financial
Economics, 3, 305–360.
Jhunjhunwala, S., & Mishra, R. K. (2012). Board Diversity and Corporate Performance: The Indian Evidence. The IUP Journal of Corporate Governance, XI(3), 72–79.
Joy, L., Carter, N. M., Wagner, H. M., & Narayanan, S. (2007). The Bottom Line : Corporate performance
and women’ s representation on boards. Catalyst. Retrieved from
http://www.catalyst.org/knowledge/bottom-line-corporate-performance-and-womens-representation-boards
Kang, H., Cheng, M., & Gray, S. J. (2007). Corporate governance and board composition: Diversity and independence of Australian boards. Corporate Governance, 15(2), 194–207.
https://doi.org/10.1111/j.1467-8683.2007.00554.x
Kathy Rao, K., Tilt, C. A., & Lester, L. H. (2012). Corporate governance and environmental reporting: an Australian study. Corporate Governance, 12(2), 143–163.
https://doi.org/10.1108/14720701211214052
Keylock, C. J. (2005). Simpson diversity and the Shannon-Wiener index as special cases of a generalized entropy. Oikos. https://doi.org/10.1111/j.0030-1299.2005.13735.x
Knight, D., Pearce, C. L., Smith, K. G., Olian, J. D., Sims, H. P., Smith, K. a, & Flood, P. (1999). Top management team diversity, group process, and strategic consensus. Strategic Management
28
Journal, 20(July 1998), 445–465.
https://doi.org/10.1002/(SICI)1097-0266(199905)20:5<445::AID-SMJ27>3.0.CO;2-V
La Porta, R., Lopez-de-Silanes, F., Shleifer, A., Vishny, R., Porta, R. La, & Lopez-de-Silanes, F. (2000). Investor protection and corporate governance. Journal of Financial Economics, 58(1–2), 3–27. https://doi.org/10.1016/S0304-405X(00)00065-9
Lazzaretti, K., Kleinübing Godoi, C., Parodi Oliveira Camilo, S., & Marcon, R. (2013). Gender diversity in the boards of directors of Brazilian businesses. Gender in Management: An International Journal,
28(2), 94–110. https://doi.org/10.1108/17542411311303239
Liu, Y., Wei, Z., & Xie, F. (2014). Do women directors improve firm performance in China? Journal of
Corporate Finance, 28, 169–184. https://doi.org/10.1016/j.jcorpfin.2013.11.016
Lopes, I. T., Ferraz, D. P., & Martins, M. M. (2016). The influence of diversity on boards on profitability: An overview across iberian non-financial listed companies. Corporate Ownership and Control. Lopes, I. T., Ferraz, D. P., & Rodrigues, A. M. G. (2016). The drivers of profitability in the top 30 major
airlines worldwide. Measuring Business Excellence, 20(2), 26–37. https://doi.org/10.1108/MBE-09-2015-0045
Low, D. C. M., Roberts, H., & Whiting, R. H. (2015). Board gender diversity and firm performance: Empirical evidence from Hong Kong, South Korea, Malaysia and Singapore. Pacific-Basin Finance
Journal, 35, 381–401. https://doi.org/10.1016/j.pacfin.2015.02.008
Lückerath-Rovers, M. (2013). Women on boards and firm performance. Journal of Management and
Governance, 17(2), 491–509. https://doi.org/10.1007/s10997-011-9186-1
Macus, M. (2008). Board Capability; An Interactions Perspective on Boards of Directors and Firm Performance. International Studies of Management and Organization, 38(3), 98–116. https://doi.org/10.2753/IMO0020-8825380304
Marimuthu, M., & Kolandaisamy, I. (2009). Ethnic and Gender Diversity in Boards of Directors and Their Relevance to Financial Performance of Malaysian Companies. Journal of Sustainable Development,
2, 139–148. https://doi.org/10.5539/jsd.v2n3p139
McKinsey & Company. (2007). Women Matter. Forum American Bar Association, 1–28. https://doi.org/10.1016/S0899-9007(99)00064-7
Mínguez-Vera, A., & Martin, A. (2011). Gender and management on Spanish SMEs: an empirical analysis.
The International Journal of Human Resource Management, 22(14), 2852–2873.
https://doi.org/10.1080/09585192.2011.599948
Munisi, G., Hermes, N., & Randoy, T. (2014). Corporate boards and ownership structure: Evidence from Sub-Saharan Africa. International Business Review, 23(4), 785–796.
https://doi.org/10.1016/j.ibusrev.2013.12.001
Nekhili, M., & Gatfaoui, H. (2013). Are Demographic Attributes and Firm Characteristics Drivers of Gender Diversity? Investigating Women’s Positions on French Boards of Directors. Journal of
Business Ethics, 118(2), 227–249. https://doi.org/10.1007/s10551-012-1576-z
Nguyen, T., Locke, S., & Reddy, K. (2015). Does boardroom gender diversity matter? Evidence from a transitional economy. International Review of Economics and Finance, 37, 184–202.
https://doi.org/10.1016/j.iref.2014.11.022
OECD. (2015). OECD Principles of Corporate Governance. World, 46. https://doi.org/10.1787/9789264015999-en
Pearce II, J. a., & Zahra, S. a. (1992). Board Composition From a Strategic Contingency Perspective.
Journal of Management Studies (Vol. 29). https://doi.org/10.1111/j.1467-6486.1992.tb00672.x
Pfeffer, J., & Salancik, G. R. (1978). The External Control of Organizations: A Resource Dependence
Perspective. Academy of Management Review (Vol. 4). Retrieved from
http://search.epnet.com/login.aspx?direct=true&db=buh&an=4289039