FUNDAÇÃO GETULIO VARGAS
ESCOLA DE ADMINISTRAÇÃO DE EMPRESA DE SÃO PAULO
ANA CAROLINA TALARICO
The Relationship Between Board of Director’s Nationality Diversity and Financial Performance
ANA CAROLINA TALARICO
The Relationship Between Board of Director’s Nationality Diversity and Financial Performance
Dissertação apresentada a Escola de Administração de Empresas de São Paulo da Fundação Getulio Vargas, como requisito para a obtenção do título de Mestre em Administração de Empresas
Campo de Conhecimento: Gestão Internacional
Orientador: Prof. Gilberto Sarfati
Talarico, Ana Carolina.
The Relationship Between Board of Director’s Nationality Diversity and Financial Performance / Ana Carolina Talarico. - 2013.
59 f.
Orientador: Gilberto Sarfati
Dissertação (MPGI) - Escola de Administração de Empresas de São Paulo.
1. Diversidade no ambiente de trabalho. 2. Multiculturalismo. 3. Eficiência organizacional. 4. Desempenho. I. Sarfati, Gilberto. II. Dissertação (MPGI) - Escola de Administração de Empresas de São Paulo. III. Título.
ANA CAROLINA TALARICO
The Relationship Between Board of Director’s Nationality Diversity and Financial Performance
Dissertação apresentada a Escola de Administração de Empresas de São Paulo da Fundação Getulio Vargas, como requisito para a obtenção do título de Mestre em Administração de Empresas
Campo de Conhecimento: Gestão Internacional
Data de Aprovação:
__/__/__
Banca Examinadora:
______________________
Prof. Gilberto Sarfati (Orientador) EAESP – FGV
______________________
Prof. Germano Glufke Reis EAESP - FGV
______________________
Prof. Guilherme Rhinow Diretor Janssen-Cilag
“'Cause a little bit of summer's what the whole year's all about” John Mayer
ACKNOWLEDGEMENTS
This thesis represent the end of a great period of my life; from the decision to do a Masters to today, I never had a doubt it was the best decision I could have made.
I would like to thank my family for all the support, in everything and in all ways possible.
I would like to thank each and everyone that I met along the way these last two years, you all contributed to getting here, and for making this experience unforgettable.
I would also like to thank my supervisor, Prof. Gilberto Sarfati.
And finally, to everyone that helped me achieve this and be so proud of it, thank you!
ABSTRACT
Companies are moving to a more international structure; going into new markets and having an increased competition in all fronts. Therefore, the practices that lead companies to a more efficient and competitive position are praised. The management of the workforce comes as one of the main concerns of companies, aiming at performance enhancing and at creating better environments that both attract and maintain the professional talents. In an increasingly international environment, companies tend to look for the specialists and best professionals, regardless of their nationality. This new structure with several different nationalities working together poses new challenges for companies. Understanding if and how a more diverse company has a relationship with financial performance is the starting point for better managing this new corporate structure.
RESUMO
As empresas estão mudando para uma estrutura mais internacional; entrando em novos mercados com competição mais acirrada. Portanto, as práticas que levam as empresas a serem mais eficientes e competitivas são exaltadas. O gerenciamento da força de trabalho é uma das maiores preocupações das companhias, com foco em melhorar a performance e criar melhores ambientes de trabalho, que atraem e mantem os talentos. Em um ambiente cada vez mais internacional, as empresas buscam os melhores profissionais, independente de sua nacionalidade. Essa nova estrutura com diferentes nacionalidades trabalhando junto é um novo desafio no mundo corporativo. Entender se e como uma empresa com maior diversidade tem relação com a performance financeira é o ponto de partida para um melhor gerenciamento dessa nova estrutura.
Palavras-chave: Diversidade no trabalho; multiculturalismo, eficiência
Table of Contents
ACKNOWLEDGEMENTS ... 6
LIST OF TABLES ... 10
LIST OF FIGURES ... 10
1. Introduction ... 11
2. Literature review ... 13
2.1 Internationalization evolution ... 13
2.2 Diversity ... 14
2.3 Diverse group dynamics ... 15
2.4 Board of directors as representative of performance ... 21
2.4.1 Agency theory ... 22
2.5 Researches conducted on diversity and performance ... 23
3. Methodology ... 27
3.1 Data Sample ... 27
3.2 Methods ... 28
4. Results and Analysis ... 31
4.1 Sample Overview ... 31
4.2 Statistical Analysis ... 36
4.2.1 Correlation ... 36
4.2.2 Correlation matrix ... 37
4.2.3 Regression ... 39
4.2.4. Regression with dummy variables ... 41
4.2.5 Regression with all dummy variables ... 41
5. Conclusion ... 44
6. Limitations and future research ... 48
6.1 Variables drawbacks and limitations ... 48
6.2 Future Research ... 50
LIST OF TABLES
Table 1: Correlation matrix………..37
Table 2: ROI and board diversity regression………38
Table 3: ROA and board diversity regression………..39
Table 4: Regression with dummy variables………..42
LIST OF FIGURES
Figure 1: Diversity impact on performance framework………...17Figure 2: Industries data distribution………...31
Figure 3: Frequency distribution of board size (number of members)……...31
Figure 4: Companies’ diversity percentage distribution………..32
Figure 5: Non-local directors distribution through board size………33
Figure 6: Industries average nationality diversity of the board of directors….33 Figure 7: Non-local directors distribution of continents………...34
Figure 8: Non-local directors distribution of countries……….34
Figure 9: ROI linear correlation………..35
1. Introduction
An increasingly global market with intense competition is leading companies to review their strategy and look for ways to stand out from their competitors with the most efficient practices. Among these concerns, the management of the workforce is significantly on top management’s agenda and discussions (Uma, 2011).
On the workforce field, diversity is the most popular topic; being internationalization strategies and increased mobility the main influences that have turned companies into “transnational companies” (Veen & Elbertsen, 2008).
A survey with Human Resources (HR) and diversity specialists to assess how they defined diversity gathered a diverse collection of definitions with over 70% of the respondents affirming that their organizations didn’t have an official diversity definition (Anand & Winters, 2008).
The growing diversity of employees has increased the attention of companies to understand the dynamics of diverse groups, and improve the management of the workforce, avoiding conflicts and other issues and increasing the company’s performance.
Many studies on diversity on the corporate world have been published, focusing on the increase of women and minorities presence in the organizations (Carpenter, 2002; Carter, Simkins & Simpson, 2003; Roberson & Park, 2007).
The debate about such diversity has been extensively explored, with insights both on the benefits of diversity and the disadvantages of diverse teams (Ruigrok, Peck, & Tacheva, 2007; Zhara, Ireland & Hitt, 2000).
However there is not an extensive literature on nationality diversity and the relationship that it has on the company’s financial performance. With a gap on the literature identified and a latent need of understanding the dynamics of diversity from within organizations, this paper proposes to contribute to this field.
Fortune 500 list, correlating their nationality diversity percentage with financial measures, in order to observe if there is any relationship that can be drawn from there.
This study aimed also at highlighting the importance of nationality diversity on companies, and expects that it bring attention to the issue at hand, enlightening nationality diversity dynamics when performance is considered. The paper is structure with a first section of literature review that states the trend of diversity inside companies, going into some of the diversity studies that have been published, together with the conclusions present on the literature so far.
Subsequently, the data sample is detailed, as well as methodology applied on these companies’ data; scrutinizing the statistical methods and the explaining the choices made. These data gathered is then thoroughly described on the analysis section, together with the results on the statistical correlations and regressions.
Finally, the paper presents its conclusion, answering the question posed, if there is an established relationship between nationality diversity on board of directors and the companies’ financial performance.
Bearing in mind all the choices of data and statistical models, as well as the specific focus on board of directors nationality diversity; the paper finishes with limitations and suggests on future research on the subject.
2. Literature review
2.1 Internationalization evolution
Nowadays, it is of high importance for companies to manage their workforce in order to achieve the best performance. In an evermore-aggressive environment, with commerce across borders and intense competitive domestic and global markets the ability to manage diversity, and specially a cross-cultural one, has become one of the key factors for success (Uma, 2011).
Multinational companies are a driving force of the globalization and internationalization process. With internationalization strategies, there are changes on geographical focus that leads to a more diverse workforce (Veen & Elbertsen, 2008). Veen and Elbertsen believe that will turn companies into “transnational companies” the term that Bartlett and Ghoshal (1998) conned in their earlier work.
Increased mobility is also an important factor that contributed to the development of corporate diversity. According to Johnston (1991) the growing gap between skilled workforce and opportunities will intensify companies’ attempts of finding skills across borders.
More global markets, technological developments, actions towards economic integration between nations and a fierce international competition have lead to an internationalization of business (Heijltjes, Olie, & Glunk, 2003).
The increase in diversity inside companies has reached a point in which managers cannot ignore it, thus understanding diverse group dynamics and how diversity can influence and enhance performance has become a current discussion on corporations (Maznevski, 1994).
2.2 Diversity
Milliken and Martins (1996) confronted with multiple and confused ideas of diversity, define diversity as simply “variety or a point or respect in which things differ”.
Diversity can be described as difference in a certain aspect. The main aspect used to describe and differentiate is the demographic diversity, as gender, race, education, background, and marital status, among others. It can also be related to non-demographic variables, among them values, attitudes, affect, network ties, salary (Cummings, 2004).
Diversity dimensions can also be classified between task-related and relations-oriented, being the first characteristics such as age, gender, nationality, and for the relations-oriented attributes such as education, functional background and tenure (Ruigrok, Peck, & Tacheva, 2007).
Harrison and Klein (2007) have developed a diversity typology, with which the authors believe much of the confusion and blurred definition of diversity can be avoided. The authors propose to divide diversity in three points:
separation, variety and disparity.
In this framework, separation is the difference in position or opinion between members; variety is the difference in category such as information, knowledge or experience; and finally disparity is the difference in valued social assets or resources (Harrison & Klein, 2007).
2.3 Diverse group dynamics
The conclusions on diverse group dynamics are not consistent, and there are both positive and negative points on heterogeneity and working groups, as stated by Hambrick, Cho and Chen (1996) heterogeneous groups can be a double edged sword. The next section will expose both sides.
In her research on workforce diversity, Lockwood (2005) highlights the findings on the benefits of diversity to organizational strategic goals and objectives (Lockwood, 2005, p.3):
- greater adaptability and flexibility in a rapid changing market;
- attracting and retaining the best talents;
- reducing costs associated with turnover , absenteeism and low
productivity;
- return on investment (ROI) from various initiatives, policies and
practices;
- gaining and keeping greater market share (locally and globally);
- increased sales and profitability.
Team diversity is expected to increase the knowledge, due to different experiences and backgrounds, and thus also increase creativity and innovation. “Increasing diversity on the boards leads to more varied ideas, perspectives and networks, which, in turn, increase innovation” (Miller & Triana, 2009, p.764).
While bringing more knowledge and increased idea creation, diverse groups can also decrease efficiency on decision-making, slowing decisions and actions, affecting the company’s competitive advantage.
On stable scenarios, homogeneous groups are expected to outperform heterogeneous ones, due to the discussions that take place on the second group, where so many different thoughts and experiences clash, leading to a longer time to reach consensus between members (Hambrick et al., 1996). However, in their analysis of the US airline companies, Hambrick et al. (1996) concluded that the disadvantages of a diverse top management teams were offset by its benefits in an industry that was passing through a turbulent period. They observed that heterogeneous groups were braver on the strategic actions they took.
Also considering a turbulent industry, of the health care in the period of 1980-85, Goodstein, Gautam and Boeker (1994) explored the role of board of directors in strategic decisions to adapt and succeed in such an unstable and changing environment. Their results were not significantly supported by the statistical analysis, even initiating the discussion of diverse management team inability to respond to competitors move.
Eisenhardt (2013) conducted an analysis of the role of the top management team on entrepreneurial firms, going specifically on the impact of heterogeneous management on the success of these new constituted companies. Groups with a wider and distinct knowledge were able to positively overcome the liability of newness characteristic of modern new companies.
The liability of newness is related to the challenges new companies have to
overcome their initial years to succeed. These companies, due to its size and lack of experience, face issues to access financial support and to build a consistent network (Carayannopoulos, 2009).
don’t avoid the conflict between members, but try to combine knowledge and experience sharing with fast decision making.
However, Carpenter (2002) used in his analysis of diversity benefits on firm performance the internationalization level as a source of managerial complexity and arrived at divergent results, observing that on low internationalization levels heterogeneous groups were beneficial, but had a negative impact on high level of complexity.
It also supports companies in entering to new markets, as the different backgrounds of the members can bring insights and local knowledge for the expansion strategy (Espinoza, 2007).
Pelled et al. (1999) draw the relationship between diverse groups and conflict – task and emotional conflict – these conflicts tend to be stronger in non-routine tasks, where opinions are more often exchanged and discussions are encouraged. However, the relationship between conflict and performance of diverse groups was not satisfactory observed in the study, as the authors concluded that many factors can influence the conflict and in turn the performance.
Diverse groups lead to discussion and commonly misunderstand between members, that can increase the decision-making process, taking longer to reach a consensus. Maznevski (1994) closely examined a small group of studies and concluded that communication can enhance diversity in a group, integrating the differences. The author developed a model using social science, that educates groups to spot communications problems and provides knowledge to overcome this issue.
Going further, Simons et al. (1999) observed that the diversity of a group can only be used to its full potential if debate is stimulated between the members. In the authors view, “without a debate a team’s diversity may remain an untapped resource, existing but never used” (Simons et al., 1999, p. 664). The debate should present new arguments, so that members confronted with different visions and experiences, reassess their position, and with that are able to reach better decisions, thus enhancing their performance.
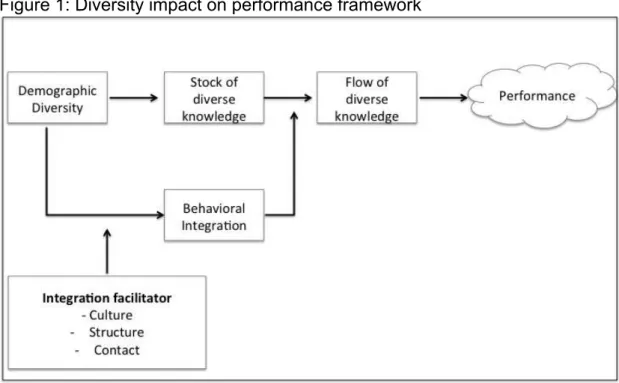
division between “stock of diverse knowledge” and “flow of diverse knowledge”; while the first accounts only for the level of diversity in a company, the second is actually the proper use of diversity for enhancing the firm performance.
The authors analyzed the influences the organization can have on diversity integration, leading to a higher flow of diverse knowledge, which, in turn, influences the performance; they reached a conceptual framework, presented below:
Figure 1: Diversity impact on performance framework
Source: elaborated by the author based on Hyung-Jin and Overby (2012)
Maznevski (1994) concluded that groups with high diversity and high integration perform better than groups with low diversity, however groups with high diversity and low integration perform worse than groups with lower diversity (Maznevski, 1994).
members. According to the authors, people may hold prior biases against each other and have stereotypes that can influence the dynamics and quality of decision-making.
If at first diverse groups can face communication and integration problems, and have a lower performance than homogeneous groups, by analyzing weekly productivity reports from a Koret Corporation in Napa, California; Hamilton, Nickerson and Owan (2003) observed that the gains these diverse groups had during the period they worked closely more then offset the initial losses due to diversity issues.
As a solution to the issue of measuring companies’ diversity of employees, Roberson and Park (2007) used the diversity reputation as a variable to analyze the impact of diversity on financial performance, using the Fortune magazine list of best companies for minorities, with positive results for the diversity variable on the performance. For diversity reputation, the authors observed that the impact on firm performance derives from capital markets, while leadership diversity impacts on the product market, influencing directly the company performance and efficiency.
Miller and Triana (2009) also explored the diversity reputation aspect of companies, the authors found a positive relationship between board racial diversity and the firm reputation, they also found that having a more diverse board signals the market that the company is well equipped to succeed in a challenging environment, with the knowledge and expertise needed to stand out from competitors.
Still on the dynamics of diverse groups, Lau and Murnighan (1998) introduced the concept of faultlines, which is a division of members within a group in subgroups on the basis of one or more attributes, that can affect the group communication and their functioning mode. That contributes to the argument that heterogeneous groups demand a higher effort form managers to integrate the members and create a harmonious environment for teamwork.
classes, intercultural training, and diversity workshops; however what Podsiadlowski et al. (2013) observed was that many companies do not have a formal and institutionalized diversity management, and most of the actions are actually focused on expatriates and their adaptation or isolated actions rather then on the diversity integration on the company.
If in the one hand, companies will need to make an investment on integration programs for diversity, this cost will prevent other costs in the future, which companies that do not succeed in integrating diverse members will undoubtedly incur related to turnover and absenteeism; Carter, Simkins and Simpson (2003) considers that companies that have a successful integration process have indeed a cost advantage.
The main difficulty on using diverse groups to develop studies and analysis lies on the challenge to gather comparable data across companies or countries. In order to reach conclusions on the performance of homogeneous and heterogeneous groups on tasks, it is necessary to have similar tasks, which is not always the case on different companies (Maznevski, 1994).
Most of the research over group diversity has been done on the organizational behavior field, and explore either the positive or negative side of diverse groups; Knippenberg et al. (2004) developed an integrative model, the categorization-elaboration model (CEM) that combines both the positive and negative effects of diversity, and more importantly, lighting the moment on which the diversity can be a advantage or disadvantage.
2.4 Board of directors as representative of performance
Top management teams, such as board of directors, have a direct impact on the company’s culture, strategies adopted and on its performance. Through the Upper Echelons model, Hambrick (2007) were able to observe that the background of managers impacted organizational outcomes.
The authors explored the influence of management age, functional track, career experiences, formal education, socioeconomic background, financial position and the group heterogeneity had on the corporate strategy and decisions made; and established a direct relationship between them.
Hambrick and Mason (1984) were the pioneers in creating and exploring this model, focusing mainly on psychology and social psychology to develop it. After that, several authors have researched deeper on the Upper Echelons and influence on corporations (Carpenter, Geletkanycz & Sanders, 2004; Patzelt, Knyphausen-Aufseß & Fischer, 2009; Sosik, Gentry & Chun, 2011). Studies over the diversity of board of directors and the performance of companies have increased over time, with the increase of mobility of employees and a higher globalization, making companies expand their operation areas, and increase their transnational mindset. Bartlet and Ghoshal (1998) coined the term transnational mindset, stating that the company’s ability to integrate internationally is due to its management heritage. The authors also found in their analysis that companies with an transnational mindset have higher performance.
2.4.1 Agency theory
When discussing the board of director’s role, one often stumbles upon the agency theory, in which the board should control and monitor managers and mostly, the conflict of interests between manager and shareholders.
Fama and Jensen (1983) exposed the agency problem, recapitulated by Bebchuk and Fried (2003) on their discussion over Executive Compensation, that is, the problem of separation between ownership and control, to address this issue it is necessary to create decision mechanisms that separate the management and control.
Among actions that can be taken to avoid agency problems, the authors listed:
- decision hierarchies, in which decisions pass through different
levels for ratification and monitoring;
- board of directors with the role of ratifying and monitoring the
most important decisions and;
- structures that nurture the mutual monitoring among decision
agents.
The main characteristic needed of boards for perform this task is independence, many studies have debated about number of outside directors, but relating to independency, having a diverse board of directors should contribute to this field of study, since it tends to increase independence versus a more traditional board, as different backgrounds and experiences should lead to more discussion and questioning (Carter et al., 2003).
2.5 Researches conducted on diversity and performance
Studies on diverse group dynamics have evolved from the criteria of diversity to the effects of diversity observed inside companies and the influence to its performance.
Hyung-Jin and Overby (2012) reviewed how the studies of demographic diversity and performance have developed (Hyung-Jin & Overby, 2012, p.59-60):
1st Generation: Is demographic diversity beneficial for
performance? : Research of identification of a direct relationship
between diversity and performance
2nd Generation: When is diversity beneficial for performance? :
Research of identification of moderating variables in a direct
relationship between diversity and performance
3rd Generation: How does diversity affect performance? :
Research of identification of mediating variables in relation- ship
between diversity and performance
4th Generation: Is the relationship between diversity and
performance different depending on what kinds of diversity? :
Research of identification of different types of diversity and
direct relationship between each type of diversity and
performance
5th Generation: How does the relationship between different
kinds of diversity and performance vary depending on some
conditions? : Research of investigation of moderating variables
affecting on the relationship between different types of diversity
and performance
6th Generation: Is the relationship between diversity and group
process different depending on what kinds of diversity?:
on the direct relationship between each type of diversity and
performance
7th Generation: Is the relationship between diversity and
performance different depending on what kinds of diversity and
what kinds of group process? : Research of identification of
different types of diversity and direct relationship between each
type of diversity and performance
8th Generation: When is the relationship between different types
of diversity, different types of group process, and performance
different? : Research of identification of moderating variables in
the relationship between different types of diversity, different
types of group process and performance
At first researches focused on the issue of the inclusion of women and on the increase of minority groups reaching management positions.
Wright et al. (1995) considered the American corporate scenario with an increasing diversity, with inclusion of women and minorities in the workforce, and focusing on these criteria as diversity explored the affirmative action program of companies as a proxy for diversity examples. The authors then used high-quality affirmative action companies, and examined their stock prices, to see if it was possible to draw any relation between well-managed diversity and financial results. In an early study of diversity and firm performance, it was observed a positive relation of diversity for companies, however this study was focused on the company reputation and the market perception of affirmative action programs rather than the benefit that diverse groups can bring to the company strategy and overall performance.
Carter et al. (2003) conducted an updated analysis on diversity – women and minorities on the board of directors – and financial performance. The authors considered as the financial indicator firm value, and were able to observe a statistically significant positive relation for the number of women and minorities on the board and the financial performance.
conclusion of this particular study is the proposition of a U-shaped curve for the performance versus the level of diversity in the board: at first, adding minority representatives in top management team have a negative impact on firm performance, but only up to a point where greater balance in diversity actually improves financial performance.
The main findings are that on lower minority representation on top management teams, integration levels are also lower, contributing for communication issues; preventing the benefits of diversity on better quality decision-making.
Miller and Triana (2009) explored further the relationship between board diversity – characterized by gender and age combined with proportion of women and racial minorities - and performance, using innovation, or opportunities of new products or services, as one of the independent variables. They observed a positive relation between board diversity and the expenditure on research and development, concluding to a positive impact of diversity on firm innovation. Additionally in the study, it was observed a positive relationship between board diversity and the company reputation, that as implied by the authors, can have an impact on the firm performance.
Most of the studies performed had American companies as samples, as these companies are more internationalized and also a higher number of diverse employees; however, the European Union (EU), with its common economic area is increasing its diversity, specially concerning the exchange of nationalities within the EU.
Heijltjes et al. (2003) thus conducted research in Swedish and Dutch companies, to observe if multinational companies originating from these countries had multinational top management teams. The data gathered indicated that the internationalization of management is a recent phenomenon, but that has been increasing; a comparison over the years 1990-1999 showed an increase in the number of foreigners in the management board.
degree of internationalization of the company and international positions in their board of directors.
Another study was made over companies in the Mauritius and explored diverse board of directors, to see if a diverse board composition was positive for developing economies. What the author found out after gathering the data of 39 companies listed on the Stock Exchange of Mauritius is that there is not a wide diversity on their board of directors; men from business and engineering backgrounds mainly dominate these positions (Mahadeo, 2012). It states, therefore, that developing and emerging markets boards are still controlled by homogeneous groups, and might not be the best sample for a statistically significant analysis.
As it can be observed reviewing the studies and papers published on diversity in companies, not that many scholars have focused on the diversity of nationalities.
Heijltjes et al. (2003) observed a lack of research on national diversity at top management teams; a subject that is becoming increasingly relevant with companies moving to a more global environment and becoming multinationals. The authors suggest that the topic has not been explored due to the belief that companies do not have a significant number of internationals in their top management to conduct significantly statistical analysis.
Veen and Elbertsen (2008) state that companies will indeed turn into transnational companies, with effects “a micro level (i.e., culture and business negotiations), a meso level (i.e., MNCs and their international markets), and on a macro level (i.e., business systems and varieties of capitalism)” (Veen & Elbertsen, 2008, p.386). But the authors conclude that surprisingly the subject has not been systematically addressed.
Veen and Marsman (2008) suggest the emergence of “transnational careers” with the increase of nationality diversity within companies. According to the authors, in time both country-of-origin and country-of-destinations will decrease in importance and an international managerial labour will rise.
3. Methodology
The purpose of the paper is to verify the relationship between board of director’s nationality diversity and the firm’s financial performance; and for that, a significant number of companies were chosen for the sample. Later, its nationality diversity totals and financial ratios were submitted to statistical analysis. This subsection describes the choices made with the data and details the methodology applied.
3.1 Data Sample
The Fortune 500 list of the biggest companies in the US was chosen as the source for the data used in this paper. The Fortune 500 list was selected as it is a well-known magazine with a wide circulation (Erhardt, Werbel & Shrader, 2003), with a readership of approximately five million (Roberson & Park, 2007) and it is well regarded among businesses with companies striving to be part of this list (Hegstad & Wentling, 2004).
The Fortune 500 list seems to be a recurring data sample for studies (Stavrou, Kassinis & Filotheou, 2007, Robinson & Dechant, 1997), and more specifically, it figures as the sample base for many studies over diversity (Erhardt, Werbel & Shrader, 2003; Carter, Simkins & Simpson, 2003; Roberson & Park, 2007; Miller & Triana, 2009)
Adding to that, the companies listed in the Fortune 500 are successful businesses, many of them with a long history of success, and that as a result have developed and grown its operation overseas (Birley & Norburn, 1987), and because of that it is expected a significant sample of companies with nationality diversity among its board members.
Aiming at having the most recent data available, the Fortune 500 2013 was chosen, since it comprises the most recent companies’ information as well as the financial data publicized.
3.2 Methods
This study measures the company diversity through the number of nationalities in the board of directors. The board of directors was chosen as the companies’ measure because information about its members is easily accessible. Nationality information were obtained mainly using the companies’ annual report and secondarily - when not in the annual report - through search in the companies’ website.
The percentage of diversity for the board of directors was calculated by dividing the number of non-national members by the total number of members of the board.
To classify the members between national and non-national members it was considered the country-of-origin of the company as the country where the company has its headquarter. The non-national members are those who have the different nationality from the company’s country-of-origin.
Many companies have on their website a brief biography of their board of directors’ members, presenting their work experience and their academic background as well as where they were born and age information. When that was the case, the nationality information of the directors was extract directly from the companies’ website.
For the cases where the companies did not provide further information on the board members, a secondary search about their nationality was made on the Internet. Websites such as CNN Money, that has a biography section with information on many businessmen and NNDB that stores information on noteworthy people, were used for this research.
As for the nationality, it was decided to consider the country where each director was born as their nationality, independent of where they were raised or lived most of their lives.
This choice was made to treat all the directors through the same criteria, since in some cases it would be difficult to define what nationality should be consider.
One of these cases is the one of Carlos M. Gutierrez, member of the board of directors of MetLife. He was born in Cuba, moving to the United Stated when he was 3 years old and later moving again with his family to Mexico. Even though Mr. Gutierrez lived in the United States in an early age and absorbed the local culture, in this case, he is considered Cuban, and therefore a non-local director in the sample database.
The same happens for Mr. Muhtar Kent from the board of Coca-Cola, born on the United States but from Turkish parents; his father was the Turkish consul-general in the United States, he is considered a local director, even though he has been raised with a foreign culture from his parents.
The criterion was chosen with the objective of simplify these specific cases and looking to have a homogeneous database.
This percentage was calculated for both 2012 and 2011, it was then calculated an average of these two years. This is used to better control and to capture potential changes in the diversity ratio and also increases the reliability of the data.
For the financial performance, two financial ratios were chosen: return on assets (ROA) and return on investment (ROI), both are profitability ratios, and are considered ratios that can show the impact of decisions and policies taken by the company (Brigham & Ehrhardt, 2001).
The return on asset, which is measured by dividing the net income by total assets, helps understand the capability of the firm on creating revenues in excess of its actual expenses given a portfolio of assets, as a measure of the income produced for the shareholders (Carter, D’Souza, Simkins & Simpson, 2010).
The return on investment, which is the division of net income by invested capital, allow observing if the company has a sustainable growth, and if it is creating return for shareholders with an efficient operational system (Brigham & Ehrhardt, 2001).
financial performance. Additionally, the use of more than one variable gives a broader image of changes in the firm’s performance; the analysis of both variables provides a more consistent conclusion.
To avoid that fluctuations in the market or economic turmoil impact the results analyzed, the financial data of the companies were gathered from two different periods: 2012 and 2007. This five-year interval is used to control for market changes that can influence the firm’s performance, and also this interval is also expected to create a more reliable figure for analysis.
Adding to the independent and dependent variables, some other control variables were included in the model. The companies were divided between production and service and grouped into their sector, following the division used by the New York Stock Exchange (NYSE) for the companies listed. This industry classification was, in turn, created by FTSE International and Dow Jones & Company (NYSE Listing Directory, 2013).
Other two control variables considered for the analysis were the size of the board of directors (total number of members) and the size of the company (total assets).
The data was then submitted to statistical analysis to answer our initial question and observe what is the relationship between nationality diversity and the firms’ financial performance.
First a linear correlation was made, to check for linear and direct relationship between nationality diversity and each of the financial performance measures; followed by a correlation matrix, that presents all correlation existent between the variables.
4. Results and Analysis
The hypothesis posed by this paper is that the nationality diversity in Board of Directors has an influence on the financial performance of companies; the analysis of the 150 first companies of the Fortune 500 list is used as the sample to verify if there is any relationship between these two variables, and tries to outline possible correlation.
After gathering the data and applying the statistics analysis detailed on the previous section, the results are presented in this section together with their due analysis.
This section is structure starting from the sample overview, where details about the data gathered are presented. Next the results are presented, namely the correlation matrix and hierarchical regression with its specific analysis, finalizing with a brief summary of all the findings and how they relate and answer the thesis question.
4.1 Sample Overview
From a total of 150 public companies from the Fortune 500 list, 4 had to be taken away from the sample because they were outliers; their results were more than 5 standard deviations away from the mean of ROI and ROA measures. An outlier is defined as a value that is at least 3 standard deviations above or below the mean (Karlsson, 2007).
Figure 2: Industries data distribution
Source: Secondary data gathering. Elaborated by the author
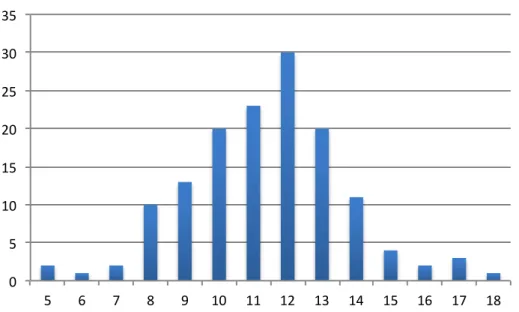
The analysis of diversity was made through the board members, so for each company the Board of Directors was analyzed and its members were then categorized between locals and non-locals according to their nationality. The board of directors analyzed varied their sizes from 5 to 18 members, however the higher frequency is of companies with 12 members, being the average of board size of 11.37.
Figure 3: Frequency distribution of board size (number of members)
Source: Secondary data gathering. Elaborated by the author
!"#$
%&#$ %'#$
%(#$ %!#$
"#$ "#$
)*+,-.*/$
012/34*+$5116/$ 7263/8+-9:$5116/$ ;9/-.$<98*+-9:$ =*9:8>.9+*$ ?-292.-9:$ @*.>21:1AB$
!" #" $!" $#" %!" %#" &!" &#"
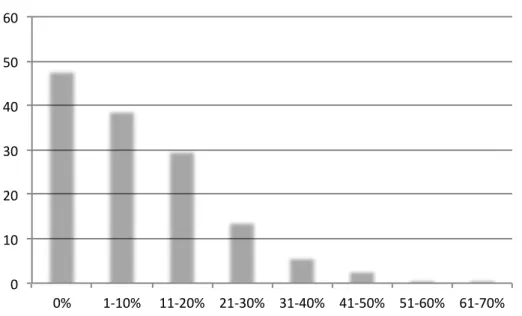
The sample accessed a total of 1615 directors, and the average diversity of the board is of 11.56%. From the total sample, 34% of the companies had no diversity in their board composition, that is, all of the members were American; this accounts for 536 directors (or 33% of the sample). Apart from these companies, the data diversity ranged from 5.8% to 69.3%, being the highest frequency of companies that do not have nationality diversity.
Figure 4: Companies’ diversity percentage distribution
Source: Secondary data gathering. Elaborated by the author
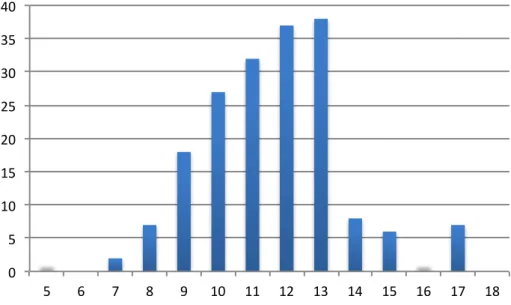
A total of 184 directors have a different nationality than the company’s country-of-origin, representing only 11% of the total sample. The highest presence of non-local directors was in boards with 11 members; although authors such as Carter, Simkins and Simpson (2003) and Ferris, Jagannathan and Pritchard (2003) have argued before that bigger boards tend to present a higher diversity, the frequency of diversity on the sample does not follow that rule. The diversity increased as the number of members of the board increase, up to a certain size (13 members of the board), from where the diversity decreased again.
!" #!" $!" %!" &!" '!" (!"
Figure 5: Non-local directors distribution through board size
Source: Secondary data gathering. Elaborated by the author
The diversity of boards of director can also be connected with the industries, presenting the ones with higher and lower nationality diversity. According to that, technology industries present higher nationality diversity on their boards (18%) while Healthcare has the lowest percentage (7%).
Figure 6: Industries average nationality diversity of the board of directors
Source: Secondary data gathering. Elaborated by the author !"
#" $!" $#" %!" %#" &!" &#" '!"
#" (" )" *" +" $!" $$" $%" $&" $'" $#" $(" $)" $*"
!"#$
!%#$
!&#$ !!#$
!!#$ !'#$
(#$
)*+,-./.01$
23-4-+34/$
5.-678*9$:..;6$
<*9=3+*6$
>463+$?4@*934/$
A-;76@934/$:..;6$
From the diversity information gathered, the majority of non-local directors come from Europe (42%) followed by the American continent (32%).
Figure 7: Non-local directors distribution of continents
Source: Secondary data gathering. Elaborated by the author
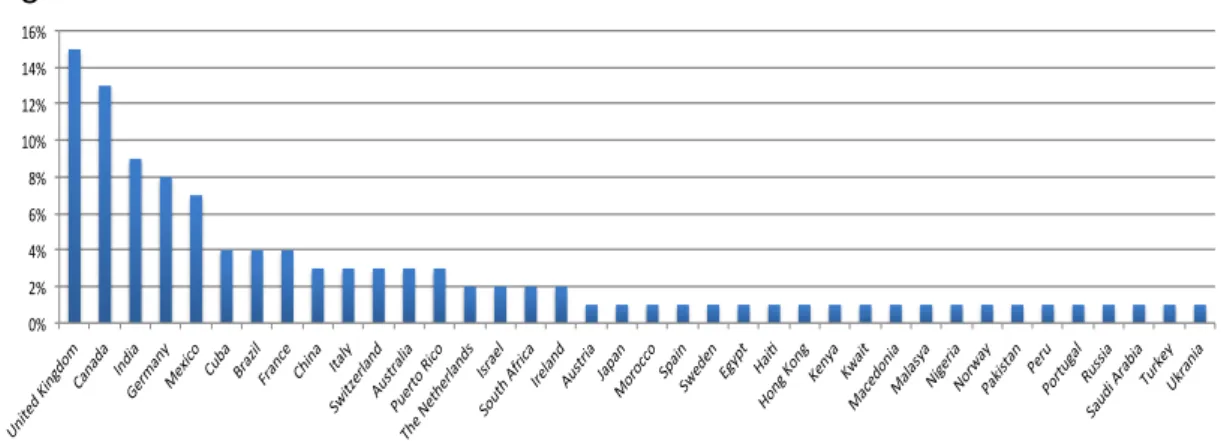
From these regions, countries that have English as their mother language are the ones with highest frequency of directors on the boards: the United Kingdom accounts for the highest percentage, with 15% of non-local directors working on the biggest American companies, followed by Canada with 13% and India with 9%; however this high percentage is not observed for Australia, that accounts for 3% of non-locals directors of the sample.
Figure 8: Non-local directors distribution of countries
Source: Secondary data gathering. Elaborated by the author !"#$ %#$ %"#$ !#$ &'#$ ()*+,-$ ./-0120$ 34-*2/0$ 35*2/0$ 3620$ !"# $"# %"# &"# '"# (!"# ($"# (%"# (&"# )*+ ,-.# /+*0 .12 # 34*
4.4#5*.+4# 6-72 4*8# 9-:+;1 #
Countries that have high percentage of immigration to the United States also have a significant presence in the Board of Directors; the country that has the highest inflow of immigrants to the United States is Mexico accounting for 14% of total immigrants in the country, and in our sample corresponds to 7% of non-local directors. In second place China (excluding Hong Kong) corresponds to 8% of US immigration and has 4% of non-local directors in the sample (MPI, 2013).
4.2 Statistical Analysis
4.2.1 Correlation
Linear correlation
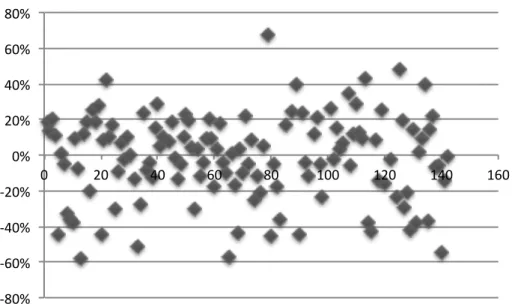
The first analysis conducted is of linear correlation, to observe if there is any correlation between the board of directors diversity and our financial parameters – ROI and ROA.
Figure 9: ROI linear correlation
Source: Secondary data gathering. Elaborated by the author !"#$%
!&#$% !'#$% !(#$% #$% (#$% '#$% &#$% "#$%
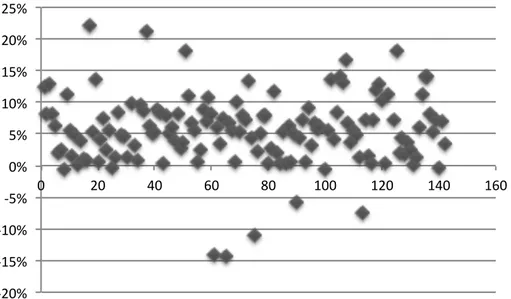
Figure 10: ROA linear correlation
Source: Secondary data gathering. Elaborated by the author
The correlations done do not present positive or negative linear relationship between the board of directors’ nationality diversity and the financial ratios used. That means that the increase of nationality between board members does not directly influence the financial performance of the company.
Even thought the linear correlation did not showed any relationship between the variables tested, it is still possible to draw relationships between the other variables used, including the control variables used to easy the impact of variables such as industry or size of board and company of the results.
The next subsection presents the correlation mix, where the relationship between variables is further explored.
4.2.2 Correlation matrix
The correlation matrix presented below puts together the average and standard deviation of the variables, as well as the correlation between them, putting together not only the dependent and independent variables, but also additional variables such as the companies’ assets and board size.
!"#$% !&'$% !&#$% !'$% #$% '$% &#$% &'$% "#$% "'$%
Table 1: Correlation matrix
Source: Secondary data gathering. Elaborated by the author
The correlation matrix follows the linear correlation results, not presenting a strong relationship between the variables. ROI 2012 is only marginally correlated to board diversity (0.01), adding to the analysis before, that the increase of nationality diversity does not have a direct influence on financial performance.
The total asset variable was introduced to observe if the size of the company could have influence on either the size or diversity of boards, that is, if companies with higher assets have bigger boards and if they have more diverse boards. Total asset had only marginal correlation with board size and diversity, being a negative correlation with board size (-0.02) and slightly positive with board diversity (0.03)
For all the other variables, total assets had a negative correlation meaning that as total asset increases, these variables also increase. The highest correlation was with ROI 2012 and ROI 2011 (-0.32), however with ROA 2012, ROA 2011 and industry the number was also close (0.24; 0.27 and -0.28 successively).
However, in this correlation matrix it is possible to visualize a positive correlation between ROA 2012 with board diversity; even though the correlation is not high (0.21), there is a positive correlation there. In a smaller scale, ROI 2011 also has a positive correlation with board diversity, with 0.16. The highest correlation presented in the matrix is between ROI 2012 and ROA 2012, since both ratios use net income in their formulas, a positive correlation between both measures is indeed expected.
Another correlation that indicates a positive correlation with board diversity is when industry is considered. An analysis established dividing the companies between service and production shows that the service segment has a higher
! "# $ % & ' ( ) * +
$ ,-.$% /0/% /0$+ 1
% ,-.$$ /0$( /0$+ /0/%
& ,-2$% /0/) /0/' /0'/ /0$3
' ,-2$$ /0/( /0/' /0&3 /0$$ /0+(
( .456789: $0%% /0$$ /0$' /0/* /0&/ /0%$
) ;<8=>?277@87 /0$3A /0%&A 1/0&% 1/0&% 1/0%' 1/0%* 1/0%+
* B<=95?7CD@ $$0&* $0+/ 1/0/' /0$& /0$$ /0/' /0$' 1/0/%
+ B<=95?5CE@97C8: /0$% /0$/ /0/$ 1/0/) /0%$ /0$) /0$% /0/& 1/0/* 1
correlation of ROA and board diversity (0.23) against a correlation of 0.16 of production companies.
4.2.3 Regression
In order to continue the analysis of existing correlation between the variables, in this section, different regressions are presented.
First the regression using one of the dependent variable (ROI and ROA) together with the independent variable – the board diversity. Both regression, using ROI and ROA, are presented separately, with a detailed analysis highlighting correlations.
Secondly, a hierarchical regression is conducted, where still the relationship between ROI and ROA against board diversity is presented; however this regression considers the control variables, to account for the impact on this correlation.
ROI and board diversity regression
Table 2: ROI and board diversity regression
Source: Secondary data gathering. Elaborated by the author
From the table above, it is possible to observe new information regarding the relationship between the ROI and board diversity. However, the data gathered
!"#$"%%&'()*+,+&%+&-%
!"#$%&#'() *+,*-. )(/0"12' 3+435. 678"9$'7()(/0"12' :3+,3;. /$1<7127(=22>2 3+?@453; AB9'2C1$%><9 ?*5
6DAE6
./ ** 0* 1 *&#(&/&-,(-")1
)'F2'99%>< ? 3+33;545 3+33;545 3+4;G,4@ 3+,G?-;**; )'9%7"1# ?*, *+?@???, 3+34G@G*
mainly contributes to our previous findings, that the correlation between the variables is not significant to draw precise conclusions.
Starting with the multiple R of 4.5%, meaning that board diversity explains less than 5% of the financial performance, considering as the measure of performance ROI. This number is not significant, and can be seen as another evidence that the relationship that the paper is pursuing to establish may not be significantly proven.
ROA and board diversity regression
Table 3: ROA and board diversity regression
Source: Secondary data gathering. Elaborated by the author
The same regression made considering ROA and board diversity already show us a different picture from the previous section. The multiple R in this case corresponds to 57.7%, meaning that the board diversity explains over 50% of financial performance, when the measure used is the ROA.
This higher percentage is still aligned with the observations on the first section of the statistical analysis, that the ROA had a higher correlation with the board diversity than the ROI.
Also, a higher number of the multiple R – contrary to previous outcomes - contributes to the analysis that the sample gathered is indeed relevant, with a high diversity among companies being either with varied board diversity, a different range of board size or even the total asset of companies.
!"#$"%%&'()*+,+&%+&-%
!"#$%&#'() *+,+-*.
)(/0"12' 33,3-4.
567"8$'6()(/0"12' 39,*:;. /$1<6126(=22>2 4,-?--4?
@A8'2B1$%><8 -?;
5C@D5
./ ** 0* 1 *&#(&/&-,(-")1
)'E2'88%>< - -,3:99:- -,3:99:- ;:,:9+:* *,+;::=F-?
)'8%6"1# -?* 9,+G+?*
?,-+:+?-All 146 companies have different composition, industries, size and financial performance; as seen on the sample overview section, 33% of the companies had no diversity on their boards, and this high percentage could lead to a hasty conclusion that the sample is not significant or does not have the diversity needed for this study; however the multiple R in this regression reassures that the sample is valid and that the conclusions taken from this paper are significant for the study of diversity inside companies.
4.2.4. Regression with dummy variables
The previous section conducted a regression of both ROI and ROA with board diversity, to observe the relationships between these variables, however it did not consider other variables that could influence the financial performance of companies; as the industry in which the companies are part of, or the size of the company.
The regression with dummy variables account for the influence that these other variables, called control variables, can have on the financial performance.
In this part it will be presented the regression considering as dummy variables: the company’s industry, its size as well as the board size.
4.2.5 Regression with all dummy variables
Industry
Company size
Another variable considered to the model is the company’s size considering its total assets. Since the sample data is already considering the 150 biggest American companies, the usual classification of small, medium and large corporations considering total asset cannot be considered for this data. Instead companies are distributed between the ones that have assets higher than US$ 1 billion, considered, in this sample, as large companies, and the ones with assets below U$$ 1 billion, considered smaller.
Board size
To see if having a bigger board can have a significant impact on the board diversity and the financial performance, this was chosen as the third dummy variable.
Considering that the board size varied between 5 to 18 members, with an average of 11.37 and a median of 11.50 the point of separation between smaller and larger boards was set on 11 members.
Table 4: Regression with dummy variables
Source: Secondary data gathering. Elaborated by the author
The new regression has a higher Multiple R than the previous regressions, of 24%, but it is still considered a low number for a statistical sample, and for that adds furthermore to the analysis that the relationship, which the paper is pursuing, might not be established in this study.
Another important value to consider is the p-value, none of the dummy variables has a p-value lower than 10%, meaning that no variable is able to account for the variances on financial performance.
Both correlation and regression matrix’s results present a weak relationship between the boards of director’s diversity with the selected financial performance measures. All the numbers were analyzed, highlighting the significant relationships, however these proved to be punctual, and not significant to the paper.
Even thought the correlation was not established, the results add to the research over nationality diversity inside companies, and contributes to further researches on the topic.
The next section concludes the analysis, presenting the answer to the question posed in the beginning of the paper, emphasizing the limitations of the analysis conducted as well as proposing further research to be made on the subject.
!"#$"%%&'()*+,+&%+&-% !"#$%&#'() *+,
)(-."/0' 1,
234"5$'3()(-."/0' *, -$/63/03(70080 9:;*<=1=* >?5'0@/$%865 ;+1
2A>B2
./ ** 0* 1 *&#(&/&-,(-")1 )'C0'55%86 < 9:;D<D+D11 9:9*=91E ;:=;;D*= 9:;D191+< )'5%3"/# ;D1 *:;<;;1<11 9:9;<F;=
G8$/# ;+< *:*F1<9EDD
5. Conclusion
This paper focused on the nationality diversity inside companies, and proposed to establish the relationship between the diversity on board of directors and the financial performance of firms. The main motivation of this study was to deepen the studies of diversity on the corporate field, and try to contribute to the understanding of the advantages and disadvantages that diversity can have on the organizations structure.
Academic research on gender and minorities diversity has been extensively explored, with a clear discussion about the relationship of an increase of women and minority on top management position and the financial result of companies (Barsh, Nudelman & Yee, 2013)
While studies on diversity of gender and the presence of minorities on companies seems to be vastly explored, matching studies on other types of diversity haven’t yet been so largely explored.
Taking the nationality diversity on corporations, few studies have focused on the increase of different nationalities leading to an international workforce, and the little research done on the relationship of nationality diversity and financial performance hasn’t find a unanimity.
Ruigrok, Peck, & Tacheva (2007) state on their study over nationality diversity on Swiss Corporate Boards, that exploring these different cultures and backgrounds certainly brings benefits for companies, since multiple attributes that each director aggregates interact with the others, building a richer decision environment. However, the authors draw attention to the increase on complexity added to the board, and that this complexity has to be successfully managed to fully achieve the benefits of diversity.
The different results together with a scarce literature over nationality diversity leaves the conclusion of the relationship of different nationalities inside a company and its performance blurred. What seems to be clear on the issue is that other variables can have an influence on the financial performance when nationality diversity is concerned.
international markets would have a higher chance on having non-local directors, as the cultural knowledge of the director is directly linked to the companies strategy. On that same term, an industry that has to deal with suppliers from different countries would also benefit with a director from these nationalities. For cases like these, the companies have a particular motivation to have on their boards or top management team non-locals, and the distinctive knowledge that comes from non-local members is linked straight with the company’s strategy (Zhara, Ireland & Hitt, 2000).
On the outcome part of the study, variables such as communication can influence on diversity relationships and can help overcome issues that arise from different cultures and ideas. Companies that have an open environment where ideas are exchanged, discussed and complemented instead of resisted, avoid conflicts and thus the problems with diverse groups (Maznevski, 1994).
However, variables such as communication environment or openness to different cultures are hard to measure, which makes the analysis of the performance impact harder to include them.
The paper used a simplified model, using 150 companies from the 2013 Fortune 500 list, and assessing their board of director’s members nationalities to calculate the level of diversity of each company. Adding to that, the financial measures ROI and ROA were used to find the relationship between diversity and financial performance.
From the data gathered, only marginal relationships were drawn between diversity and financial results. It was possible to observe a slight positive correlation between higher board diversity and ROA and ROI. However the difference between the correlations of the ratios was not significant to draw further conclusions of diversity influence.
Even though the analysis part did not present any significant correlation between the variables being tested, it is not enough to state that there is no relationship between nationality diversity and financial performance of companies.
reduced number of companies accounting for diversity, it is possible that characteristics other diversity could have impact on the financial result considered, as for example different industries that face different economic cycles would therefore have different financial results, independently of how diversity is addressed.
In order to avoid some of these variables influences, the regression was done using dummy variables; where the statistical results had a higher significance. However, the correlations were still lower to firmly conclude if there is a direct relationship between nationality diversity and financial performance, and what the extend of this relationship is.
However, some trends were observed in the sample data that should be pinpointed: firstly the high presence of English speaking nationalities among the non-national directors, particularly Canada and the United Kingdom. Secondly the presence of neighboring nationalities: Mexico and again Canada.
Both the language proximity and the physical closeness make the presence of such nationalities easier to adapt to the environment and the culture. Thus, decreasing the foreignness and the issues that can arise from understanding a new culture. Problems with communication and expression of oneself can be smoothened in such cases (Chandler & Tsai, 2001).
These questions are hard to be quantified and included in the analysis model. The next section, on the limitation part, describes some of the variables that can have impacted on the results presented.
Finally, the results presented on the study contribute for the study of diversity inside companies, and further explores the nationality diversity issue. Focusing only on American companies and considering the board of directors as the nationality diversity sample data, the study proposes to initiate the discussion over diversity on top management team and how it translates on the financial performance.
Even though not strong correlations were obtained on the statistical analysis, the relationship between diversity and performance is still a relevant issue and deserves additional studies.
6. Limitations and future research
Seeking to further develop the research on nationality diversity within the corporate environment, the paper aimed at investigating the existing correlation between nationality diversity and financial performance. With this purpose, choices of sample data and analysis models were made; being all of them detailed on the methodology section. However appropriate those choices were, they also generated some limitations to the study, which are described in this section, aiming at clarifying any possible biases or partial effects it could have on the results and analysis.
6.1 Variables drawbacks and limitations
The paper based its diversity data solely on American companies, considering the 150 biggest ones according to Fortune magazine. Those companies were chosen since they are large multinational companies, with international presence (Sulistiawan, 2013) and it was, therefore, expected from them to have significant presence nationality diversity on their board of directors. However, the results presented concern only American companies, and therefore the results on diversity can have effects of local behavior and specific culture related issues. A data considering other countries could have brought a different view on nationality diversity and financial performance on the workplace.
The Fortune 500 list also presents companies from all of the industries and economy sectors, having on one side a diverse database, but on the other side leaving the data sample very heterogeneous, and possible influencing the final results and analysis.