Evaluation of raw milk quality in different production systems and periods of
the year
Marcos Inácio Marcondes1, Daniele Canabrava Jácome1, Alex Lopes da Silva1, Luciana Navajas Rennó1, Ana Clarissa dos Santos Pires2
1Departamento de Zootecnia, Universidade Federal de Viçosa, Viçosa, MG, Brasil.
2Departamento de Tecnologia de Alimentos, Universidade Federal de Viçosa, Viçosa, MG, Brasil.
ABSTRACT - The objective of this study was to evaluate the quality of raw milk in different production systems and its variation throughout the year. The data were collected from 943 dairy farms in the South, Central-West and Central regions of the state of Minas Gerais, and in Vale do Paraíba, in the state of São Paulo, Brazil. The data were collected in the period from January 2009 to September 2011, in a total of 18,206 samples. The properties were divided into confinement, semi-confinement and extensive production systems. The evaluated factors were somatic cell count (SCC), total bacterial count (TBC) and protein and fat contents. There was no effect of production system on the contents of protein, fat and SCC. Total bacterial count, however, was affected by production. Seasonal variations were found for SCC, TBC, protein and fat; the highest protein values were found from March to June; the highest fat contents were obtained from May to August; and TBC and SCC, from December to March. The production system does not interfere with the percentage of fat and protein and SCC of the milk. However, confinement systems present a better TBC content. Both month and year are factors that interfere with TBC, SCC, protein and milk fat, and the best patterns are found in the coldest periods of the year.
Key Words: fat, protein, SCC, TBC
ISSN 1806-9290
www.sbz.org.br R. Bras. Zootec., 43(12):670-676, 2014
Received August 23, 2013 and accepted September 19, 2014. Corresponding author: [email protected]
http://dx.doi.org/10.1590/S1516-35982014001200007
Copyright © 2014 Sociedade Brasileira de Zootecnia. This is an Open Access article distributed under the terms of the Creative Commons Attribution Non-Commercial License, which permits unrestricted non-commercial use, distribution, and reproduction in any medium, provided the original work is properly cited.
Introduction
Milk is one of the most complete foods in nutritional terms; it is rich in nutrients essential for growth and maintenance of a healthy life (Vilela, 2002). The importance of adding milk to the human diet is because of its richness in proteins, fats, carbohydrates (lactose), mineral salts, vitamins, conjugated linoleic acid, sphingomyelin, butyric acid, among other substances, which provide immunologic protection and essential nutrients to its consumers (Sordillo et al., 1997; Oliveira et al., 1999).
The milk agro-industrial system is composed of important segments to the Brazilian economy, as it generates employment, wealth and taxes, in addition to being one of the biggest agro-industrial systems of the world (Castro et al., 1998).
From the technological viewpoint, the quality of raw materials is one of the main obstacles to development and consolidation of the dairy industry in Brazil. The criteria employed to define the quality of raw milk have been modified to meet the official regulation demands of industry and
consumers, and aim mostly at meeting requirements of food safety and better industrial yield (Bressan and Martins, 2004).
So as to ensure evolution in the quality of the milk produced, the Brazilian Ministry of Agriculture, Livestock and Food Supply (MAPA), through the Department of Inspection of Animal-Origin Products (DIPOA), published the Normative Instruction no. 62/2011 (IN 62), modifying the Normative Instruction no. 51, published previously. Thus, from January 1st, 2012, the new normative, No. 62/2011 (IN 62) now regulates the quality of the raw milk produced, with new limits for total bacterial count (TBC) and somatic cell count (SCC) (Brasil, 2011).
According to quality parameters stated on IN 62 for the period from January 07, 2008 through December 12, 2011 in the South, Central-West and Southeast of Brazil, in which the present study is inserted, the maximum standard plate count
(SPC) allowed is 7.5 × 10⁵ cfu mL–1 and SCC is 7.5 ×
105 SC mL–1. For the period comprised between 01/01/12 and
06/30/2014, the maximum SPC must be 6.0 × 10⁵ cfu mL–1 and
SCC of 6.0 × 10⁵ SC mL–1; and from 07/01/14 to 06/30/16, a
maximum SPC of 3.0 × 10⁵ cfu mL–1 and SCC of 5.0 × 10⁵
SC mL–1. Lastly, from 07/01/16 onwards, a maximum SPC
of 1.0 × 10⁵ cfu mL–1 and 4.0 × 10⁵ SC mL–1 of SCC will be
permitted (Brasil, 2011).
Material and Methods
We used 18,026 samples from 943 producers, collected from January to September 2011. Data were separated by production system (Table 1), month (Table 2) or year (Table 3).
The farms were divided into confinement, semi-confinement or extensive systems. The semi-confinement system was characterized by feeding animals with silage of corn and/or sorghum and/or sugarcane during all the year plus supplementation with concentrate. The semi-confinement system was characterized by the use of pasture during the rainy period and corn silage and/or sorghum silage and/or sugarcane during the dry season, with supplementation of concentrate in both periods. The third system had pastures used during all the year with concentrate supplementation. Mineral supplementation was used over the course of all periods (rainy and dry) in all production systems.
Two bottles containing approximately 50 mL of milk were collected from each farm to be analyzed. The milk was taken directly from the expansion tank with the aid of a ladle, previously disinfected with 70% alcohol. The preservatives utilized were Azidiol, for analysis of TBC, and Bronopol for SCC and milk composition. Samples were kept under refrigeration until they arrived at the laboratory.
Five samples were collected monthly from the tank of each supplier. Of these five samples, two were discarded (the numerically largest and smallest) and the average of the three other samples was calculated. This average was used by the company to calculate the payment for quality to the suppliers.
In our study, we also utilized the average corrected for the analysis. Samples were stored for a maximum of seven days in a refrigerator until the laboratory analyses were performed.
Analyses of the milk chemical composition included fat and protein, according to the Fourier Transformed Infrared technique (FTIR), performed with MilkoScan (FossAnalytical) or LactoScope (Delta Instruments)
Table 1 - Protein and fat contents, somatic cell count (SCC), and total bacterial count (TBC) of milk properties in different production systems
System Item (g kgProtein–1) (g kgFat –1) (cells mLSCC –1)(cells mLTBC –1)
n 700 695 693 697 Extensive Mean 32.2 35.9 583.169 52.324
SEM 1.01 1.02 13.541 4.883 n 8114 8077 8.030 8.095 Semi-confinement Mean 32.2 36.2 596.900 57.532
SEM 0.72 0.55 4.501 1.892 n 3742 3729 3.713 3.749 Confinement Mean 32.2 36.1 607.962 63.708
SEM 0.90 1.03 6.797 3.966
SEM - standard error of the mean.
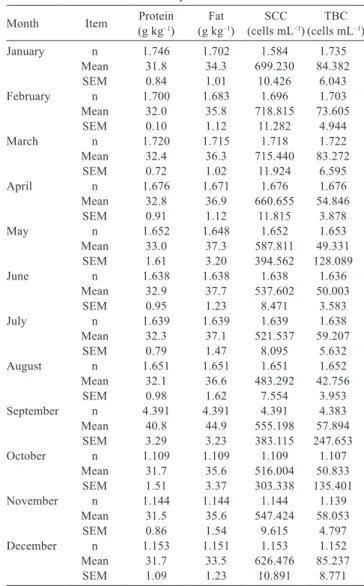
Table 2 - Protein and fat contents, somatic cell count (SCC), and total bacterial count (TBC) of milk properties in different months of production
Month Item (g kgProtein–1) (g kgFat –1) (cells mLSCC –1)(cells mLTBC –1)
January n 1.746 1.702 1.584 1.735 Mean 31.8 34.3 699.230 84.382
SEM 0.84 1.01 10.426 6.043 February n 1.700 1.683 1.696 1.703 Mean 32.0 35.8 718.815 73.605
SEM 0.10 1.12 11.282 4.944 March n 1.720 1.715 1.718 1.722 Mean 32.4 36.3 715.440 83.272
SEM 0.72 1.02 11.924 6.595 April n 1.676 1.671 1.676 1.676 Mean 32.8 36.9 660.655 54.846
SEM 0.91 1.12 11.815 3.878 May n 1.652 1.648 1.652 1.653 Mean 33.0 37.3 587.811 49.331
SEM 1.61 3.20 394.562 128.089 June n 1.638 1.638 1.638 1.636
Mean 32.9 37.7 537.602 50.003 SEM 0.95 1.23 8.471 3.583 July n 1.639 1.639 1.639 1.638 Mean 32.3 37.1 521.537 59.207
SEM 0.79 1.47 8.095 5.632 August n 1.651 1.651 1.651 1.652 Mean 32.1 36.6 483.292 42.756
SEM 0.98 1.62 7.554 3.953 September n 4.391 4.391 4.391 4.383 Mean 40.8 44.9 555.198 57.894
SEM 3.29 3.23 383.115 247.653 October n 1.109 1.109 1.109 1.107
Mean 31.7 35.6 516.004 50.833 SEM 1.51 3.37 303.338 135.401 November n 1.144 1.144 1.144 1.139
Mean 31.5 35.6 547.424 58.053 SEM 0.86 1.54 9.615 4.797 December n 1.153 1.151 1.153 1.152 Mean 31.7 33.5 626.476 85.237
SEM 1.09 1.23 10.891 8.771
SEM - standard error of the mean.
Table 3 - Protein and fat contents, somatic cell count (SCC) and total bacterial count (TBC) of milk properties in different years of production
Year Item (g kgProtein–1) (g kgFat –1) (cells mLSCC –1)(cells mLTBC –1)
2009 n 6.366 4.454 6.199 6.352 Mean 31.8 23.0 633.389 66.166
SEM 1.11 1.25 4.748 2.135 2010 n 7.189 7.189 7.189 7.188 Mean 32.3 36.1 578.333 62.767
SEM 0.72 0.95 4.909 2.928 2011 n 4.384 4.384 4.383 4.383 Mean 32.7 36.3 578.686 55.434
SEM 1.67 3.61 403.049 206.115
equipment. The somatic cell count, however, was obtained by flow cytometry using a Fossomatic (FossAnalytical) or a SomaScope (Delta Instruments) device, and total bacterial count (TBC) was performed by flow cytometry methodology and BactoScan (FossAnalytical) or Bactocount (BentleyInstruments) equipment.
To evaluate the production systems, we used a completely randomized design in a mixed model, where the production system was considered a fixed effect, and farmer, year and month within year were considered random effects of the model.
The data pertaining to year and month were analyzed in a completely randomized design in an arrangement of subdivided plots repeated over time, having years as plots and months as subplots. In this model, production systems and farmer were isolated as random effects.
Means between the production systems and months of the year that were significant by the F test were compared by the t test at 0.05 probability. For all statistical analyses, the SCC values were transformed in somatic cell score (SCS) by the function SCS = [log2(SCC/100,000)]+3, described by Dabdoub and Shook (1984), and TBC values were transformed in base 10 log (logTBC). For all evaluations, the significance level of 0.05 was considered critical for fixed effects, and 0.10 for the random effects. Analyses were performed with PROC MIXED procedure of SAS (Statistical Analysis System, version 9.2) statistical software.
Results
Production systems had no effect on levels of protein, fat and SCC, but total bacterial count was affected (Table 4).
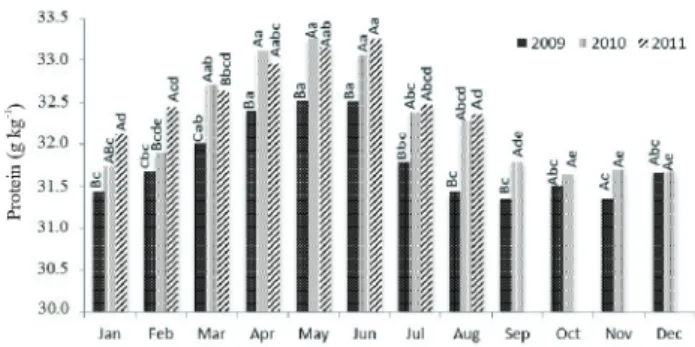
Evaluating the seasonal variation of milk quality, an increase could be observed in protein from February to April, which remained so in May and June (Figure 1), having much similar behavior in 2009, 2010 and 2011. The fat results, however, differed between months and years (Figure 2).
The variation in TBC throughout the year is directly linked to the season of the year. It started to increase from October, which coincides with the beginning of the rainy season, remaining at higher values until March and falling in April (Figure 3). Somatic cell count reduced in June, remaining so until September and increasing from October (Figure 4). Moreover, there was a downward trend as the years passed.
Table 4 - Least squares means of protein, TBC, SCC and fat according to the production system
System
P-value Extensive confinement Confinement
Semi-Protein (g kg–1) 32.170 32.258 32.286 0.3461
TBC (log cel mL–1) 4.4379a 4.4054a 4.2966b 0.0001
(27.406) (25.431) (19.774) SCC (log cel mL–1) 5.3342 5.3362 5.3252 0.7904
(504.155) (504.853) (501.025) Fat (g kg–1) 36.416 36.176 36.164 0.3329
TBC - total bacterial count; SCC - somatic cell count.
Numbers in parentheses correspond to the real values of TBC and SCC. Means followed by different letters in the same row differ by the t test (P<0.05).
Lowercase letters differ months within year and uppercase letters differ year within months (P<0.05).
Figure 1 - Monthly variation of protein in 2009, 2010 and 2011.
Lowercase letters differ months within year and uppercase letters differ year within months (P<0.05).
Figure 2 - Monthly variation of fat in 2009, 2010 and 2011.
Lowercase letters differ months within year and uppercase letters differ year within months (P<0.05).
Discussion
The results (Table 4) are possibly a consequence of the program of payment for quality implanted by the dairy industry in the year prior to that from which the data were obtained. The implementation of payment systems for the milk is based on making producers manage their production according to the needs of the market (Pirisi et al., 2007). For instance, if the market pays incentives for total solids with bonuses for protein and fat, producers will start to seek technologies to increase the concentration of these components in milk.
Since the implantation of this type of bonus, in 2002, there has been a significant improvement in the quality of the milk from farmers. An important measure of support the agro-industry offered to its suppliers was the adoption of a quality-assurance team responsible for the training of workers, technical staff and corrections of abnormalities from 2004 to 2007. In addition to these actions, in 2006 there were changes in prices paid and an increase in the rigor of bonus ranges. Thus, analyzing the mean values for protein, TBC, SCC and fat, we can say that the producers of the three production systems meet IN-62 for the present period.
Alterations in protein content can be achieved at a much lower magnitude than the possible changes in fat contents, because of several factors (Sutton, 1989); among them are environmental factors and even alterations of management. The influence of genetics on the protein content can be characterized by considering the different breeds. About 55% of the variability in protein content is caused by genetics; the rest is environment-related (Santos and Fonseca, 2007).
Environmental factors are related to the production level, lactation stage, cow age, sanity and nutrition. Considering that there is availability of feed, we can affirm that the
adjustment of diets by technicians who assist the farms
results in a variation of about 10 to 20 g kg–1. Furthermore,
in spite of being a high-heritability trait, the result of the genetic investment regarding the choice of bulls that will increase the solids content can only be evaluated after a few generations.
White et al. (2002) assessed the confinement system with the use of total diet and pasture system (with supplementation of grains and hay, according to the availability of feed). The pasture system showed lower milk yield and greater crude protein content (35 g kg–1) than confinement (34 g kg–1).
However, these authors did not work with data obtained from a program of payment for protein in the milk to the producers. Zanela et al. (2006), however, did not find any difference in terms of crude protein from the milk between the same studied systems.
The main factors that affect the milk fat content are: breed; animal individuality; lactation stage; feeding; body condition score; sanitary conditions of the mammary gland; interval between lactations; and the moment of milking at which the sample is collected (Fox and Mcsweeney, 1996; Lane et al., 1997). Thus, breed may have strongly affected the results found herein (Table 4), since there is predominance of Holstein blood in the studied region for the different systems.
Considering animals of the same breed and productive potential, the main factors associated with milk composition are: dry matter intake, quality, fiber digestibility and energy/protein diet ratio (Jenkins and McGuire, 2006). In the extensive system, the low density of nutrients and reduced fiber digestibility usually limit dry matter intake considerably during the time of lowest rainfall (Santos and Fonseca, 2000), leading to imbalance between energy and protein (Ponce et al., 1999). When associated with adequate forage supply, supplementation can prevent such alterations in the milk production and composition (Bargo et al., 2002).
Another strategy that has been increasingly used in the extensive system, which can explain the non-decrease of fat, is the adoption of technologies such as pasture deferment and rotational grazing with elevated fertilization. In this way, the quantity and quality of dry matter ingested in winter is better.
In confinement and semi-confinement systems feed supply during all year ensures that there will be no oscillations in the fat content. In these systems, in which there is greater utilization of concentrates and sources of fermentable carbohydrates, a low milk fat concentration can be an indicator of ruminal acidosis (Nocek, 1997).
The somatic cell count (Table 4) can be directly associated with the postponing of compliance with IN 51
Lowercase letters differ months within year and uppercase letters differ year within months (P<0.05).
by the farmers and agro-industries, as well as a payment table that really stimulates the producer to make decisions for reduction in SCC. This lack of financial stimuli to the producer leads them not to make decisions that would really cause an impact on SCC, such as discard of cows, discard of milk, and drying of teats. For bigger producers, who are usually grouped in semi-confinement and confinement systems, the discard of a small group of animals generates a great impact on the quality without brining significant economic losses. In the extensive system, any type of animal or milk discard generates a great impact with economic loss to producer, both in animals and milk volume, since this is mostly about small farmers. Another fact that should be taken into account is that most of the times, financially speaking, the base price paid for the milk liter, even with the bonus or penalization for quality, is higher.
The drop in SCC is extremely important for the producer, because with a healthier herd they will have animals of greater productivity, lower expenditure with medications and veterinary, and greater optimization of the time spent milking and consequently better economic return and milk quality. On the other hand, the effectiveness of IN 62 should be focused on governmental actions that ensure the training of farmers so that they can reach the levels determined.
The difference among the production systems for total bacterial count is possibly related to the type of structure used to feed the animals. In the rainy period, animals in the extensive and semi-confinement system arrive at the milking parlor with larger amounts of dirt in the udder. Given that, the two main measures for control of TBC are reduction of the initial bacterial load of the milk and rate of multiplication of bacteria, and the former can be cited as the main cause of the difference found in TBC. Since the agro-industry collects milk only from refrigerated tanks, this aspect would possibly be an explanation to characterize the difference between the systems.
The daily cleaning of beds and corridors where the stabled animals stay provides a place with lower amount of organic matter, and consequently lower bacterial contamination. In addition, animals housed in beds decrease the probability of lying down on dirt. In the extensive and semi-confinement systems, because cows tend to gather in shaded places, which are subjected to greater accumulation of feces, they arrive at the milking parlor with dirtier teats. Analyzing the size of the properties, because confinement systems tend to have a higher average milk volume, the damage caused by the non-receipt of bonus for TBC is greater than that of properties with extensive and semi-confinement systems.
The main causes of contamination stem from the external surface of the udder and skin of the teats and of the udder itself, which all serve as contaminants when they come into contact with manure, mud, bed and other materials; the water used for cleaning the equipment and other tasks; contact between milk and milking devices and/ or utensils and tank with deficient cleaning and sanitization; presence of animals with mastitis in certain situations; and poor refrigeration of the milk, which will not start, but only aggravate the problem (Santos and Fonseca, 2000).
Maintaining the teats clean and dry is so important for the bacterial count that, according to Galton et al. (1986), performing pre-dipping along with manual drying reduces bacterial contamination by about 54%. Thus, the rigor with the hygiene of the teat and inadequate drying can be the cause of the difference found for TBC in the different production systems. This control is probably greater at the properties of confinement systems, since the damage caused by the non-adoption of these practices is bigger.
An explanation for the higher values of protein in the months of June, July and August is the greater thermal comfort for animals and availability of roughage of better nutritional quality in this period. Some authors found that high environment temperatures reduced the total protein content and decreased the consistency of milk clots of four different breeds, which was lower in summer and higher in winter (DePeters and Cant, 1992; DePeters and Ferguson, 1992).
The animal thermal comfort is an important subject of consideration. In these three systems, most properties did not provide animals with adequate thermal comfort, and a greater dry matter intake is certain in confinement systems in the winter simply because of the drop in temperature and humidity. In the extensive and semi-confinement systems, the lack of shade for animals in the summer is reduced. Another common trend is lower milk supply in the market and higher prices in the dry months. Thus, there is stimulus for a higher purchase of inputs with consequent use of better-quality products in animal feeding.
In an experiment carried out in the South of Brazil, Martins et al. (2006) found significant differences between the months for protein percentages. The minimum protein values occurred in July and August, and the highest in the months of spring and beginning of summer, coinciding with an improvement of climate conditions and greater availability and quality of pastures.
of protein in winter months with better feeding of the herd and higher dry matter intake.
The year effect is usually explained by economic factors such as prices paid to producers, payment for quality, and prices paid for the inputs, which can also act by encouraging or discouraging production. Differences in climate, feeding and quality of the forage offered between the studied years, besides the different needs according to the milk production, also justify the effect of year on the productive performance of dairy cows (Ribas et al., 2004).
The results obtained for milk fat are different from those found by Martins et al. (2006) and Gonzales et al. (2004). However, several interactions of nutritional factors can affect the quality and composition of milk fat, such as quantity and quality of the fiber, concentrate level in relation to roughage supplied, location and extent of starch degradation, fatty acid composition and inertia, and ruminal degradability of supplemental fat (Ashes et al., 1997).
Naikare et al. (1992) studied factors that affect production as well as the percentage of milk fat in crossbred Girolando cows and observed that the percentage of fat in
the summer (40.1 g kg–1) was lower than winter (40.5 g kg–1),
which also occurred in our study (Figure 2).
The higher fat values found in the dry period in May, June and July can be related to the period of greater use of concentrate along with the adequate amount and size of the roughage supplied. In addition, good preservation of feeds and adequate nutrition affected these indicators. Over the years there may be a natural variation in the milk fat due to the environment temperature and humidity. With heat,
thermal stress causes loss of CO2 via respiration, lowering
the blood pressure, which reflects in an increased pH, and consequently reduction of buffer reserves in the saliva, which directly affects the fiber ruminal degradation and milk fat (Carvalho, 2000).
Concerning the variation among years, the quality and management of roughages produced are remarkable characteristics. These factors are directly related to the milk prices and precipitation, which ensure well-fertilized and productive crops.
The total bacterial count was higher in the rainy period, maybe because the disinfection and drying of teats (pre-dipping) can be compromised as a result of animals arriving dirtier at milking parlor, which may represent higher initial microbial load of the milk if this procedure is not performed thoroughly.
For the raw milk to provide more quality the initial bacterial load must be lower and there must be a rigorous system of refrigeration of the post-milking production
(Arcuri, 2006). Because 100% of the evaluated producers possess a milk refrigeration system and the transport is bulked in isothermal tanks, the increased temperature in the rainy season cannot be considered a relevant factor to explain the difference between the months.
An aspect to be considered is that the trained producers who reach good rates for TBC only have their TBC levels modified by a change in the staff or by controlling mechanical problems. As the technical assistance staff provided by the agro-industry comprehends most of the milk volume (not the number of properties), and the support from the milk buyers, who are also trained, it can be stated that they have been good support in the maintenance of these good numbers.
The decrease in TBC over the years is strongly related to these training processes. Because it is an indicator of easy manipulation and becomes a standard after accomplished, only very large anomalies are responsible for not achieving good results.
The results found in the literature diverge as to the SCC present in the milk. Evidence shows that there is no effect of year seasonality on the milk SCC (Vasconcelos et al., 1997; Gonzalez et al., 2004). However, other authors have observed a decrease in the SCC of milk in the coldest times of the year (Noro et al., 2006; Olde et al., 2007), which seems to be the closest result to what was found in this study.
In the summer, the temperature and humidity favor bacterial multiplication and so there is higher probability of contamination from the environment. The summer is the period with the highest incidence of clinical mastitis, especially that caused by the environment (Olde et al., 2007). The stress caused by high temperatures and humidity also increases the susceptibility to infections and the number of pathogens to which cows are exposed.
Another explanation for the elevation in SCC in the hottest months of the year is the lower milk production and consequent concentration of somatic cells (Harmon, 1994). Coupled with this is a greater probability of occurrence of isolated intramammary infections, which is the main factor responsible for the increase in SCC.
Conclusions
The production system does not interfere with the percentage of fat and protein and the somatic cell count of milk. However, confinement systems provide better total bacterial counts. Both month and year are factors that interfere with total bacterial count, somatic cell count, and protein and fat of milk, and the best patterns are found in the coldest periods of the year.
References
Arcuri, E. F.; Brito, M. A. V. P.; Brito, J. R. F.; Pinto, S. M.; Ângelo, F. F. and Souza, G. N. 2006. Qualidade microbiológica do leite refrigerado nas fazendas.Arquivo Brasileiro de Medicina Veterinária e Zootecnia 58:440-446.
Ashes, J. R.; Gulati, S. K. and Scott, T. W. 1997. Potential to alter the content and composition of milk fat through nutrition. Journal of Dairy Science 80:2204-2212.
Bargo, F.; Muller, L.; Delahoy, J. and Cassidy, T. 2002. Milk response to concentrate supplementation of high production dairy cows grazing at two pasture allowances. Journal of Dairy Science 85:1777-1792.
Brasil. Ministério da Agricultura, Pecuária e Abastecimento.2011. Instrução Normativa no 62. Diário Oficial da União, Brasília,
n.432, Seção 1 – Anexo I, p.14, 2011.
Bressan, M. and Martins, M. C. 2004. Segurança alimentar na cadeia produtiva do leite e alguns de seus desafios. Revista de Política Agrícola 13(3). Available at: <www.embrapa.br/publicacoes/ tecnico/revistaAgricola/rpa-anos-anteriores-1/de-2000-a-2004/ Rev_Pol_Agr_v13_n3-2004.PDF>. Accessed on: Jan. 30, 2012. Castro, C. C. D.; Padula, A. D.; Mattuella, J. L.; Müller, L. A. and Angst,
A. N. 1998. Estudo da cadeia láctea do Rio Grande do Sul: uma abordagem das relações entre os elos da produção, industrialização e distribuição.Revista de Administração Contemporânea 2:143-164. Carvalho, M. P. 2000. Manipulando a composição do leite: Gordura.
In: 1o Curso online sobre qualidade do leite. Instituto Fernando
Costa.
Depeters, E. J. and Cant, J. 1992. Nutritional factors influencing the nitrogen composition in bovine milk: A Review. Journal of Dairy Science 75:2043-2070.
Depeters, E. J. and Ferguson, J. D. 1992. Non protein nitrogen and protein distribution in the milk of cows. Journal of Dairy Science 75:3192-3209.
Fox, P. F. and McSweeney, P. L. H. 1996. Proteolysis in cheese during ripening. Food Reviews International 12:457-509.
Galton, D. M.; Peterson, L. G. and Merril, W. G. 1986. Effects of premilking udder preparation pratices on bacterial counts in milk and teats. Journal of Dairy Science69:260-266.
Gonzales, H. L.; Fischer, V.; Ribeiro, M. E. R.; Gomes, J. F.; Stumpf Jr., W. and Silva, M. A. D. 2004. Avaliação da qualidade do leite nos diferentes meses do ano na bacia leiteira de Pelotas, RS. Revista Brasileira de Zootecnia 33:1531-1543.
Harmon, R. J. 1994. Physiology of mastitis and factors affecting somatic cell counts.Journal of Dairy Science 77:2103-2112. Jenkins, T. C. and McGuire, M. A. 2006. Major advances in
nutrition: impact on milk composition. Journal of Dairy Science 89:1302-1310.
Lane, C. N.; Fox, P. F.; Johnston, D. E. and McSweeney, P. L. 1997. Contribution of coagulant to proteolysis and textural changes in cheddar cheese during ripening. International Dairy Journal 7:453-464.
Martins, P. R. G.; Silva, C. A.; Fischer, V.; Ribeiro, M. E. R.; Stumpf Júnior, W. and Zanela, M. B. 2006. Produção e qualidade do leite na bacia leiteira de Pelotas-RS em diferentes meses do ano. Ciência Rural 36:209-214.
Naikare, B. D.; Kale, K. M.; Jagtap, D. Z. and Narawade, V. S. 1992. Factors affecting fat percentage and total fat in gir crosses.Indian Journal of Animal Science 62:1209-1211.
Nocek, J. E. 1997. Bovine acidosis: Implications on laminitis. Journal of Dairy Science 80:1005-1028.
Noro, G.; González, F. H. D.; Campos, R. and Durr, J. W. 2006. Fatores ambientais que afetam a produção e a composição do leite em rebanhos assistidos por cooperativas no Rio Grande do Sul.Revista Brasileira de Zootecnia 35:1129-1135.
Olde Riekerink, R. G. M; Barkema, H. W. and Stryhn, H. 2007. The effect of season on somatic cell count and the incidence of clinical mastitis. Journal of Dairy Science 90:1704-1715.
Oliveira, C. A. F.; Fonseca, L. F. L. and Germano, P. M. L. 1999. Aspectos relacionados à produção que influenciam a qualidade do leite. Higiene Alimentar 13:10-13.
Peres, J. R. 2001. O leite como ferramenta de monitoramento nutricional. p.29-43. In: Uso do leite para monitorar a nutrição e metabolismo de vacas leiteiras.Gonzales, F. H. D.; Durr, J. W.; Fontaneli, R. S., eds. Universidade Federal do Rio Grande do Sul, Porto Alegre.
Pirisi, A.; Lauret, A. and Dubeuf, J. P. 2007. Basic and incentive payments for goat and sheep milk in relation to quality. Small Ruminant Research 68:167-178.
Ponce, P.; Capdevila, J. and Laranja, L. F. 1999. Characterization of the abnormal mylk syndrome: An approach of its probable causes and its corrections. Journal of Dairy Science 82(Suppl.1):195.
Ribas, N. P.; Hartmann, W.; Monardes, H. G. and Andrade, U. V. C. 2004. Sólidos totais do leite em amostras de tanque nos estados do Paraná, Santa Catarina e São Paulo. Revista Brasileira de Zootecnia 33:2343-2350.
Santos, M. V. and Fonseca, L. F. L. 2000. Qualidade do leite e controle de mastite.1.ed. Lemos, São Paulo.
Santos, M. V. and Fonseca, L. F. L. 2007. Estratégias para controle de mastite e qualidade do leite.1.ed.Editora Manole, São Paulo. Sordillo, L. M.; Shafierweaver,K.andDerosa,D.1997.Immunobiology
of mammary gland. Journal of Dairy Science 80:1851-1865. Sutton, K. 1989. Altering milk composition by feeding. Journal of
Dairy Science 72:2801-2814.
Vasconcelos, C. G. C.; Nader Filho, A.; Amaral, L. A. and Pereira, G. T. 1997. Influência da estação do ano, do estádio de lactação e da hora da ordenha sobre o número de células somáticas no leite bovino. Arquivo Brasileiro de Medicina Veterinária e Zootecnia 49:483-491.
Vilela, D. 2002. A importância econômica, social e nutricional do leite. Revista Batavo 3:17-18.
White, S. L.; Benson, G. A.; Washburn, S. P. and Green Junior, J. T. 2002. Milk production and economic measures in confinement or pasture system using seasonally calved Holstein and Jersey cows. Journal of Dairy Science 85:95-104.