*Corresponding author:
E-mail: robsongiacomeli@yahoo. com.br
Received: May 2, 2016
Approved: September 29, 2016
How to cite: Giacomeli R, Marchesan E, Oliveira ML, Martin TN, Teló GM, Donato G, Silva MF. Physical properties and crop management for corn in an Albaqualf. Rev Bras Cienc Solo. 2017;41:e0160237.
https://doi.org/10.1590/18069657rbcs20160237 Copyright: This is an open-access article distributed under the terms of the Creative Commons Attribution License, which permits unrestricted use, distribution, and reproduction in any medium, provided that the original author and source are credited.
Physical Properties and Crop
Management for Corn in an Albaqualf
Robson Giacomeli(1)*
, Enio Marchesan(2)
, Maurício Limberger de Oliveira(1)
, Thomas Newton Martin(2), Gustavo Mack Teló(3), Gabriel Donato(4) and Marília Ferreira da Silva(4)
(1)
Universidade Federal de Santa Maria. Centro de Ciências Rurais, Departamento de Fitotecnia, Programa de Pós-graduação em Agronomia, Campus Camobi, Santa Maria, Rio Grande do Sul, Brasil.
(2)
Universidade Federal de Santa Maria. Centro de Ciências Rurais, Departamento de Fitotecnia, Campus Camobi, Santa Maria, Rio Grande do Sul, Brasil.
(3)
Louisiana State University, School of Plant, Environmental, and Soil Science, Baton Rouge, Louisiana, USA. (4)
Universidade Federal de Santa Maria, Centro de Ciências Rurais, Curso de Agronomia, Campus Camobi, Santa Maria, Rio Grande do Sul, Brasil.
ABSTRACT: Rice monoculture in lowlands can cause problems for management
practices in crop fields, for example, in weed control. For this reason, corn in rotation with
irrigated rice in lowlands may be advantageous, despite problems with soil compaction
and water excess. The objective of this study was to evaluate soil physical properties
and corn performance in soil management systems in an Albaqualf soil (lowlands). Two
experiments were conducted in the field, in the 2013/14 and 2014/15 crop seasons. The experimental design was randomized blocks with two factors. There were three levels for the first factor, consisting of soil management practices: soil chiseling 45 days before sowing to a depth of 0.3 m; conventional tillage with two diskings to a depth of 0.1 m
and subsequent leveling of the soil; and no-till. The second factor was composed of two levels: sowing on raised seedbeds, and without raised seedbeds. The soil parameters of
bulk density, total porosity, macroporosity, microporosity, volumetric moisture, and soil
resistance to mechanical penetration (RP) were evaluated. The corn parameters were
plant height, shoot dry matter, leaf area, height of the first ear of corn, grains per ear, and
grain yield. Soil chiseling resulted in lower RP and higher macroporosity in the 0.1-0.2 and 0.2-0.3 m layers. In raised seedbeds, the 0.00-0.05, 0.05-0.10, and 0.10-0.20 m layers
were lower in RP and bulk density. Moreover, higher soil macroporosity was observed in
relation to the treatment without raised seedbeds. In general, the highest grain yields were found in the treatments with lower RP and higher macroporosity in the root system region. Increased porosity accelerated water drainage in the soil, reducing the time
that soil airspace was filled with water, which is a limiting factor for root development.
In Albaqualf soils, planting corn in chiseled soil provides higher corn yields compared to conventional tillage, and planting corn on raised seedbeds provides higher corn yields
compared to the lack of raised seedbeds.
Keywords:Zea mays, soil compaction, soil chiseling, no-till, raised seedbed.
INTRODUCTION
In the southern half of the state of Rio Grande do Sul (RS), Brazil, there are an estimated 5.4 million hectares of lowlands (Pinto et al., 2004), in which soils classified as Albaqualf predominate, occupying approximately three million hectares (Bamberg et al., 2009). These soils are characterized by the presence of a dense and practically waterproof B horizon (Santos et al., 2013) on which mostly rice is grown in the summer, and ryegrass
pasture in the winter. This agricultural practice currently covers an area of 1.1 million hectares in the state (Conab, 2016).
However, continuous cultivation of rice in these areas results in management problems
and thus lower levels of grain yields. Among the main difficulties is an increase in the number of weeds resistant to herbicides inhibiting the ALS enzyme, as observed in red rice
(Oryza sativa L.) in regard to barnyardgrass (Echinochloa sp.) and sedges (Cyperus spp.)
(Galon et al., 2008; Roso et al., 2010; Matzenbacher et al., 2013; Schaedler et al., 2013). In crop fields with troublesome weed infestation, crop rotation is the main alternative as it enables reduction in the weed seed bank in soil (Andres et al., 2001). Therefore, among crop options for rotation with rice is corn, which allows weed control, breaking the cycle
of diseases and insect pests and improving the physical and chemical characteristics of the soil (Theisen et al., 2009).
The corn crop has difficulty adapting to the physical conditions of lowland soils, due to the characteristics of high bulk density, low hydraulic conductivity, reduced slope, and low
water storage capacity (Pinto et al., 2004). In addition to these natural characteristics of the soil, intensive soil preparation for irrigated rice, conducted under conditions of high water content in the soil, promotes the soil compaction process (Moraes et al., 2013).
Soil structure degradation leads to longer periods of hydric soils, causing oxygen deficit for plants and periods of water deficit in dry seasons. In addition, soil compaction implies
increased soil resistance to mechanical penetration, which restricts root development.
Lower root development reduces the ability for water uptake by roots, consequently affecting plant growth (Collares et al., 2011; Ortigara et al., 2014).
Management practices can assist in decompacting lowland soils to improve physical properties
and drainage. Soil chiseling before sowing corn can minimize the effects of compaction by decreasing bulk density and soil resistance to mechanical penetration of roots (Colet et al., 2009). Another management practice that can be used is conventional tillage with disking,
since this action tends to reduce soil density in the surface layer (Beutler et al., 2012). In addition to previous soil management practices, sowing together with building up raised seedbeds is an alternative that assists in surface water drainage, enabling the development of rainfed crops in areas initially cultivated with irrigated rice (Fiorin et al., 2009).
Soil management practices can improve the physical properties of the soil, and the
expectation is that this will enable corn cultivation in Albaqualf soil. The objective of this
study was to evaluate the soil physical properties and performance of the corn crop in
different soil management systems in an Albaqualf.
MATERIALS AND METHODS
Two experiments were conducted in the field, Experiment 1 in the 2013/14 crop season and Experiment 2 in the 2014/15 crop season, in the academic experimental lowland area of the
Universidade Federal de Santa Maria (UFSM), located in the central region of the state of
Rio Grande do Sul, Brazil. The climate is characterized as humid subtropical (Cfa), according to Köppen classification system (Alvares et al., 2013), with no dry season and an average
rainfall of 1,616 mm per year. The geographical coordinates are 29° 43’ S, 53° 43’ W,
Albaqualf (Soil Survey Staff, 2014) or Planossolo Háplico Eutrófico (Santos et al., 2013).
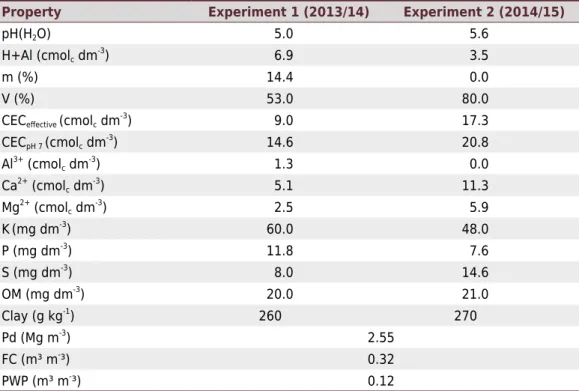
The physical and chemical properties of the soil in each experiment are shown in table 1. The experimental areas were systematized in zero quota and received 3,500 kg ha-1 of limestone in 2013. In 2014, over 2,000 kg ha-1 was added to the second experimental area (for a total of 5,500 kg ha-1
). Each experiment was performed in different plots, although in the same experimental area, 50 m apart. In Experiment 1, the area was planted to irrigated rice in the 2011/12 crop season, and after harvest, the soil was disked and leveled using a land leveler. In the same experiment, soybean was cultivated with
no-tillage in the 2012/13 crop season. In the winters of both 2012 and 2013, ryegrass was
cultivated. In Experiment 2, the same management practices were performed, growing
rice in the 2012/13 crop season, soybean in the 2013/14 crop season, and ryegrass in the winters of 2013 and 2014.
The experimental design was randomized blocks in which the treatments were distributed in a 3 × 2 factorial arrangement, with four replications. The first factor consisted of soil
management practices: soil chiseling 45 days before seeding to a depth of 0.3 m (SC);
conventional tillage with disking to a depth of 0.1 m and subsequent soil leveling (CT);
and no-tillage (NT). The second factor was composed of sowing on raised seedbeds (SB)
and sowing without raised seedbeds (WS). The experimental plots were 3 m wide by
10 m long (30 m2). Around the experiment area furrows of 0.1 m width and 0.2 m depth
have been opened and connected to assist in drainage of water to output of the area.
For corn sowing, an Industrial KF® Hyper Plus planter was used, composed of three
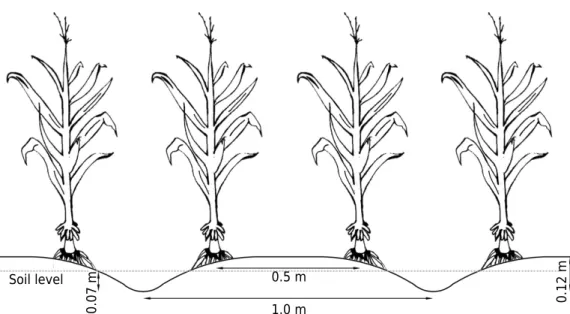
moldboards responsible for forming raised seedbeds, with six rows spaced at 0.50 m, and shank depth of 0.13 m for fertilizer deposition. For formation of the raised seedbeds,
besides the traditional seeding mechanisms, there was the presence of three plows. Each raised seedbed of 1.0 m width accomodates two corn rows positioned at the respective edges of each bed (Figure 1). In the treatments without raised seedbeds, the same planter was used, but without the moldboards.
Table 1. Chemical and physical properties of the soils evaluated, at a depth of 0.0-0.2 m
Property Experiment 1 (2013/14) Experiment 2 (2014/15)
pH(H2O) 5.0 5.6
H+Al (cmolc dm-3
) 6.9 3.5
m (%) 14.4 0.0
V (%) 53.0 80.0
CECeffective (cmolc dm-3) 9.0 17.3
CECpH 7 (cmolc dm-3
) 14.6 20.8
Al3+
(cmolc dm-3
) 1.3 0.0
Ca2+
(cmolc dm-3
) 5.1 11.3
Mg2+ (cmolc dm-3) 2.5 5.9
K(mg dm-3
) 60.0 48.0
P (mg dm-3
) 11.8 7.6
S (mg dm-3
) 8.0 14.6
OM (mg dm-3) 20.0 21.0
Clay (g kg-1
) 260 270
Pd (Mg m-3
) 2.55
FC (m³ m
-³) 0.32
PWP (m³ m-³) 0.12
pH(H2O): pH in water, v/v 1:1; H+Al: determined by calcium acetate at pH 7.0; Ca and Mg: 1 mol L-1 KCl
In both experiments, the hybrid used was AG 9045 PRO2 at a density of 80,000 plants ha-1. In Experiment 1, sowing was performed on November 7, 2013, and due to low emergence,
new sowing was on November 30 at the same location. Emergence was on December 6,
corn tasseling on January 22, and harvest on April 20, 2014 (Figure 2). In Experiment 2,
sowing was on November 16, 2014, emergence on November 21, corn tasseling on January 12, and harvest on April 8.
In Experiment 1, basic fertilization consisted of 40 kg ha-1 of N, 80 kg ha-1 of P
2O5, and 80 kg ha-1 of K
2O; 30 % of this amount was applied at the second sowing time, completing
fertilization for yield expectations of 8,000 kg ha-1. In Experiment 2, fertilization was for a yield expectation of 10,000 kg ha-1
, and basic fertilization consisted of 20 kg ha-1 of N, 140 kg ha-1 of P
2O5, and 60 kg ha -1 of K
2O.
Topdressing with N, in the form of urea, was carried out in the V4, V7, and V9 stages
of development (Ritchie et al., 1993) at rates of 50 and 75 kg ha-1
in each application
for Experiments 1 and 2, respectively. In Experiment 2, 60 kg ha-1 of K
2O was applied in
topdressing at the V7 stage. On December 26, 2013, the soil reached water content below
50 % of field capacity, and surface irrigation was applied. The other crop treatments were
conducted according to the technical recommendations for the crop (Embrapa, 2013).
At 60 days after sowing, soil samples were collected for determination of the physical variables
of the soil: bulk density (BD), total porosity (TP), macroporosity (Macro), and microporosity
(Micro). The methodology of collecting undisturbed samples was used between the plant rows, in the 0.00-0.05, 0.05-0.10, 0.10-0.20, and 0.20-0.30 m layers, with soil sample rings
of 0.04 m height and 0.04 diameter (Donagema et al., 2011). Due to difficulties of soil collection in Experiment 1, these variables were evaluated and analyzed only for the soil management factor. Early in crop development in Experiment 2, weekly assessments were
made of air space in the 0.00-0.05, 0.05-0.10, and 0.10-0.20 m soil layers by the volumetric ring method (Donagema et al., 2011). These evaluations were performed only in the SC, CT, and NT treatments on Nov. 27, Dec. 4, Dec. 11, Dec. 18, and Dec. 26, 2014.
Soil resistance to mechanical penetration (RP) was determined in the 0.0-0.3 m layer in the VT
stage using a Falker digital penetrograph, model PLG 1020, at 8 points per plot. These points were between the corn rows. Readings were taken at depths of every 0.01 m, and subsequently,
the mean value was calculated for the 0.00-0.05, 0.05-0.10, 0.10-0.20, and 0.20-0.30 m layers for each plot. The water content of the soil at the time of evaluation of RP in the 0.0 - 0.2 m
layer was 0.34 and 0.32 m3 m-3 in Experiments 1 and 2, respectively. The Experiment 2
0.5 m
0.12 m
1.0 m
0.07
m
Soil level
evaluation of RP was conducted on Nov. 27, Dec. 4, Dec. 19, and Dec. 26 of 2014 and Feb. 6 and March 9 of 2015 in the SC, CT, and NT treatments (only the soil management factor). These evaluations also determined the water content of the soil.
In stages V5 and VT of the corn plants, the height and shoot dry matter (DM) were
evaluated in five plants per experimental plots. For height in V5, the plants were measured from ground level up to the end of the last leaf extension, and in VT, up to the level where the last leaf connects to the stalk. For determination of DM, the plants
were placed in a greenhouse at a temperature of 65 °C, dried to constant weight, and weighed. The leaf area in the VT growth stage was determined during bolting through
the equation LA = L × W × 0.75, also utilized by Sangoi et al. (2007), in which L and
W represent the length and the width, respectively, of all leaves with more than 50 %
green area, in five plants per plot.
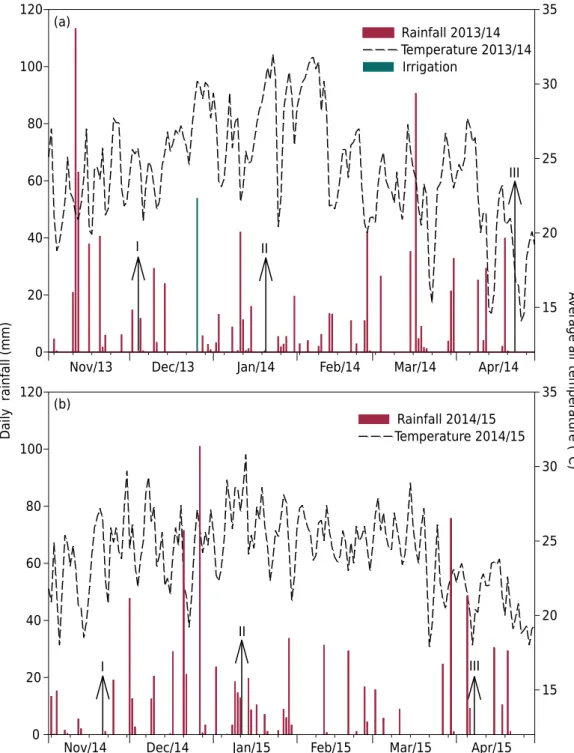
Figure 2. Rainfall and average air temperature in crop season of 2013/14 (a) and 2014/15 (b). I – Emergence; II – Bolting, III – Harvest. Santa Maria, RS, Brazil. 2016.
Nov/13 Dec/13 Jan/14 Feb/14 Mar/14 Apr/14
Nov/14 Dec/14 Jan/15 Feb/15 Mar/15 Apr/15 0
20 40 60 80 100 120
15 20 25 30 35
0 20 40 60 80 100 120
15 20 25 30 35 Rainfall 2013/14
Temperature 2013/14 Irrigation
Rainfall 2014/15 Temperature 2014/15
I
II
III II
I
III (a)
(b)
Daily rainfall (mm)
Av
erage air temperatu
re
At the end of the crop cycle, 7.5 m² of each experimental plot was harvested and the number of grains per ear was determined, counting the number of kernel rows and grains
per row in 10 random ears. Following this assessment, corn yield was determined after the grains were threshed and weighed and grain impurities were removed, correcting moisture to 13 %.
The assumptions of the mathematical model were tested for the data, and all variables
were obtained normally by the Shapiro-Wilk test (p>0.05) and homogeneity of variances by the Bartlett test (p>0.05). Analysis of variance was performed. When the F test (p<0.05) was significant, the comparison of means was made by the Tukey test (p<0.05)
with the assistance of Assistat 7.7 beta.
RESULTS
Rainfall was less after emergence and average temperatures were higher in Experiment 1, compared to the Experiment 2 (Figure 2). The higher average temperature resulted in shorter time to bolting in the first year at 47 days after emergence; in the second year, this occurred at 52 days. Due to the absence of rainfall for 10 days in Experiment 1, the soil reached water content of less than 50 % of field capacity, requiring surface
irrigation on Dec. 26, 2013. An irrigation depth of 54 mm was applied.
There was no interaction between the factors studied. In Experiment 1, soil bulk density
(BD) in the NT treatment was lower than in the SC treatment in the 0.00-0.05 m layer (Table 2). In this same layer, total porosity (PT) was lower in the SC treatment compared
to NT. In the other layers, treatments were similar for BD and PT in Experiment 1. In Experiment 2, the SC treatment resulted in lower BD and higher PT compared to the CT
and NT treatments in the 0.05-0.10 m layer. In the 0.10-0.20 m layer, the SC treatment had lower BD and higher PT than the NT treatment.
In Experiment 2, the SB treatment resulted in lower BD than the WS, decreasing from
1.67 to 1.57 Mg m-3 and from 1.65 to 1.62 Mg m-3 in the 0.05-0.10 and 0.10-0.20 m layers,
respectively. In the SB treatment, the PT was higher by 0.04 and 0.03 m3 m-3 in the 0.05-0.10
and 0.10-0.20 m layers, respectively, compared to the WS. Soil macroporosity (Macro)
in the NT treatment was higher in the 0.00-0.05 m layer relative to SC in Experiment 1. Furthermore, in the same layer of Experiment 2, the Macro of NT and SC were higher
than CT. The SC treatment provided higher Macro in the 0.10-0.20 and 0.20-0.30 m
layers in both experiments. The SB treatment provided soil Macro increases of 0.04,
0.05, and 0.01 m3 m-3 in the 0.00-0.05, 0.05-0.10, and 0.10-0.20 m layers, respectively,
compared to the WS.
The RP was lower in the SC treatment for Experiment 1 compared to the CT and NT treatments, in all layers (Table 3). In Experiment 2, the SC showed lower RP in
all layers compared to NT and gave the same result as the CT in the 0.00-0.05 and
0.15-0.20 m layers. In Experiment 2, the SB treatment reduced the RP in the 0.00-0.05
and 0.05-0.10 m layers in relation to the WS treatment. In the evaluation made in
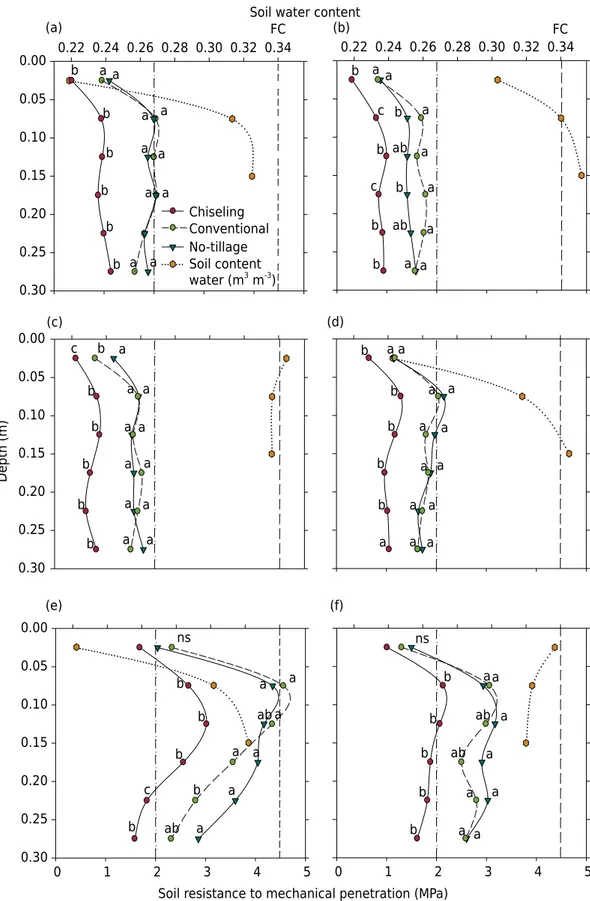
Experiment 2 (Figure 3) in regard to different water contents in the soil, it was observed
that the SC resulted in lower RP at all water contents evaluated compared to NT and
CT. In the soil water content near field capacity, the RP values were lower than 2 MPa
in all layers of the SC treatment.
The evaluation of RP at the lowest soil water content resulted in a value higher than 4 MPa in the 0.05-0.15 m layer in treatments CT and NT, whereas in the SC, it was less than 3 MPa. At the highest soil water content, the smallest variation between the RP of the treatments in all layers was observed. In the 0.00-0.05 m layer, there was little
Table 2. Bulk density, total porosity, macroporosity, and microporosity of the soil in the 0.00-0.05, 0.05-0.10, 0.10-0.20, and 0.20-0.30 m layers under different soil management practices in an Albaqualf soil in the 2013/14 and 2014/15 crop seasons
Layer Soil management Raised seedbed
(1)
Mean CV
Chiseling Conventional No-tillage Without With
m %
Experiment 1 (2013/14)
Bulk density (Mg m-3
)
0.00-0.05 1.37 a 1.34 ab 1.30 b - - 1.34 1.5
0.05-0.10 1.55 ns
1.51 1.55 - - 1.54 1.9
0.10-0.20 1.61 ns
1.64 1.64 - - 1.63 1.1
0.20-0.30 1.60 ns 1.65 1.65 - - 1.63 1.1
Total porosity (m3 m-3
)
0.00-0.05 0.46 b 0.47 ab 0.49 a - - 0.47 2.1
0.05-0.10 0.39 ns
0.41 0.39 - - 0.40 2.9
0.10-0.20 0.37 ns
0.35 0.36 - - 0.36 2.5
0.20-0.30 0.37 a 0.35 b 0.35 b - - 0.36 1.7
Macroporosity (m3 m-3
)
0.00-0.05 0.03 b 0.07 a 0.09 a - - 0.06 22.2
0.05-0.10 0.04 ns
0.07 0.05 - - 0.05 24.4
0.10-0.20 0.04 a 0.01 b 0.03 a - - 0.03 30.9
0.20-0.30 0.05 a 0.02 b 0.02 b - - 0.03 19.5
Microporosity (m3 m-3) 0.00-0.05 0.42 ns
0.40 0.40 - - 0.41 3.3
0.05-0.10 0.34 ns 0.34 0.34 - - 0.34 3.1
0.10-0.20 0.32 ns
0.34 0.33 - - 0.33 4.4
0.20-0.30 0.32 ns
0.33 0.33 - - 0.33 2.6
Experiment 2 (2014/15)
Bulk density (Mg m-3
) 0.00-0.05 1.39 ns
1.40 1.35 1.40 ns
1.37 1.38 4.4
0.05-0.10 1.52 b 1.66 a 1.67 a 1.67 a 1.57 b 1.61 4.1
0.10-0.20 1.61 b 1.62 b 1.66 a 1.65 a 1.62 b 1.63 1.5
0.20-0.30 1.63 ns
1.64 1.64 1.64 ns
1.63 1.64 0.9
Total porosity (m3 m-3) 0.00-0.05 0.46 ns
0.45 0.47 0.45 ns
0.46 0.46 5.4
0.05-0.10 0.40 a 0.35 b 0.35 b 0.35 b 0.39 a 0.37 7.1
0.10-0.20 0.37 a 0.36 a 0.35 b 0.35 b 0.36 a 0.36 2.7
0.20-0.30 0.36 ns
0.36 0.36 0.36 ns
0.36 0.36 1.8
Macroporosity (m3 m-3
)
0.00-0.05 0.12 a 0.09 b 0.13 a 0.09 b 0.13 a 0.11 15.5
0.05-0.10 0.08 a 0.02 b 0.03 b 0.02 b 0.07 a 0.04 44.3
0.10-0.20 0.04 a 0.04 a 0.02 b 0.03 b 0.04 a 0.03 32.1
0.20-0.30 0.03 a 0.02 b 0.02 b 0.02 ns
0.02 0.02 27.6
Microporosity (m3 m-3
)
0.00-0.05 0.33 ns 0.35 0.34 0.36 a 0.33 b 0.34 5.0
0.05-0.10 0.32 ns
0.33 0.31 0.32 ns
0.32 0.32 4.3
0.10-0.20 0.32 ns 0.31 0.33 0.33 ns 0.32 0.33 4.4
0.20-0.30 0.33 ns
0.33 0.34 0.33 ns
0.33 0.33 2.3
(1)
Review of this factor was carried out only in the second year. Means followed by the same letter in the lines for the same factors do not differ by the Tukey test (p<0.05). ns
In the five assessments of Experiment 2, the water content in the soil was at field capacity
(Figure 4). Airspace in the evaluations was higher in the 0.00-0.05 and 0.05-0.10 m
layers in the SC treatment in comparison with the CT, except for the evaluation that
was made on Dec. 18, 2014 (Figure 4) in which precipitation of 29 mm had occurred on the previous day. Airspace was higher in the NT treatment in the 0.00-0.05 m layer in
comparison to CT in four evaluations; however, in the next lower layer, airspace was
lower with the NT treatment.
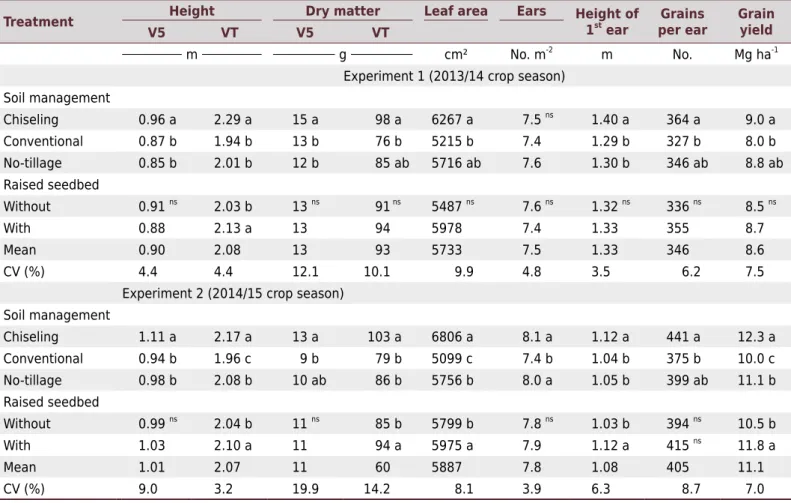
Regarding the variables of corn, the SC treatment exhibited greater height, dry weight, leaf area, and grain yield relative to CT in both experiments (Table 4). In Experiment 1,
the height, dry weight, and grain yield were similar in both the CT and NT treatments,
whereas in Experiment 2, there was a higher number of spikes per m², greater height
in VT, and higher grain yield in NT than CT. The height variables in VT, leaf area, height
of the first ear, and the grain yield were higher in the SB treatment, with yield increase
of more than 12 % compared to the WS treatment. It is noteworthy that the grain yield
was 2.5 Mg ha-1 higher in Experiment 2 than in Experiment 1.
DISCUSSION
The BD averages greater than 1.6 Mg m-3 found in the experiments in the 0.05-0.10,
0.10-0.20, and 0.20-0.30 m layers resulted in a PT of 0.36 m3 m-3. These results can be
explained by the low clay content in the soil, providing a naturally high density (Marcolin
and Klein, 2011). Moreover, consecutive preparation operations of the soil for the rice crop, often under conditions of high water content in the soil, favors the soil compression process (Moraes et al., 2013), raising the BD and thus reducing the PT.
The lower BD and greater PT in the uppermost soil layer (0.00-0.05 m) results from higher Macro in the topsoil. The greater Ma found in the NT treatment in relation to other management practices is the result of improvements in soil structure in this layer caused by organic matter and roots from soybean and ryegrass in the dry season and
Table 3. Soil resistance to mechanical penetration in 0.00-0.05, 0.05-0.10, 0.10-0.15, 0.15-0.20, 0.20-0.25, and 0.25-0.30 m layers under different soil management practices in an Albaqualf
Layer Soil management Raised seedbed Mean CV
Chiseling Conventional No-tillage Without With
m %
Mg m-3
Experiment 1 (2013/14)
0.00-0.05 0.6 b 0.9 a 0.9 a 0.8 ns
0.8 0.8 14.0
0.05-0.10 1.2 b 1.9 a 2.1 a 1.7 ns
1.7 1.7 13.8
0.10-0.15 1.5 b 2.5 a 2.6 a 2.2 ns
2.2 2.2 14.9
0.15-0.20 1.7 b 2.5 a 2.6 a 2.3 ns 2.3 2.6 16.4
0.20-0.25 1.8 b 2.3 a 2.5 a 2.1 ns
2.3 2.2 20.1
0.25-0.30 1.8 ns
2.2 2.3 2.2 ns
2.2 2.1 25.7
Experiment 2 (2014/15)
0.00-0.05 0.8 b 1.1 ab 1.3 a 1.3 a 0.8 b 1.1 20.6
0.05-0.10 1.9 b 1.9 b 2.6 a 2.7 a 2.0 b 2.3 17.6
0.10-0.15 2.1 b 2.9 a 3.2 a 2.7 ns
2.7 2.7 20.5
0.15-0.20 2.2 b 2.9 ab 3.3 a 2.6 ns
3.0 2.8 24.3
0.20-0.25 2.1 b 2.8 a 3.0 a 2.5 ns 2.7 2.6 19.8
0.25-0.30 1.8 b 2.6 a 2.7 a 2.3 ns
2.4 2.4 16.6
previous crop. This previous cultivation promoted soil biological activity, which helped
soil aggregation. According to Six et al. (2004), soil aggregation results in greater Macro,
facilitating drainage and increasing the amount of air in the soil.
Soil resistance to mechanical penetration (MPa)
Depth (m)
Soil water content
0 1 2 3 4 5
(f) b a ab b aa b ab a a a a b a
0 1 2 3 4 5
0.30 0.25 0.20 0.15 0.10 0.05 0.00 a ab a a b ns b c a b a a ab b a (d) b a a a b b a a 0.30 0.25 0.20 0.15 0.10 0.05 0.00 b a a a a b a b b b a c a a a b a (e) b a a a a b a a b a a a b (c) ns
0.22 0.24 0.26 0.28 0.30 0.32 0.34
b
a ab
a
b b a a
a b a 0.30 0.25 0.20 0.15 0.10 0.05 0.00 0.22 FC FC
0.24 0.26 0.28 0.30 0.32 0.34 (a) b a a a a b a b a b b a a a a b c b a c a ab b (b) No-tillage Conventional Chiseling Soil content water (m3 m-3)
The reduction in BD in the 0.05-0.10 and 0.10-0.20 m layers resulted in an increase in PT in these layers in the SB treatment compared to the WS. The Ma was the constituent
variable of PT that was most affected in these treatments from reduction of BD, as there
was an average increase of 0.03 m3 m-3 in the 0.00-0.20 m layer. Although this value may
seem low, it means an increase of 170 %, since it is a soil with low Macro. Thus, seeding
in a raised seedbed, in addition to maximizing surface drainage due to an increase in
original ground level, reduces the BD and increases the Macro.
The increase in Macro promotes drainage and oxygenation of the roots, indicated as limit
conditions by Fiorin et al. (2009) for corn cultivation in an Albaqualf. A soil macroporosity
Depth (m)
Soil content water (m3 m-3)
Fc Fc
0.00 0.05 0.10 0.15 0.20 0.25 0.30 0.05
0.10
0.15
0.20 0
0
0 0.05
0.10
0.15
0.20
0.00 0.05 0.10 0.15 0.20 0.25 0.30 0.05
0.10
0.15
0.20
0 0.05 0.10 0.15 0.20 0.25 0.30 0.35 0.40 0 0.05 0.10 0.15 0.20 0.25 0.30 0.35 0.40 (b)
(c)
(e)
(d) Chiseling
Conventional No-tillage
Soil content water (a)
lower than 0.10 m3 m-3 reduces the yield of the grass plot (Drewry et al., 2008). Thus, the values found in this experiment led to restrictions in crop development in the initial phase in Experiment 2.
The greater airspace values found for the SC and NT treatments are the result of greater
Macro, which helps drain water to deeper layers. The water content of the soil at field capacity indicates that the crop was under stress due to lack of soil aeration. Airspace
lower than 0.10 m3 m-3 is limiting for grass development (Drewry et al., 2008), and in
five evaluations carried out, the condition of airspace higher than 0.10 m3
m-3 was met only in the uppermost layer. Thus, there were periods of suboptimal soil aeration in the
deeper layers in all treatments, and the soil may have been low in dissolved oxygen.
It can be observed that the NT and SC treatments had greater Macro in the surface layer, which resulted in higher values of airspace, which can promote root development in this layer. Reduced airspace is a factor that contributes to rapid saturation of the soil, and as the Albaqualf has poor natural drainage (Pinto et al., 2004; Santos et al., 2013), one rainfall of 15 mm would be enough for soil water saturation in the assessments.
The variation in RP with the decrease in water content in the soil found in this study
confirms the results of Reichert et al. (2009), in which water content close to 0.25 m3
m-3
led to an RP below 1.5 MPa, and near 0.15 m3 m-3, an RP of 3 MPa. RP values greater
than 2 MPa are characterized as restrictive to root growth (Reichert et al., 2009; Collares
et al., 2011). This variable is very dependent on soil water content (Bengough et al., 2006; Assis et al, 2009). Thus, water acts as a lubricant by reducing friction between soil particles (Assis et al., 2009) and decreasing the RP.
Table 4. Height and shoot dry matter in V5 and VT, leaf area, number of ears, height of the first ear, number of grains per ear, and grain yield under different tillage management practices in a rice area
Treatment Height Dry matter Leaf area Ears Height of
1st
ear
Grains per ear
Grain yield
V5 VT V5 VT
m g cm² No. m-2
m No. Mg ha-1
Experiment 1 (2013/14 crop season)
Soil management
Chiseling 0.96 a 2.29 a 15 a 98 a 6267 a 7.5 ns
1.40 a 364 a 9.0 a
Conventional 0.87 b 1.94 b 13 b 76 b 5215 b 7.4 1.29 b 327 b 8.0 b
No-tillage 0.85 b 2.01 b 12 b 85 ab 5716 ab 7.6 1.30 b 346 ab 8.8 ab
Raised seedbed
Without 0.91 ns
2.03 b 13 ns
91 ns
5487 ns
7.6 ns
1.32 ns
336 ns
8.5 ns
With 0.88 2.13 a 13 94 5978 7.4 1.33 355 8.7
Mean 0.90 2.08 13 93 5733 7.5 1.33 346 8.6
CV (%) 4.4 4.4 12.1 10.1 9.9 4.8 3.5 6.2 7.5
Experiment 2 (2014/15 crop season)
Soil management
Chiseling 1.11 a 2.17 a 13 a 103 a 6806 a 8.1 a 1.12 a 441 a 12.3 a
Conventional 0.94 b 1.96 c 9 b 79 b 5099 c 7.4 b 1.04 b 375 b 10.0 c
No-tillage 0.98 b 2.08 b 10 ab 86 b 5756 b 8.0 a 1.05 b 399 ab 11.1 b
Raised seedbed
Without 0.99 ns
2.04 b 11 ns
85 b 5799 b 7.8 ns
1.03 b 394 ns
10.5 b
With 1.03 2.10 a 11 94 a 5975 a 7.9 1.12 a 415 ns 11.8 a
Mean 1.01 2.07 11 60 5887 7.8 1.08 405 11.1
CV (%) 9.0 3.2 19.9 14.2 8.1 3.9 6.3 8.7 7.0
The consequences of high values of RP for the plant depend on the developmental
stage of the crop and the time that the plant is subjected to this stress (Bengough et al., 2006). Therefore, plants in the SC and SB treatments were exposed to a shorter period
of limitation to root development. The least change in RP in all treatments at lower soil water content in the 0.00-0.05 m layer is related to lower BD and greater PT and Macro. These are conditions that favor greater variation in RP with a variation in water content.
The highest grain yield and best results of other crop variables in the SC and SB treatments arise from an increase in Macro from the rupture of more dense soil layers, which also reduced the RP and increased the soil airspace. However, SC and SB provided shorter periods of stress to the crop roots. In addition, drainage was facilitated in these treatments, and because of it, there was probably an increase in the amount of air in the soil, favoring
root respiration. Corroborating the results found for excess water conditions with lack of
airspace, Fiorin et al. (2009) observed lower production of fresh and dry matter of corn grown in an Albaqualf under surplus water situations.
The 10 % increase in grain yield in the NT treatment compared to the CT is related to increased Macro in the surface layer, an increase in biopores, and maintenance of
aggregates (Beutler et al., 2014). Additionally, in nutrient cycling through ryegrass, the lack of incorporation of organic matter may have contributed to better utilization of nutrients by the corn. Incorporation of organic matter increases its exposure to soil microorganisms,
speeding release of nutrients. This process entails losses since, at the initial stage, the plant
has lower uptake of nutrients. These results corroborate Vernetti Junior et al. (2009), who
also found corn yield increases in no-tillage compared to conventional tillage before sowing.
In the second year, there was greater rainfall after emergence, and in the SB treatment, yield was higher than in the WS. The results suggest that sowing on raised seedbeds is a safer practice for corn in these areas, especially in years of greater rainfall. In addition to promoting better soil physical conditions and facilitating drainage, sowing on raised seedbeds can enable furrow irrigation in these areas with irrigation systems already installed for surface irrigation in rice. However, aside from higher fuel consumption at the time of sowing, sowing on raised seedbeds is slower, and this is the main obstacle to adoption of
this practice by producers. Construction of raised seedbeds in the off-season and sowing
on them at the recommended time would be a viable alternative to solve this problem.
Better rainfall distribution in the initial phase and in the period that preceded and followed bolting in the second crop favored higher grain yield. Bergamaschi et al. (2006)
suggested that the bolting phase is the most sensitive to water deficit. Another climate variable that influenced higher grain yield was the average air temperature at the time of bolting, which was higher in Experiment 1, and may have caused pollination problems
and, consequently, a reduction in the number of grains per ear.
In addition to the weather conditions, the chemical characteristics of the soil in Experiment 2,
such as lower potential acidity, the absence of aluminum saturation, pH, and higher
effective CEC compared to Experiment 1, also influenced grain yield. These improvements in soil chemical parameters can be explained by the liming performed the year before sowing Experiment 2. In addition, fertilization carried out based on grain yield expected
in the second year was superior.
In general, the highest grain yield was found in treatments with lower RP, higher Macro, and airspace in the region of the root system. Due to these characteristics, the crop was
subjected to fewer restrictions caused by water stress through reducing the period of low availability of oxygen. From these results, we conclude that the corn crop is viable
for areas in rotation with irrigated rice, though with some considerations. In addition to
improvements in soil physical properties, there must be an effective system of surface
drainage to remove free water from rainfall in the growing area. Furthermore, the possibility
CONCLUSIONS
Sowing in chiseling soil provides increased grain yield in corn in an Albaqualf (lowland) compared to sowing after conventional tillage.
In years with more rain, sowing on raised seedbeds provides increased corn yields in an Albaqualf. Soil chiseling increases soil macroporosity at greater depth, reducing resistance to penetration compared to conventional tillage and no-tillage.
In the raised seedbed, the soil has less resistance to mechanical penetration, lower density, and higher macroporosity compared to soil without a raised seedbed.
REFERENCES
Alvares CA, Stape JL, Sentelhas PC, Gonçalves JLM, Sparovek G. Köppen’s climate classification map for Brazil. Meteorol Zeitschrift. 2013;22:711-28. https://doi.org/10.1127/0941-2948/2013/0507 Andres A, Avila LA, Marchezan E, Menezes VG. Rotação de culturas e pousio do solo na redução do banco de sementes de arroz vermelho em solo de várzea. Rev Bras Agrocienc. 2001;7:85-8.
https://doi.org/10.18539/CAST.V7I2.377
Assis RL, Lazarini GD, Lancas KP, Cargnelutti Filho A. Avaliação da resistência do solo à penetração em diferentes solos com a variação do teor de água. Eng Agríc. 2009;29:558-68.
https://doi.org/10.1590/S0100-69162009000400006
Bamberg AL, Pauletto EA, Gomes AS, Timm LC, Pinto LFS, Lima ACR, Silva TR. Densidade de um
Planossolo sob sistemas de cultivo avaliada por meio da tomografia computadorizada de raios
gama. Rev Bras Cienc Solo. 2009;33:1079-86. https://doi.org/10.1590/S0100-06832009000500001
Bengough AG, Bransby MF, Hans J, McKenna SJ, Roberts TJ, Valentine TA. Root responses
to soil physical conditions; growth dynamics from field to cell. J Exp Bot. 2006;57:437-47. https://doi.org/10.1093/jxb/erj003
Bergamaschi H, Dalmago GA, Comiran F, Bergonci JI, Müller AG, França S, Santos AO, Radin B,
Bianchi CAM, Pereira PG. Déficit hídrico e produtividade na cultura do milho. Pesq Agropec Bras.
2006;41:243-9. https://doi.org/10.1590/S0100-204X2006000200008
Beutler AN, Munareto JD, Greco AMF, Pozzebon BC, Galon L, Guimarães S, Burg G, Schmidt MR, Deak EA, Giacomeli R, Alves GS. Manejo do solo, palha residual e produtividade de arroz irrigado por inundação. Semina: Cienc Agrár. 2014;35:1153-62.
https://doi.org/10.5433/1679-0359.2014v35n3p1153
Beutler AN, Munareto JD, Ramão CJ, Galon L, Dias NP, Pozzebon BC, Rodrigues LAT, Munareto GS, Giacomeli R, Ramos PV. Propriedades físicas do solo e produtividade de arroz irrigado em diferentes sistemas de manejo. Rev Bras Cienc Solo. 2012;36:1601-7.
https://doi.org/10.1590/S0100-06832012000500024
Colet MJ, Sverzut CB, Weirich Neto PH, Souza ZM. Alteração em atributos físicos de um solo sob pastagem após escarificação. Cienc Agrotec. 2009;33:361-8.
https://doi.org/10.1590/S1413-70542009000200001
Collares GL, Reinert DJ, Reichert JM, Kaiser DR. Compactação superficial de Latossolos sob integração lavoura-pecuária de leite no noroeste do Rio Grande do Sul. Cienc Rural.
2011;41:246-50. https://doi.org/10.1590/S0103-84782011000200011
Companhia Nacional de Abastecimento - Conab. Perspectiva de safra 2015/16 [internet].
Brasília, DF: 2016 [acesso em: 10 mar 2016]. Disponível em: http://www.conab.gov.br/
conteudos.php?a=1252&.
Donagema GK, Campos DVB, Calderano SB, Teixeira WG, Viana JHM, organizadores. Manual de métodos de análise de solo. 2a ed rev. Rio de Janeiro: Embrapa Solos; 2011.
Drewry JJ, Cameron KC, Buchan GD. Pasture yield and soil physical property responses
to soil compaction from treading and grazing - a review. Soil Res. 2008;46:237-56.
Empresa Brasileira de Pesquisa Agropecuária - Embrapa. Indicações técnicas para o cultivo de milho e de sorgo no Rio Grande do Sul – Safras 2013/2014 e 2014/2015. Brasília, DF: 2013.
Fiorin TT, Spohr RB, Carlesso R, Michelon CJ, Santa CD, David GD. Produção de silagem
de milho sobre camalhões em solos de várzea. Pesq Aplic Agrotecnol. 2009;2:147-53.
https://doi.org/10.5777/paet.v2i1.442
Galon L, Panozzo LE, Noldin JA, Concenço G, Tarouco CP, Ferreira EA, Agostinetto D,
Silva AA, Ferreira FA. Resistência de Cyperus difformis a herbicidas inibidores da ALS
em lavoura de arroz irrigado em Santa Catarina. Planta Daninha. 2008;26:419-27.
https://doi.org/10.1590/S0100-83582008000200019
Marcolin CD, Klein VA. Determinação da densidade relativa do solo por uma função de
pedotransferência para a densidade do solo máxima. Acta Scient Agron. 2011;33:349-54.
https://doi.org/10.4025/actasciagron.v33i2.6120
Matzenbacher FO, Kalsing A, Meneze VG, Barcelos JAN, Merotto Junior A. Rapid diagnosis
of resistance to imidazolinone herbicides in barnyardgrass (Echinochloa crus-galli) and
control of resistant biotypes with alternative herbicides. Planta Daninha. 2013;31:645-56. https://doi.org/10.1590/S0100-83582013000300016
Moraes MT, Debiasi H, Franchini JC, Silva VR. Soil penetration resistance in a Rhodic
Eutrudox affected by machinery traffic and soil water content. Eng Agríc. 2013;33:748-57.
https://doi.org/10.1590/S0100-69162013000400014
Ortigara C, Koppe E, Luz FB, Bertollo AM, Kaiser DR, Silva VR. Uso do solo e propriedades físico-mecânicas de Latossolo Vermelho. Rev Bras Cienc Solo. 2014;38:619-26.
https://doi.org/10.1590/S0100-06832014000200026
Pinto LFS, Neto LAJ, Pauletto EA. Solos de várzea do Sul do Brasil cultivados com arroz irrigado. In: Gomes AS, Magalhães Jr AM, editores técnicos. Arroz irrigado no sul do Brasil. Brasília,
DF: Embrapa Informação Tecnológica; 2004. p.75-95.
Reichert JM, Kaiser DR, Reinert DJ, Riquelme UFB. Variação temporal de propriedades físicas do solo e crescimento radicular de feijoeiro em quatro sistemas de manejo. Pesq Agropec Bras.
2009;44:310-9. https://doi.org/10.1590/S0100-204X2009000300013
Ritchie SW, Hanway JJ, Benson GO. How a corn plant develops. Ames, Iowa: State University of Science and Technology; 1993. (Special report, 48).
Roso AC, Merotto Jr A, Delatorre CA. Bioensaios para diagnóstico da resistência
aos herbicidas imidazolinonas em arroz. Planta Daninha. 2010;28:411-9.
https://doi.org/10.1590/S0100-83582010000200021
Santos HG, Jacomine PKT, Anjos LHC, Oliveira VA, Oliveira JB, Coelho MR, Lumbreras JF, Cunha TJF. Sistema brasileiro de classificação de solos. 3a ed rev. ampl. Rio de Janeiro: Embrapa Solos; 2013. Sangoi L, Schmitt A, Zanin CG. Área foliar e rendimento de grãos de híbridos de
milho em diferentes populações de plantas. Rev Bras Milho Sorgo. 2007;6:263-71.
https://doi.org/10.18512/1980-6477/rbms.v6n3p263-271
Schaedler CE, Noldin JA, Eberhardt DS, Agostinetto D, Burgos NR. Globe fringerush (Fimbristylis miliacea) cross resistance to als-inhibitor herbicides under field
conditions in irrigated rice in the south of Brazil. Planta Daninha. 2013;31:893-902.
https://doi.org/10.1590/S0100-83582013000400016
Six J, Bossuyt H, Degryze S, Denef K. A history of research on the link between (micro)
aggregates, soil biota, and soil organic matter dynamics. Soil Till Res. 2004;79:7-31.
https://doi.org/10.1016/j.still.2004.03.008
Soil Survey Staff. Keys to soil taxonomy. 12th ed. Washington, DC: United States Department of
Agriculture, Natural Resources Conservation Service; 2014
Theisen G, Vernetti Junior FJ, Silva JJC. Manejo da cultura da soja em terras baixas em safras
com El-Niño. Pelotas: Embrapa Clima Temperado; 2009.
Vernetti Junior FJ, Gomes AS, Schuch LOB. Sucessão de culturas em solos de várzea