ISSN: 1809-4430 (on-line) www.engenhariaagricola.org.br
2 Universidade Estadual Paulista "Júlio de Mesquita Filho"/ Jaboticabal - SP, Brasil. 3 Universidade Federal da Grande Dourados/ Dourados - MS, Brasil.
Received in: 8-9-2017 Accepted in: 12-5-2017
Doi:http://dx.doi.org/10.1590/1809-4430-Eng.Agric.v38n2p 225-231/2018
PERFORMANCE OF CORN SOWING IN FERTILIZATION SYSTEM AND INTERCROPPING
Jorge W. Cortez
1*, Carlos E. A. Furlani
2, Rouverson P. da Silva
2, Sálvio N. S. Arcove rde
31*Corresponding author. Universidade Federal da Grande Dourados/ Dourados - MS, Brasil. E-mail: [email protected]
KEYWORDS
previous fertilization,
intercropping, fuel
consumption,
agricultural
mechanization,
slippage.
ABSTRACT
The performance of the tractor-seeder can be influenced by factors related to the seeder,
as loads and crop
.
The aim of the present study was to evaluate the performance of
tractor-seeder at sowing in the corn crop in function of the fertilizer systems (at
pre-sowing and at pre-sowing) and those intercropping of crops (corn + bean-Stizolobium
deeringianum, corn + bean-Cajanus cajan and corn + bean-Dolichos lab lab). The
experiment was carried out at FCAV-UNESP with totally randomized delineation, on
factorial scheme (2x3) with four repetitions. The use of fertilization during the pre-sowing
resulted in greater displacement speed and effective field capacity in the corn sowing
operation, without changing the distribution of corn seeds; however, it demanded more
power and volumetric and weight hourly consumption of the tractor fuel.
INTRODUCTION
The adoption of No-tillage Systems (NTS) is essential for the sustainability of various agricultural activities. It involves reduction of soil rotation, crops rotation and maintenance of adequate amount of vegetation covering the soil, aiming at soil conservation and profitability. The different conditions imposed by soil preparation influences the performance of agricultural mach ines and implements, which have to adapt to promote high operational capacity (Chioderoli et al., 2010).The sowing-fertilization operations are fundamental for the establishment of annual grain-producing crops. In NTS, due to the minimal tilling and maintenance of the vegetation cover on the soil surface, there is usually an increase in soil resistance to penetration and, consequently, greater difficulties during the seed and fertilizer deposition process than those verified in conventional preparation, especially in those where there is intense soil mobilization, and greater care is required in relation to the operational and management conditions of the cover (Trogello et al., 2013a; Trogello et al., 2013b).
The performance of the tractor-seeder set in
intercropping of crops (crotalaria+guandu and
mucuna+guandu) remained constant when evaluating the actual speed of displacement and field capacity, obtaining, respectively, 6.4 and 6.3 km h-1, and 3.0 ha h-1 (Reis et al., 2007).
However, according to Ch ioderoli et al. (2012), when evaluating the operational performance of the
tractor-seeder set in the soybean crop on corn straw intercropped with two forage species (Urochloa brizantha
and Urochloa ruzizienses), verified greater slippage on the
front wheel of the tractor (20.3%) in the cultivation system (Urochloa in the interline of the corn sown together with
the cover fertilizer in the V4 stage) - MBC, attributing this result to the largest quantity of straw produced in this system in co mparison to the intercropped corn - C, as well as to the dynamic distribution of the weight of the tractor (40% front axle and 60% rear axle), which, coupled with the type of tire, may have altered the front wheel drive, increasing slippage. They also observed that the traction force and the average power in the drawbar rod presented lower values in C (20.7 kN and 20.3 kW) and corn with
Urochloa in the corn sowing line, mixed with base manure
and deposited at 0.10 m - MBL (20.3 kN and 20.1 kW) when compared to MBC (26.0 kN and 25.3 kW), suggesting that in areas with higher amounts of straw the energy demand of the tractor-seeder set is larger.
mach ines in function of these factors can represent important information aiming to subsidize the selection of agricultural systems that increase the capacity of the mach ines and reduce the energy expenditure at sowing operations (Furlani et al., 2004) and soil preparation (Ch ioderoli et al., 2010).
Another factor that must be evaluated at sowing is the uniformity of seed distribution, wh ich is obtained by the correct regulation of the tractor-seeder and suitability, and it has been reported as one of the ways to increase the productivity of certain crops, among which corn stands out as the most representative (Weirich Neto et al., 2015). However, operational factors, such as distribution error, seed deposition and seed depth done by the seeder can be influenced by the speed of corn sowing, damaging the initial stand and establishment of plants in the crop (Vian et al., 2016). The speed directly affects the uniformity of longitudinal distribution of seeds, which is essential for an adequate plant density and, consequently, to improve crop productivity (Santos et al., 2011; Sangoi et al., 2012).
Although studies show that the performance of mach ines may not be related to intercropping systems (Reis et al., 2007), but with other factors such as soil preparation (Furlani et al., 2004, Ch ioderoli et al., 2010) and management of the cover (Reis et al., 2007), it is necessary to search the establishment of the corn crop, for each cultivar and in the different conditions of soil management, intercropping and fertilization. For this reason, the aim of this study was to evaluate the performance of the tractor-seeder set in the NTS, in function of the fertilization systems (pre-sowing and at sowing) and with corn intercropping (bean-Stizolobium deeringianum, bean-Cajanus cajan and bean-Dolichos lab lab).
MATERIAL AND MET HODS
The experiment was conducted in an experimental area of UNESP, Jaboticabal, São Paulo, located in the
geodesic coordinates: latitude 21º14’S and longitude 48º16’W, with average altitude of 559 m, average slope of
4%, in an area of approximately 1.5 ha. The climate according to the Köeppen classification is Aw, subtropical humid, with drought in the winter. The soil of the experimental area was the typical eutrophic Red Latosol, A moderate, clayey texture and smooth undulated relief.
The experimental area was fallo w in 1999 and 2000, in the first year and part of the second year, with infestation of weeds such as Panicum maximum Jacq. and
Cynodon dactylon (L.) Pers. In the field, the weeds were managed with mo wer, and later, the conventional soil preparation with heavy harrow and two light harrows at the end of 2000.Then, the crops were used in the summer harvest in succession such as soybean and corn, and in the winter, crops for rotation such as millet, gray mucuna, crotalaria, sorghum, triticale and oats, until the implantation of this experiment, in a no-tillage system, with beginning in the 2006/2007 harvest.
A randomized co mplete b lock design was used in the 2 x 3 factorial scheme, with four replications, two fertilizer application systems (pre-sowing and at sowing) and three intercropping (corn + bean-Stizolobium deeringianum, corn + bean-Cajanus cajan and corn +
bean-Dolichos lab lab). Each experimental p lot occupied
an area of 300 m2 (25 x 12 m) and, between plots, in the
longitudinal direction, a space of 15 m was reserved for maneuvering, machine traffic and stabilization of the sets.
A Valtra BM 100 tractor, BM-100 model, 4x2 FWD, with power of 73.6 kW (100 hp) in the engine was used as traction source. It had a mass of 5,400 kg (40% front and 60% rear), front tires of 14.9 - 24 R1 with 3.8 m perimeter and inflation pressure of 18 psi (124 kPa), and rear tires of 23.1 - 26 R1 with 4.9 m perimeter and inflation pressure of 22 psi (152 kPa). The precision seed drill used was from Marchesan, Cop Supreme model, with seven spacing lines spaced in 0.45 m, equipped with a
straw cutting disk for 18” (45.7 cm), a furrow rod with the
following characteristics: 2.7 diameter of tip, 1.0 cm of rod thickness, distance of the cutting disc to the rod of 12 cm, relation between the height and the length of the tip (H/L) of 1.06 and attack angle of 20°, mis matched double disc of
15”(38.1 cm) for deposition of the seed, and a pneumatic
distributor. The fertilizer deposit has a capacity of 1,310 kg and the seed of 200 kg, and the tractor-seeder has 2,070 kg, working with 655 kg of fertilizer in the sowing operation.
The application of the fertilizer in pre-sowing was carried out 46 days before the deposition of the corn seeds. At the time of sowing, in the treatment with advance fertilization, only the seeds were deposited, the fertilizer mechanis m (furro w rod) is removed fro m the seeder, allo wing the increase of the speed of the tractor-seeder to 6.6 km h-1 because it does not have one of the furrows components. For the application of fertilizer along with the sowing, the seeder was used with all the opening and fin ishing mechanisms of soil - cutting disc, furrow rod for fertilizer, double disk for seed and compacting wheels, resulting in the speed of 4.7 km h-1, the fertilizer being distributed only in the row of corn sowing. In both fertilization operations (pre-sowing and at sowing), the rotation of the tractor's engine was 2,000 rp m.
At sowing, the intercropping was sown interspaced with a spacing of 0.45 m of corn, and the spacing of the corn rows was 90 cm. The treatments consisted of plants intercropped with corn (corn + bean-Stizolobium deeringianum, corn + bean-Cajanus cajan and corn +
bean-Dolichos lab lab) and were obtained at the time of
sowing, they were sown with a double disc at seven centimeters of depth, while the corn was sown at three centimeters, to obtain delay in the emergence of intercropping and better development of the corn.
The interspaced crops used to form the intercropping were: Ca janus cajan, habit of indeterminate
shrub growth, with sowing at a density of 9 seeds per meter and final population of 103,500 p lants per hectare;
Stizolobium deeringianum Bort., an indeterminate growth
habit, with sowing at a density of 12 seeds per meter and final population of 31,900 plants per hectare, and seeds of
Dolichos lab lab with climb ing habit, sowing at density of
9 seeds per meter and final population of 90,900 plants per hectare. The corn was sown with 6 seeds per meter of the simp le hybrid DKB390 and resulted in a final population of 65,980 p lants per hectare.
drawbar, the M. SHIMIZU load cell, TF400 model, with a sensitivity of 2.156 mV V-1, coupled between the tractor and the seeder, was used, as described by Silveira et al. (2013). The peak force was determined taking into account the higher value collected during the work in the plot.
The average power in the drawbar was determined by [eq. (1)]. The peak power was obtained by calculating the highest value of the tractive force on the drawbar.
(1) That,
PD - Power in the drawbar (kW);
TF - Average tractive force on the drawbar (N); S - Actual displacement speed (m s-1),
1.000 - Constant of transformation.
To measure the instantaneous speed, a radar unit located on the right side of the tractor was used, RVS II type, with a slope of 45º in relation to the soil. The effective field capacity was calculated using [eq. (2)].
(2) That,
Efc - Effective field capacity (ha-1);
Aw - Average working width of the seeder (m); S - Actual travel speed (km h-1),
10 - Conversion factor for ha h-1.
The energy consumption (EC) was obtained indirectly by [eq. (3)]. The peak energy consumption was obtained considering the highest power value obtained during the data collection in the plot.
(3) That,
PD - Power in the drawbar (kW), Efc - Effective field capacity (ha h-1).
To measure fuel consumption, sensors and meters were used, automatically connected to the data acquisition system. Based on the volume consumed, the hourly volume, weighted, effective and specific consumption were determined using eqs (4), (5), (6) and (7), respectively.
(4) That,
VHc - Volu metric hourly fuel consumption (Lh-1); C - Vo lu me consumed (mL);
t - Course time on the plot (s),
3.6 - Conversion factor.
(5) That,
WHc - Weight hourly fuel consumption (kg h-1), VHc - Volu metric hourly fuel consumption (Lh-1),
FD - Fuel density (g L-1), 1,000 - Conversion factor.
(6) That,
Efc - Effective fuel consumption (L ha-1);
VHc - Volu metric hourly fuel consumption (L h-1), Efc - Effective field capacity (ha h-1).
(7) That,
SFC - Specific fuel consumption (gkW h-1); WHc - Weight hourly fuel consumption (kg h-1);
PT - Power (kW), 1,000 - Conversion factor.
In order to evaluate the slippage of the tractor's driving wheels, rotation sensors (pulse generators) were used by the manufacturer S & E Instrumento de Teses e Medições LTDA; model: GIDP-60-12V; power supply: 12 Vcc; and ratio of impulses/turn: 60, located in the center of each wheels, wh ich perform conversion of rotary movements in electrical pulses. The slippage was determined by the ratio between the number of pulses recorded for each wheel when traveling through the unloaded plot, and the number of pulses recorded for each wheel when traveling the plot with load using [eq. (8)].
(8) That,
Sp - Slippage (%);
NPU - number of pulses of the tractor wheel unloaded in the drawbar, and
NPL - nu mber of pulses of the tractor wheel loaded in the drawbar.
The efficiency of the tractor-seeder in relation to the establishment was calculated in function of the amount of seeds distributed at sowing and the amount of seedlings emerged in the field, according to Portella et al. (1997) for corn and the crops used in the intercropping in two meters in the central part of the plot.
In the evaluation of the longitudinal distribution or uniformity of spacing between corn seedlings and crops for intercropping was measured using a one meter wooden batten with a metric tape (0.5 cm accuracy) glued, in which a cable was put, also of wood, forming an inverted
“T”. The readings were performed in the central row of
each plot in two meters.
The percentage of normal, failures and double spacing was determined (Cortez et al., 2009, Trogello et al., 2013a; Trogello et al., 2013b; Melo et al., 2013; Weirich Neto et al., 2015; Arcoverde et al., 2016), considering percentages of spacing: “double” (D): <0.5 times the Xref; “normal” (A): 0.5 <Xref <1.5, and “failures” (F):> 1.5 the Xref, where the expected average
for the intercropping Stizolobium deeringianum, Cajanus cajan and Dolichos lab lab was 0.11; 0.0853 and 0.11 m,
respectively.
The data were submitted to analysis of variance and when the value of the F test was significant at least 5% probability, the Tukey test was performed at 5% probability for the comparison of averages.
RES ULTS AND DISCUSS ION
The average traction force (TF) and the peak traction force in the drawbar (PTF) (Table 1) did not change in function of the fertilization systems (F) and the intercropping (C), as well as in the interaction between both in the sowing operation. For the average power in the drawbar (PD) and peak power in the traction bar (PP) (Table 1), the fertilization systems influenced the result, while the intercropping and the interaction F versus C did not affect these variables. The PD, in pre -sowing fertilization, was 32.8% higher than fertilization at sowing. This fact can also be verified in PP, which was 29.3% higher with fertilization in pre-sowing, in relation to fertilization at sowing due to the difference in speed of treatments.
The TF can be affected by the active organs in contact with the soil, as well as by the depth of the work (Lopes et al., 2010; Palma et al., 2010; Francetto et al., 2015). Studies have shown that when the depth of the furrow rod is increased, the tractive force requirement increases (Lopes et al., 2010; Palma et al., 2010) when working at lower speeds, the required force increases (Francetto et al., 2015). However, in this experiment, even with the removal of the furrow rod fro m the fertilization system in pre-sowing, there was no decrease in TF. It is possible that the soil layer in which there was an action of the opening mechanism provided low mechanical resistance of the soil to the shear, which was also verified by Palma et al. (2010) who found an inverse relation between TF and soil compaction, especially when the furrow rod tip works in the more resistant layers, offering greater soil resistance to penetration.
TABLE 1. Synthesis of variance analysis for TF - average traction force on drawbar, PD - average power on drawbar, PTF - peak traction force on drawbar, PP - peak power on drawbar during sowing.
Factors TF (kN) PTF (kN) PD (kW) PP (kW) Fertilization (F)
Pre-sowing 13.9 17.3 25.5 A 31.8 A At sowing 14.6 18.7 19.2 B 24.6 B Intercropping (C)
Stizolobium
deeringianum 15.2 19.0 23.8 29.8
Cajanus cajan 13.5 17.3 21.1 26.7
Dolichos lab lab 14.0 17.8 22.0 28.0
F Test
F 0.4 ns 1.0 ns 15.2 ** 14.7 **
C 0.8 ns 0.6 ns 0.9 ns 0.9 ns
F x C 0.1 ns 0.4 ns 0.3 ns 0.9 ns
CV 18.8 18.4 17.7 16.4
Averages followed by same letter in column do not differ by Tukey test. ns: not significant (P> 0.05); *: significant (P≤0,05);
**: significant (P≤0,01); CV: coefficient of variation (%).
The coefficients of variation (CVs) obtained for the TF, PTF, PD and PP variables (Table 1) were lower than those verified by Ch ioderoli et al. (2010), who studied the
operational performance of tractor-seeder in no-tillage and, using the same mach inery and area of this study, found CVs close to 23% for TF and PTF and 22% for PD and PP. Normally, data related to the soil present greater variations, since changes in structure, texture, and other components may change, influencing the coefficient of variation values. This was observed by Mahl et al. (2004), who when evaluating the energy demand and seed distribution efficiency of a tractor-seeder for no-tillage of corn in a dystrophic Red Nitosol, observed CVs of 5.3 and 5.9%, respectively, for TF and PD, both in the no-tillage condition and at speeds of 4.4; 6.1 and 8.1 km h-1, being classified as low.
The displacement speed for the sowing operation (Table 2) resulted in the pre-sowing fertilization of 40.4% higher than that obtained during sowing with fertilization. Consequently, the effective field capacity (Efc) was affected by the fertilization factor, since it is dependent on the speed of the tractor displacement. The intercropping and interaction did not affect the speed of the displacement and the Efc. Regard ing the displacement speed, the tractor gear affects directly it, and consequently obtains the highest Efc.
TABLE 2. Synthesis of variance analysis for speed (S), effective field capacity (Efc), average energy consumption (EC) and peak energy consumption (PEC) during sowing.
Factors (km hV -1) (ha hEfc -1) (kW h haEC -1) (kW h haPEC -1)
Fertilization (F)
Pre-sowing 6.6 A 1.8 A 10.7 13.3 At sowing 4.7 B 1.3 B 11.3 14.4 Intercropping (C)
Stizolobium
deeringianum 5.7 1.5 11.7 14.7
Cajanus cajan 5.6 1.5 10.5 13.3
Dolichos lab lab 5.7 1.5 10.8 13.7
F Test
F 3302.3 ** 1298** 0.4 ns 1.0 ns
C 0.4 ns 1.0 ns 0.8 ns 0.6 ns
F x C 2.7 ns 0.3 ns 0.1 ns 0.5 ns
CV 1.4 2.9 18.8 18.4
Averages followed by same letter in column do not differ by Tukey test. ns: not significant (P> 0.05); *: significant (P≤0.05);
**: significant (P≤0.01); CV: coefficient of variation (%).
The factors and interaction tested did not alter the average energy consumption (EC) and peak energy consumption (PEC) (Table 2). Chioderoli et al. (2012) observed the effect of different systems of intercropping with brachiaria on these variables, attributed to the quantity of straw.
The coefficient of variation (CV) data for the displacement speed and the effective field capacity (Table 2) are in agreement with Furlan i et al. (2004) who observed CV values close to 2% for Efc, since it derives fro m the power value in the drawbar that is influenced by soil attributes.
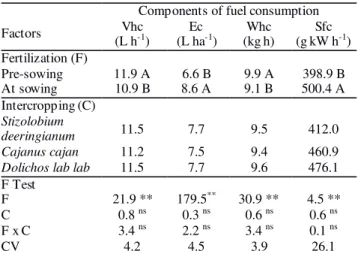
the pre-sowing fertilization presented the lowest consumption (30.3%), due to the greater effective field capacity. As Ec is related to PD, the higher displacement speed of the set for the system with the pre-sowing fertilization and the lower speed for the fertilization system at sowing affected it.
TABLE 3. Synthesis of analysis of variance for hourly fuel consumption (Vhc), effective consumption (Ec), weight consumption (Whc) and specific consumption (Sfc) during sowing.
Components of fuel consumption Factors (L hVhc -1) (L haEc -1) (kg h) Whc (g kW hSfc -1)
Fertilization (F)
Pre-sowing 11.9 A 6.6 B 9.9 A 398.9 B At sowing 10.9 B 8.6 A 9.1 B 500.4 A Intercropping (C)
Stizolobium
deeringianum 11.5 7.7 9.5 412.0
Cajanus cajan 11.2 7.5 9.4 460.9
Dolichos lab lab 11.5 7.7 9.6 476.1
F Test
F 21.9 ** 179.5** 30.9 ** 4.5 **
C 0.8 ns 0.3 ns 0.6 ns 0.6 ns
F x C 3.4 ns 2.2 ns 3.4 ns 0.1 ns
CV 4.2 4.5 3.9 26.1
Averages followed by same letter in column do not differ by Tukey test. ns: not significant (P> 0.05); *: significant (P≤0.05);
**: significant (P≤0.01); CV: coefficient of variation (%).
The values of the coefficient of variation (CVs) for fuel consumption (Table 3) were lo wer than those obtained by CHIODEROLLI et al. (2012) in a study conducted in the same experimental area and, us ing the same data acquisition system, and observed CVs higher than 20% when evaluating the effect of three tillage systems (conventional, no-tillage and reduced) and two spacing for corn crop (0.45 and 0.90 m).
The fuel consumption was influenced by the power in the drawbar, wh ich was affected by the speed of displacement (Salvador et al., 2009; Palma et al., 2010). One of the reasons for increased fuel consumption is the increase in the tractive force, which, however, d id not occur in this study. The higher effective fuel consumption is justified by the reduction of the effective field capacity of the set during sowing.
The fuel consumption accounts for 30% of the hourly cost of an agricultural tractor and adequate tractor power can lead to a 20% reduction in fuel consumption (Gamero et al., 1986).The use of the appropriate speed for loads below 65% of tractor power can save 15% to 30% on fuel consumption (Hertz, 1985). Thus, considering the power used in the fertilization system in the pre-sowing that was higher than in sowing, there was lower specific fuel consumption for sowing in the pre-fertilization condition, indicating a better adaptation of the displacement speed of the tractor.
The front (FS) and rear slippage of the tractor (RS) was not affected by the fertilization and intercropping systems (Table 4), being in some treatments, below the recommended standard for maximu m traction efficiency –
slippage fro m 8 to 10% in non-mobilized soils and from 11 to 13% in mobilized soils (ASAE, 1989). Low slipping values can occur due to over-ballasting or over-scaling of the machine, wh ich can increase working depth, pulling force and power in the drawbar (Lopes et al., 2010).The FS was affected by the joint action of fertilization systems and intercropping (Table 5).The data of the coefficient of variation for slippage are close to those verified by Chioderoli et al. (2010), however, three times higher than the value reported by Furlani et al. (2004) under no-tillage system, which can be attributed to the different edaphoclimatic conditions, as well as to the management of straw in the area in question. Due to the small vibrations presented by the coupling system of the sensor to the wheel, it may have caused small v ibrations, increasing the variation of the measurements.
The distribution efficiency of the tractor-seeder (Table 4) for co rn was not affected by the tested factors and interactions, whereas the seed distribution efficiency of the intercropped crops was verified only in the corn +
Stizolobium deeringianum intercropping, which may be
related to the seed being large, making both the vertical disc selection process of the tractor-seeder and the suction vacuum regulation d ifficult, even though the suction should be the same on all ro ws or with Stizolobium deeringianum and corn.
TABLE 4. Synthesis of the variance analysis for forward slippage (FS), rear slippage (RS), distribution efficiency of tractor-seeder for corn (EFM) and crops (EFC).
Tractor slippage Tractor-seeder efficiency Factors FS (%) RS (%) EFM (%) EFC (%) Fertilization (F)
Pre-sowing 5.7 6.3 104.7 63.3
At sowing 7.5 8.0 99.7 69.7
Intercropping (C)
Stizolobium
deeringianum 7.2 8.1 102.1 31.4 B
Cajanus cajan 6.3 7.0 106.5 79.1 A
Dolichos lab lab 6.4 6.4 97.8 89.0 A
F Test
F 2.3 ns 1.5 ns 0.9 ns 1.3 ns
C 0.3 ns 0.6 ns 0.9 ns 42.6 **
F x C 3.9 * 2.3 ns 0.5 ns 0.3 ns
CV 45.3 46.7 12.5 20.0
Averages followed by same letter in column do not differ by Tukey test. ns: not significant (P> 0.05); *: significant (P≤0.05);
**: significant (P≤0.01); CV: coefficient of variation (%).
Analyzing the interaction F versus C for FS (Tab le 5), we observed that this variable within each fertilization system does not differ in any intercropping. However, when analyzing each intercropping, for Stizolobium deeringianum in the fertilization system, at sowing, the FS
TABLE 5. Interaction between the fertilization (f) and intercropping (c), for forward slippage - FS (%).
Fertilization
Intercropping Pre-sowing At sowing
Stizolobium
deeringianum 4.6 Ab 9.8 Aa
Cajanus cajan 4.7 Aa 7.8 Aa
Dolichos lab lab 7.8 Aa 4.9 Aa
Averages followed by the same capital letter in the column and lowercase in the row do not differ from each other by the Tukey test at 5% probability.
At sowing, as there is the presence of the furrow rod, there is greater resistance and consequently greater slippage in the front wheel of the tractor (Palma et al., 2010). According to Santos et al. (2008), the larger slip
values may be related to the groove opening system fo r the fertilizer, wh ich is a rod type.
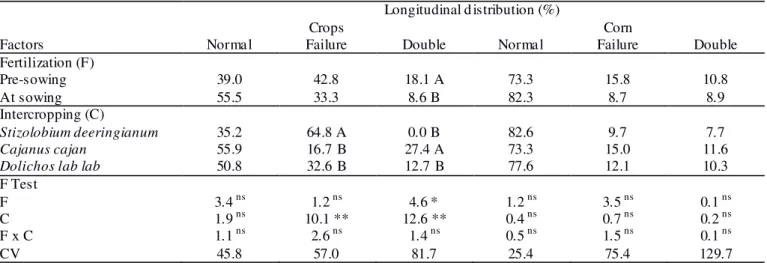
The longitudinal distribution of seedlings of crops intercropped with corn (Tab le 6) was altered for the failures and double spacing. For failures spacing, the highest values occurred in the intercropping with
Stizolobium deeringianum, which is related to the seed
distribution efficiency by the tractor-seeder (Table 4), due to the larger size of the seed, making it difficult to adjust the vacuum system. In the double spacing, there were differences in the factors of fertilization and intercropping systems with Cajanus cajan, which is related to the small
size of the seed, which must have filled an alveolus with two seeds. The factors and interactions tested (P> 0.05) d id not alter the longitudinal distribution for corn.
TABLE 6. Synthesis of variance analysis for longitudinal distribution (normal, failure and double) of the crops and for corn.
Longitudinal d istribution (%)
Crops Corn
Factors Normal Failure Double Normal Failure Double
Fertilization (F)
Pre-sowing 39.0 42.8 18.1 A 73.3 15.8 10.8
At sowing 55.5 33.3 8.6 B 82.3 8.7 8.9
Intercropping (C)
Stizolobium deeringianum 35.2 64.8 A 0.0 B 82.6 9.7 7.7
Cajanus cajan 55.9 16.7 B 27.4 A 73.3 15.0 11.6
Dolichos lab lab 50.8 32.6 B 12.7 B 77.6 12.1 10.3
F Test
F 3.4 ns 1.2 ns 4.6 * 1.2 ns 3.5 ns 0.1 ns
C 1.9 ns 10.1 ** 12.6 ** 0.4 ns 0.7 ns 0.2 ns
F x C 1.1 ns 2.6 ns 1.4 ns 0.5 ns 1.5 ns 0.1 ns
CV 45.8 57.0 81.7 25.4 75.4 129.7
Averages followed by same letter in column do not differ by Tukey test. ns: not significant (P> 0.05); *: significant (P≤0.05); **: significant
(P≤0.01); CV: coefficient of variation (%).
The values obtained for normal distribution were below the capacity of the pneumatic seeder, wh ich should have as target 90% of normal spacing (Tourino et al., 2009; Melo et al., 2013; Weirich Neto et al., 2015) wh ich makes it possible to classify the quality of the seeder as good (75 to 90%) and bad for the crops (25 to 50%).
The percentage of failures spacing presented coefficient of variation (CV) similar to that obtained by Santos et al. (2011) and Arcoverde et al. (2016) that, even evaluating the longitudinal distribution of the pneumatic tractor-seeder at higher speeds, verified a high variability in the operation. In contrast, the CV fo r normal spacing allo ws to infer in low variability throughout the sowing process (Arcoverde et al., 2016), not reaching the target due to the variability of the other indicators.
Thus, it is possible to classify the sowing process of the corn crop in this experiment as suitable, fro m the agronomic point of view, because the CV of the normal spacing is 25.4%. For the sowing process of intercropping crops, the process can be classified as below the min imu m expected goal of the operation, due to the high CV values.
CONCLUS IONS
The use of crop in intercropping with corn does not affect the implantation of the crop and does not increase the energy demand of the operation.
The pre-sowing fertilization allows developing a greater displacement speed in the sowing operation, without affecting the unifo rmity of corn seed distribution, however, with a change in the distribution of the intercropping and distribution efficiency by the tractor-seeder.
With the rise of the displacement speed in the sowing and of the effective field capacity, there is the increase of the required power and the decrease of the effective fuel consumption.
ACKNOWLEDGMENTS
The authors thank to the Foundation for Support to the Development of Education, Science and Technology of the State of Mato Grosso do Sul - FUNDECT for the financial support for execution and dissemination of this study and the Coordination for the Improvement of Higher Personnel Education - CAPES for granting the scholarship to the first author.
REFERENCES
ASAE. Agricultural tractor test code. In:______. ASAE standards 1989: standards engineering practices data. San
Joseph, 1989. p 44-48. (ASA E S209.5)
Chioderoli CA, Furlani CEA, Aguiar AO, Cavich ioli FA, Cassia MT (2012) Operational parameters of soybean seeding in Santa Fé System. Engenharia Agrícola 32(5):900-908.
Chioderoli CA, Furlani CEA, Silva RP, Gitti DC, Kaneko FH, Ro man AA (2010) Desempenho de semeadora-adubadora em função do preparo de solo e espaçamento da cultura do milho. Pesquisa Agropecuária Tropical
40(4):462-467.
Cortez JW, Furlani CEA, Vigna GP, Borsatto EA, Silva RP (2009) Desempenho do trator agrícola no manejo da cultura de cobertura e pressão de inflação do pneu da semeadora. Engenharia Agríco la 29(1):72-80.
Francetto TR, A lonço AS, Bellé MP, Franck CJ, Dauto PC (2015) Co mportamento operacional de associações entre sulcadores e discos de corte para sistema de semeadura direta. Revista Brasileira Engenharia Agrícola e Ambiental 35(3):542-554.
Furlan i, CEA, Gamero, CA, Lev ien, R, Lopes, A, Silva, RP (2004) Desempenho operacional de uma semeadora-adubadora de precisão, em função do preparo do solo e do manejo da cobertura de inverno. Engenharia Agrícola 24(2):388-395.
Gamero CA, Benez SH, Furlani Júnior JR (1986) Análise do consumo de combustível e da capacidade de campo teórica de diferentes sistemas de preparo periódico do solo. In: Congresso Brasileiro de Engenharia Agrícola.
Botucatu, Sociedade Brasileira de Engenharia Agrícola, Anais... p1-9.
Hertz EJ (1985) Energy conservation in mechanized agriculture in Chile. Agricultural Mechanization in Ásia, África and Latin A merica 16(1):1-7.
Lopes A, Camara FT, La Scala Júnior N, Furlani CEA, Silva RP, Barbosa ALPB (2010) Desempenho operacional de um protótipo “aerossol”. Engenharia Agrícola
30(1):82-91.
Mahl D, Gamero CA, Benez SH, Furlani CEA , Silva ARB (2004) Demanda energética e eficiência da distribuição de sementes de milho sob variação de velocidade e condição de solo. Engenharia Agríco la 24(1):150-157.
Melo RP, A lbiero D, Monteiro LA, Souza FH, Silva JG (2013) Qualidade na distribuição de sementes de milho em semeadoras em u m solo cearense. Revista Ciência
Agronômica 44(1):94-101.
Palma MAZ, Vo lpato CES, Barbosa JA, Spagnolo RT, Barros MM, Vilas Boas LA (2010) Efeito da profundidade de trabalho das hastes sulcadoras de uma semeadora-adubadora na patinagem, na fo rça de tração e no consumo de combustível de um trator agrícola. Engenharia Agrícola 34(5):1320-1326.
Portella JÁ, Sattler A, Faganello, A (1997) Desempenho de elementos rompedores de solo sobre o índice de emergência de soja e de milho em plantio d ireto no sul do Brasil. Engenharia na Agricultura 5(3):209-217.
Reis GN, Silva GN, Furlani CEA , Cavalin Neto J, Grotta DCC, Cortez JW (2007) Manejo do consórcio com culturas de adubação verde em sistema p lantio direto. Acta Scientiaru m29 (supl.):677-681.
Salvador N, Benez SH, Mion RL (2009) Demanda energética na subsolagem realizada antes e depois de diferentes sistemas de preparo periódico do solo. Ciência Rural 39(9):2501-2505.
Sangoi L, Sch mitt A, Vieira J, Picoli GJ, Sou za CA, Casa RT, Schenatto DE, Gio rdani W, Boniatti CM, Machado GC, Horn D (2012) Variabilidade na distribuição espacial de plantas na linha e rendimento de grãos de milho. Revista Brasileira de Milho e Sorgo 11(3):268-277.
Santos AJM, Gamero, CA, Oliveira RB, Villen A C (2011) Análise espacial da distribuição longitudinal de sementes de milho em u ma semeadora-adubadora de precisão. Bioscience Journal 27(1):16-23.
Santos AP, Vo lpato CES, Tourino MCC (2008) Desempenho de três semeadoras-adubadoras de plantio direto para a cultura do milho. Ciência e Agrotecnologia 32(2):540-546.
Silveira, JCM, Fernandes, HC, Modolo, AJ, Silva, SL, Trogello, E (2013) Demanda energética de u ma semeadora-adubadora em diferentes velocidades de deslocamento e rotações do motor. Revista Ciência Agronômica 44(1):44-52.
Tourino MCC, Rezende PM, Silva LA, Almeida LGP (2009) Semeadoras-adubadoras em semeadura convencional de soja. Ciência Rural 39(1):241-245.
Trogello E, Modolo AJ, Scarsi M, Silva C, Ladami PF, Dallacort R (2013a) Manejos de cobertura vegetal e velocidades de operação em condições de semeadura e produtividade de milho. Revista Brasileira Engenharia Agrícola e A mb iental 17(7):796-802.
Trogello E, Modolo AJ, Scarsi M, Dallacort R (2013b) Manejos de cobertura, mecanismos sulcadores e velocidades de operação sobre a semeadura direta da cultura do milho. Bragantia 72(1):101-109.
Vian A L, Santi A L, A mado TJC, Cherubin MR, Simon DH, Damian JM, Bredemeier C (2016) Variabilidade espacial da produtividade de milho irrigado e sua correlação co m variáveis exp licativas de planta. Ciência Rural 46(3):464-471.