Revista Ambiente & Água - An Interdisciplinary Journal of Applied Science: v. 7, n. 1, 2012. Tel.: (12) 3625-4212
Hydro-geochemical evaluation of groundwater quality in Akoko North
West local government area of Ondo State, Nigeria
(http://dx.doi.org/10.4136/ambi-agua.851)
Temitope D. T. Oyedotun1; Opeyemi Obatoyinbo2
1
Department of Geography and Planning Sciences, Faculty of Social Sciences, Adekunle Ajasin University, P. M. B. 001, Akungba-Akoko, Ondo State, Nigeria.
e-mail: oyedotuntim@yahoo.com;
2
Department of Geology, Faculty of Science, Adekunle Ajasin University, P. M. B. 001, Akungba-Akoko, Ondo State, Nigeria.
e-mail: obatope2@yahoo.com
ABSTRACT
A sudden geometric increase in population of Akoko North West Local Government Area of Ondo State has led to an increase in demand for water and harnessing of subsurface water reserve. A total of twenty six water samples obtained from both boreholes and hand-dug wells were analyzed for their physico-chemical characteristics with the aim of assessing their quality, usability and also to determine the level of their contamination in the local government which is dominated by granite gneisses, charnockites, and augen gneisses as the main rock types. The following physico-chemical properties were analyzed for in the samples collected: electrical conductivity (EC), pH, total alkalinity (TA), total dissolved solids (TDS), total suspended solids (TSS), acid neutralizing capacity (ANC) with major cations (Na+, Mg2+, Ca2+), anions (PO43-, HCO3-,SO43-) and several heavy metals (Zn2+, Fe2+, As+, Ni+, Pb2+, Cd+, Cu2+). The following results were obtained from the analysis: Zn2+ (0.109 – 0.437 ppm), Fe2+ (0.216 – 0.726 ppm), As+ (0.01 – 0.03 ppm), Ni+ (0.036 – 0.074), Pb2+ (0.003 – 0.010), Cd+ (0.002 – 0.007), Cu2+ (0.086 – 0.241) with appreciable abundances of PO43-, Cd+, Fe2+and Ni+ some exceeding while some others are below the WHO acceptable level for drinking water, thereby making it a serious source of concern as it indicates varying levels of faecal contamination (from leaky septic tanks, interception with pit latrines) and heavy metal liberation into the water consumed by the residents. It was also noticed that the water was fresh based on the analysis of the Total Dissolved Solids and the Pb2+ concentrations almost exceeded the standard permissible limit. Generally, it was concluded that the overall quality of the ground water is averagely good physico-chemically.
Keywords: water samples; physico-chemical properties; water quality.
Avaliação hydrogeoquímica da qualidade da água subterrânea na área
Akoko North West do governo local do estado Ondo, Nigéria
RESUMO
finalidade de avaliar sua qualidade, usabilidade e determinação de seu nível de contaminação na área do governo local, que é dominado principalmente pelas rochas de granito, gnaisses, charnockitos e augen gnaisse. As seguintes propriedades físico-químicas das amostras coletadas foram analisadas: condutividade elétrica (CE), pH, alcalinidade total (AT), sólidos totais dissolvidos (TDS), sólidos suspensos totais (SST), a capacidade de neutralização de ácido (CNA), com os principais cátions (Na+, Mg2+, Ca2+), ânions (PO43-, HCO3-, SO43-) e vários metais pesados (Zn2+, Fe2+, As+, Ni+, Pb2+, Cd+, Cu2+). Os seguintes resultados foram obtidos: Zn2+ (0,109 – 0,437 ppm), Fe2+ (0,216 – 0,726 ppm), As+ (0.01 – 0.03 ppm), Ni+ (0,036 – 0,074), Pb2+ (0,003 – 0,010), Cd+ (0,002 – 0,007), Cu2+ (0,086 – 0,241), com concentrações apreciáveis de PO43-, Cd+, Fe2+e Ni+ algumas superiores, enquanto outras abaixo do nível aceitável da WHO para água potável, fato que se constitui em grande preocupação, pois indica níveis variáveis de contaminação fecal (de vazamento de fossas sépticas e de latrinas) e contaminação de metais pesados na água consumida pelos moradores. Também foi observado que a água era doce com base na análise dos sólidos totais dissolvidos e que as concentrações de Pb2+quase ultrapassaram o limite padrão estabelecido. Observou-se que a qualidade físico-química global da água do solo é medianamente boa.
Palavras-chave: amostras de água; propriedades físico-químicas; qualidade da água.
1. INTRODUCTION
Water is a very important component of the earthly environment. Throughout the history of man, water has always been sustaining life and serving communities. The importance of the quality of available water cannot, however, be over-emphasised. As far as Nigeria is concerned, there is abundant of surface and groundwater resources, particularly in the South-Western region which is entirely within the tropical rainforest zone (Obatoyinbo and Oyedotun, 2011). Rijswijk (1981) estimated the groundwater resources at 0 – 50m depth in Nigeria to be 6 x 10⁶ km3 (6 x 10⁶ m3). However, from the eight mega regional aquifers in Nigeria which Akujieze et al., (2003) estimated, the deposit of the total groundwater yields additional groundwater resources of 7.2 times Rijswijk’s figure, the total of which is estimated to be 50 million trillion l/year (Akujieze et al., 2003). Earlier, Hanidu (1990) has estimated the surface water resources in Nigeria to be 224 trillion l/year. Hence, with the available surface water resources of 224 trillion litre per year (l/year) and about 50 million trillion l/year as groundwater resources, there is an assured water abundance in Nigeria. Any shortfall in meeting the rising population needs is principally due to harnessing, distribution, delivery and quality (Hanidu, 1990; Akujieze et al., 2003).
Through the International Drinking Water Supply and Sanitation Decade (1980 – 1990), the NPC (2006) recommended and proposed water for all by the year 2000. For this to be achieved, Nigeria launched a National Borehole Programme, which included 760 boreholes with only 228 (30%) being productive (Akujieze et al., 2003). The failure of this project may be due to poor knowledge of groundwater disposition in Nigeria, the bureaucratic nature of government projects or the attitude of new political government officials to discard their predecessors initiated projects, resulting in those ventures to be white-elephant projects. With the view and understanding that groundwater is much more of high quality than surface water (which are exposed to all sorts of pollution), individuals have been embarking on digging wells in their neighbourhood and apartments to meet their growing water needs for their multifarious purposes.
2004). Therefore, groundwater is not entirely pure water because it usually contains dissolved mineral ions (Okagbue, 1988). The type and concentration of these dissolved minerals can affect the usefulness of groundwater for different purposes (Boyle, 1988). If certain mineral constituent are present in excessive amounts, some type of treatment may be necessary to either change or remove the dissolved mineral before the water can be used for the intended purpose. The major cations found in groundwater include calcium (Ca2+), magnesium (Mg2+), sodium (Na+), potassium (K+) and anions such as bicarbonate (HCO3-), sulphates (SO42-), chloride (Cl-) with non-ionic constituents like oxides, phenols, synthetic detergents, dissolved gases e.g. oxygen (O2) and carbon dioxide (CO2) (Tijani, 1994). These constituents result in the good quality of groundwater when they are present in optimum concentrations.
A sudden geometric increase in the population of Akoko North West Local Government of Ondo State, Nigeria which has reached 213,792 (UN, 2006) has led to an increase in the demand for water and harnessing of subsurface water reserve. This paper investigates the possible infiltration of dissolved mineral (either from weathered rock or anthropogenic sources) into subsurface water in the area (basement complex rocks), and comparing the mineral level with the set standard for quality water by the World Health Organization (WHO). The main objectives of this study are: to determine the suitability of the water in the study area for human consumption from WHO established standard, and to determine the level as well as source of contaminants where applicable. Physical tests and chemical tests for several parameters were also carried out using specific set of scientific experimental standard (Omotoyinbo and Okafor, 2008).
1.1.The Study Area
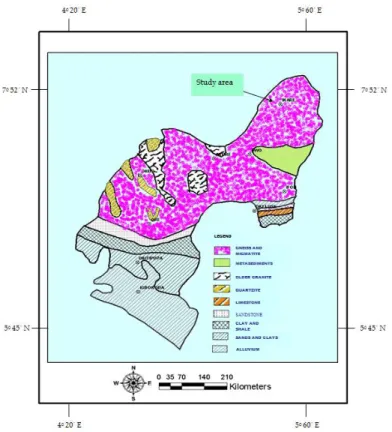
The study area (Akoko North West) is one of the eighteen Local Governments that made up Ondo State in the South-Western Region of Nigeria. It falls within latitudes 7°30′ and 7°35′N and longitudes 5°43′ and 5°49′E. The area is accessible by roads and footpaths and it occupies about 0.83km2 in aerial extent (Figure 1). Topographically, the area is characterised by a relatively rugged, undulating, topography with outcrops of charnockites, migmatite gneiss with other gneissic rocks as highlands which range between 600 and 1500feet above sea level. It is situated within the Precambrian Basement Complex with the outcrops which are predominantly gneiss and migmatite (Figure 2). With this type of rock types, their ability to serve as aquifers compared to sedimentary aquifers is very minimal with limited small amount of groundwater storage within the crystalline basement. The failure rate of the new boreholes in the study area is as high as 80% (Edet et al., 1998), which is as a result of the geological configurations of the study area. The groundwater availability is, however, limited to fracture zones and areas of deep weathering. The topography of Ikare (the capital of the Local Government) is high with undulating relief of about 200m to more than 1500m high. There are knolls, ridges and flat lying exposures observed in the area. The western part is characterized by a conical hill relief – outcrops of batholiths is scattered in the southern part of the area towards Ikare and Okeagbe. Eastward, the area is featured by lowland outcrops and sparsely characterized with gneissic ridges. The major road runs from southwest to northwest.
Figure 1. Map of Ondo State Showing the study area. Inset:
Map of Nigeria showing Ondo State.
Figure 2. Geologic Map of Ondo State showing Geology
and the location of the study area.
Source: Geological Survey Nigeria, Ondo State.
the rainforest and Guinea Savannah’s vegetation, which is characterized by different plants and trees which may reach a height of 5 m and even more. They consist of light forests, shrubs and scattered cultivation.
There are areas where rocks are covered by vegetation which is also an indication of the porosity of the rocks and function of the grain size. Trees and plants like timber, oil palm, kolanut, rubber, cocoa and citrus are very prominent in these areas. A high forest zone is found in the north while the southern part is mostly Sub-Savannah due to the farming activities in the area, which had actually reduced the thickly vegetated area.
2. MATERIAL AND METHODS
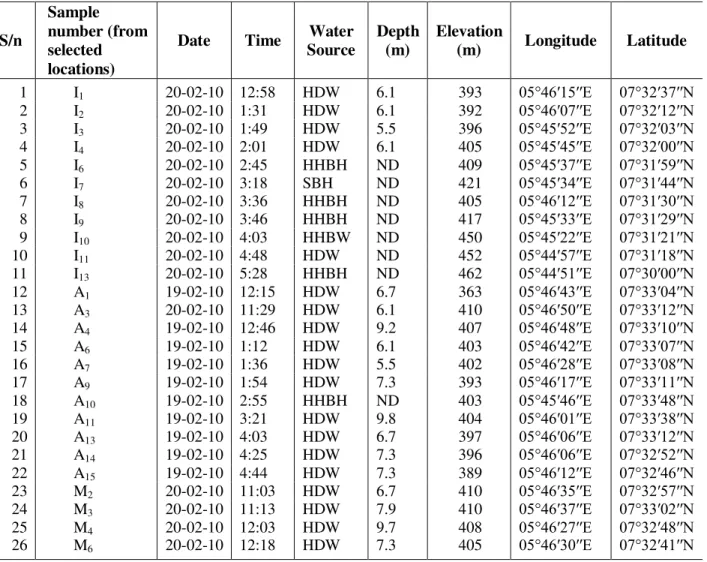
Groundwater samples were collected from the hand-held boreholes, Solar powered boreholes and hand-dug wells at various locations and different depths in the study area. The details of the sampling site and depths are given in Table 1 below. The samples were then taken to the International Institute for Tropical Agriculture (IITA), Ibadan, Oyo State of Nigeria for the analysis of all the parameters (physico-chemical parameters, cations, anions and the heavy metals), after which relevant statistical packages were also used to analyse the data and their level of significance was determined.
Table 1. Summary of the derivations from the GPS readings from sample collection and other readings. S/n Sample number (from selected locations)
Date Time Water
Source
Depth (m)
Elevation
(m) Longitude Latitude
1 I1 20-02-10 12:58 HDW 6.1 393 05°46′15′′E 07°32′37′′N
2 I2 20-02-10 1:31 HDW 6.1 392 05°46′07′′E 07°32′12′′N
3 I3 20-02-10 1:49 HDW 5.5 396 05°45′52′′E 07°32′03′′N
4 I4 20-02-10 2:01 HDW 6.1 405 05°45′45′′E 07°32′00′′N
5 I6 20-02-10 2:45 HHBH ND 409 05°45′37′′E 07°31′59′′N
6 I7 20-02-10 3:18 SBH ND 421 05°45′34′′E 07°31′44′′N
7 I8 20-02-10 3:36 HHBH ND 405 05°46′12′′E 07°31′30′′N
8 I9 20-02-10 3:46 HHBH ND 417 05°45′33′′E 07°31′29′′N
9 I10 20-02-10 4:03 HHBW ND 450 05°45′22′′E 07°31′21′′N
10 I11 20-02-10 4:48 HDW ND 452 05°44′57′′E 07°31′18′′N
11 I13 20-02-10 5:28 HHBH ND 462 05°44′51′′E 07°30′00′′N
12 A1 19-02-10 12:15 HDW 6.7 363 05°46′43′′E 07°33′04′′N
13 A3 20-02-10 11:29 HDW 6.1 410 05°46′50′′E 07°33′12′′N
14 A4 19-02-10 12:46 HDW 9.2 407 05°46′48′′E 07°33′10′′N
15 A6 19-02-10 1:12 HDW 6.1 403 05°46′42′′E 07°33′07′′N
16 A7 19-02-10 1:36 HDW 5.5 402 05°46′28′′E 07°33′08′′N
17 A9 19-02-10 1:54 HDW 7.3 393 05°46′17′′E 07°33′11′′N
18 A10 19-02-10 2:55 HHBH ND 403 05°45′46′′E 07°33′48′′N
19 A11 19-02-10 3:21 HDW 9.8 404 05°46′01′′E 07°33′38′′N
20 A13 19-02-10 4:03 HDW 6.7 397 05°46′06′′E 07°33′12′′N
21 A14 19-02-10 4:25 HDW 7.3 396 05°46′06′′E 07°32′52′′N
22 A15 19-02-10 4:44 HDW 7.3 389 05°46′12′′E 07°32′46′′N
23 M2 20-02-10 11:03 HDW 6.7 410 05°46′35′′E 07°32′57′′N
24 M3 20-02-10 11:13 HDW 7.9 410 05°46′37′′E 07°33′02′′N
25 M4 20-02-10 12:03 HDW 9.7 408 05°46′27′′E 07°32′48′′N
26 M6 20-02-10 12:18 HDW 7.3 405 05°46′30′′E 07°32′41′′N
Magellan SporTrak® handheld Global Positioning System (GPS) Receivers device with 12-channel tracking and differential correction capability was used to determine and identify location where the water samples are selected, especially with the aid of a topographical map covering the study area. The SporTrak Map GPS used can track up to 12 satellites at any time out of the current constellation, and it fully supports the Wide Area Augmentation System (WAAS) with the accuracy within 3 metres or better depending on the line of sight to the satellite. Tape rule and sample bottles are other materials made use of in the field.
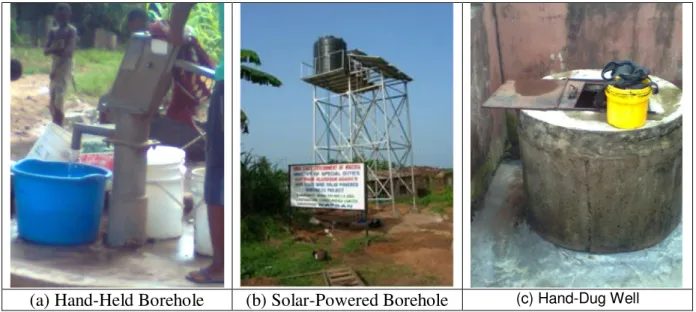
Twenty six water samples were collected from various locations in the Local Government Area on the 19th and 20th of February 2010 and the samples were used for the assessment of water quality which comprise nineteen hand dug wells and seven boreholes (examples of which are shown in Figure 3 below). These constitute the major sources of water for the inhabitants. About 20 millilitres of water samples were collected from both the hand dug wells and boreholes into clean plastic containers. The samples were then labelled and preserved (in the refrigerator) until they were taken to the laboratory for chemical analysis. The water samples were analyzed for electrical conductivity (EC), pH, total alkalinity (TA), total dissolved solids (TDS), total suspended solids (TSS), acid neutralizing capacity (ANC) with major cations (Na+, Mg2+, Ca2+), anions (PO43-, HCO3-,SO43-) and several heavy metals (Zn2+, Fe2+, As+, Ni+, Pb2+, Cd+, Cu2+) using the Buck Model 205 Atomic Absorption Spectrophotometer and flame photometer for the cations.
(a) Hand-Held Borehole (b) Solar-Powered Borehole (c) Hand-Dug Well
Figure 3. Example of (a) Hand Held Borehole, (b) Solar Powered Borehole and (c) Hand-dug well in the study area.
The chemical character of any water determines its quality and utilization. The quality is a function of the physical, chemical and biological parameters and could be subjective since it depends on a particular intended use (Tijani, 1994). Hence, there are different water quality standards and are generally based on two main criteria. These include the presence of objectionable taste, odour and colour plus the availability of substances with adverse physiological health effects (Tijani, 1994).
The quality of water, whether it is used for drinking, irrigation or recreational purposes is significant for health in both developing and developed countries worldwide. Water quality can have a major impact on health, either through outbreaks of waterborne diseases or by contributing to the background rates of the diseases. Accordingly, countries develop water quality standards to protect public health (Ramanathan, 2004).
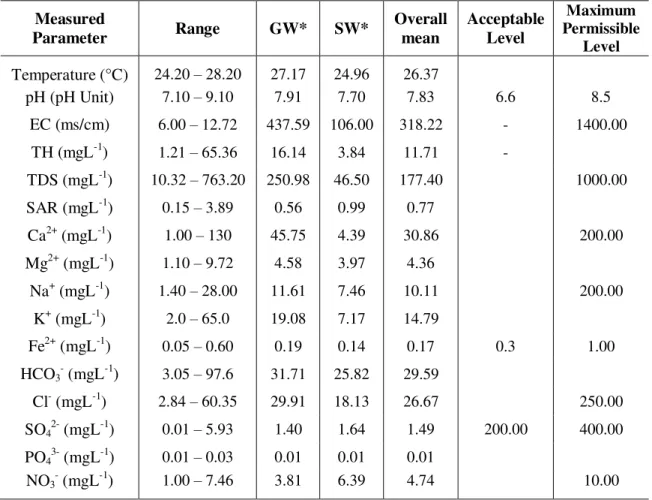
establishing effective national or regional strategies and standards. The physical parameters such as pH, EC, TDS etc and chemical parameters such as Ca2+, Mg2+, Na+, Fe2+, Cl-, SO4 2-with other heavy metal concentrations should be 2-within the WHO acceptable standards. Therefore, the findings from the analyses are compared with WHO set standard to evaluate the groundwater quality in the local government (the study area). The World Health Organization (WHO, 1984) recommended a standard for drinking water quality. Table 2 below gives the example of these recommendations.
Table 2. Summary of Physical and Chemical Characteristics and WHO (1984) standards for drinking water.
Measured
Parameter Range GW* SW*
Overall mean
Acceptable Level
Maximum Permissible
Level
Temperature (°C) 24.20 – 28.20 27.17 24.96 26.37
pH (pH Unit) 7.10 – 9.10 7.91 7.70 7.83 6.6 8.5
EC (ms/cm) 6.00 – 12.72 437.59 106.00 318.22 - 1400.00
TH (mgL-1) 1.21 – 65.36 16.14 3.84 11.71 -
TDS (mgL-1) 10.32 – 763.20 250.98 46.50 177.40 1000.00
SAR (mgL-1) 0.15 – 3.89 0.56 0.99 0.77
Ca2+ (mgL-1) 1.00 – 130 45.75 4.39 30.86 200.00
Mg2+ (mgL-1) 1.10 – 9.72 4.58 3.97 4.36
Na+ (mgL-1) 1.40 – 28.00 11.61 7.46 10.11 200.00
K+ (mgL-1) 2.0 – 65.0 19.08 7.17 14.79
Fe2+ (mgL-1) 0.05 – 0.60 0.19 0.14 0.17 0.3 1.00
HCO3
(mgL-1) 3.05 – 97.6 31.71 25.82 29.59
Cl- (mgL-1) 2.84 – 60.35 29.91 18.13 26.67 250.00
SO4
(mgL-1) 0.01 – 5.93 1.40 1.64 1.49 200.00 400.00
PO43- (mgL-1) 0.01 – 0.03 0.01 0.01 0.01
NO3
(mgL-1) 1.00 – 7.46 3.81 6.39 4.74 10.00
GW*= Groundwater; EC = Electrical Conductivity; TH = Total Hardness; SAR = Sodium Absorption Ratio; SW* = Surface water (mean concentration) for each group; TDS = Total Dissolved Solid.
Source: World Health Organization (1984, 1997)
3. RESULTS
The analysis of the findings, which is centred on laboratory test of the water samples collected from both (mechanical and solar powered) boreholes and hand-dug wells and are termed to be ideal for human consumption, are compared with the WHO standards for drinking waters.
Table 3. The concentrations of Anion, Cation and heavy metal from the water samples at the study area.
Sample Particulars
mgL-1
Ca2+ Ni+ Fe2+ Cu2+ Zn2+ Cd+ As+ Pb2+ Mg2+ Na+ HCO3- SO42- PO4
2-I1 11.117 0.071 0.521 0.106 0.169 0.006 0.002 0.008 5.011 21.081 0.018 0.026 0.041
I2 9.856 0.056 0.561 0.136 0.248 0.005 0.001 0.009 4.220 19.322 0.015 0.029 0.039
I3 11.327 0.066 0.521 0.098 0.165 0.007 0.003 0.008 5.026 20.056 0.019 0.031 0.044
I4 12.170 0.053 0.513 0.241 0.388 0.007 0.002 0.007 5.716 18.716 0.021 0.026 0.042
I6 9.986 0.066 0.608 0.161 0.297 0.005 0.002 0.009 4.218 21.732 0.017 0.029 0.037
I7 10.771 0.059 0.613 0.217 0.402 0.005 0.003 0.007 4.761 20.156 0.019 0.018 0.039
I8 10.350 0.049 0.512 0.206 0.351 0.004 0.002 0.010 4.113 21.520 0.013 0.029 0.041
I9 9.988 0.056 0.518 0.116 0.306 0.006 0.002 0.008 4.216 19.116 0.015 0.031 0.042
I10 11.731 0.058 0.498 0.224 0.437 0.006 0.003 0.009 5.005 21.681 0.013 0.026 0.043
I11 10.156 0.058 0.601 0.185 0.372 0.004 0.002 0.010 4.371 17.115 0.014 0.036 0.041
I13 12.001 0.061 0.533 0.177 0.298 0.005 0.002 0.008 5.296 19.781 0.016 0.028 0.083
A1 8.176 0.036 0.351 0.111 0.167 0.002 0.001 0.005 3.005 14.216 0.011 0.017 0.019
A3 8.151 0.041 0.314 0.132 0.121 0.002 0.001 0.004 3.256 16.081 0.010 0.014 0.021
A4 9.086 0.039 0.298 0.091 0.136 0.003 0.002 0.005 1.986 13.713 0.012 0.021 0.024
A6 10.722 0.044 0.341 0.106 0.203 0.002 0.001 0.005 2.013 12.118 0.010 0.015 0.018
A7 9.165 0.043 0.288 0.116 0.213 0.003 0.001 0.005 1.965 11.811 0.009 0.017 0.022
A9 8.986 0.039 0.216 0.092 0.167 0.004 0.002 0.004 2.850 13.381 0.013 0.014 0.021
A10 8.932 0.041 0.306 0.086 0.143 0.003 0.002 0.006 2.117 12.156 0.012 0.021 0.019
A11 9.006 0.036 0.281 0.095 0.147 0.004 0.002 0.003 2.658 13.118 0.012 0.020 0.022
A13 9.156 0.039 0.269 0.089 0.132 0.003 0.001 0.004 2.134 14.218 0.013 0.017 0.020
A14 8.111 0.042 0.325 0.106 0.211 0.003 0.002 0.005 3.216 12.116 0.011 0.015 0.018
A15 8.635 0.046 0.341 0.093 0.123 0.004 0.002 0.004 3.186 13.148 0.012 0.019 0.020
M2 12.167 0.041 0.726 0.113 0.109 0.007 0.003 0.009 7.114 26.081 0.017 0.031 0.053
M3 13.151 0.069 0.691 0.094 0.120 0.008 0.003 0.009 7.215 24.115 0.015 0.029 0.049
M4 11.328 0.074 0.688 0.121 0.307 0.007 0.002 0.008 6.932 25.168 0.019 0.033 0.048
M6 14.715 0.073 0.701 0.091 0.140 0.008 0.003 0.010 7.910 27.108 0.017 0.034 0.151
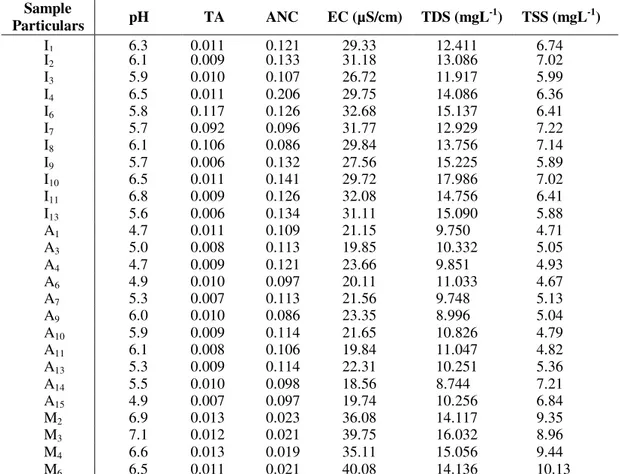
Table 4. The concentrations of physical parameters from the water samples at the study area TDS (mgL-1); TSS (mgL-1).
Sample
Particulars pH TA ANC EC (µS/cm) TDS (mgL
-1
) TSS (mgL-1)
I1 6.3 0.011 0.121 29.33 12.411 6.74
I2 6.1 0.009 0.133 31.18 13.086 7.02
I3 5.9 0.010 0.107 26.72 11.917 5.99
I4 6.5 0.011 0.206 29.75 14.086 6.36
I6 5.8 0.117 0.126 32.68 15.137 6.41
I7 5.7 0.092 0.096 31.77 12.929 7.22
I8 6.1 0.106 0.086 29.84 13.756 7.14
I9 5.7 0.006 0.132 27.56 15.225 5.89
I10 6.5 0.011 0.141 29.72 17.986 7.02
I11 6.8 0.009 0.126 32.08 14.756 6.41
I13 5.6 0.006 0.134 31.11 15.090 5.88
A1 4.7 0.011 0.109 21.15 9.750 4.71
A3 5.0 0.008 0.113 19.85 10.332 5.05
A4 4.7 0.009 0.121 23.66 9.851 4.93
A6 4.9 0.010 0.097 20.11 11.033 4.67
A7 5.3 0.007 0.113 21.56 9.748 5.13
A9 6.0 0.010 0.086 23.35 8.996 5.04
A10 5.9 0.009 0.114 21.65 10.826 4.79
A11 6.1 0.008 0.106 19.84 11.047 4.82
A13 5.3 0.009 0.114 22.31 10.251 5.36
A14 5.5 0.010 0.098 18.56 8.744 7.21
A15 4.9 0.007 0.097 19.74 10.256 6.84
M2 6.9 0.013 0.023 36.08 14.117 9.35
M3 7.1 0.012 0.021 39.75 16.032 8.96
M4 6.6 0.013 0.019 35.11 15.056 9.44
M6 6.5 0.011 0.021 40.08 14.136 10.13
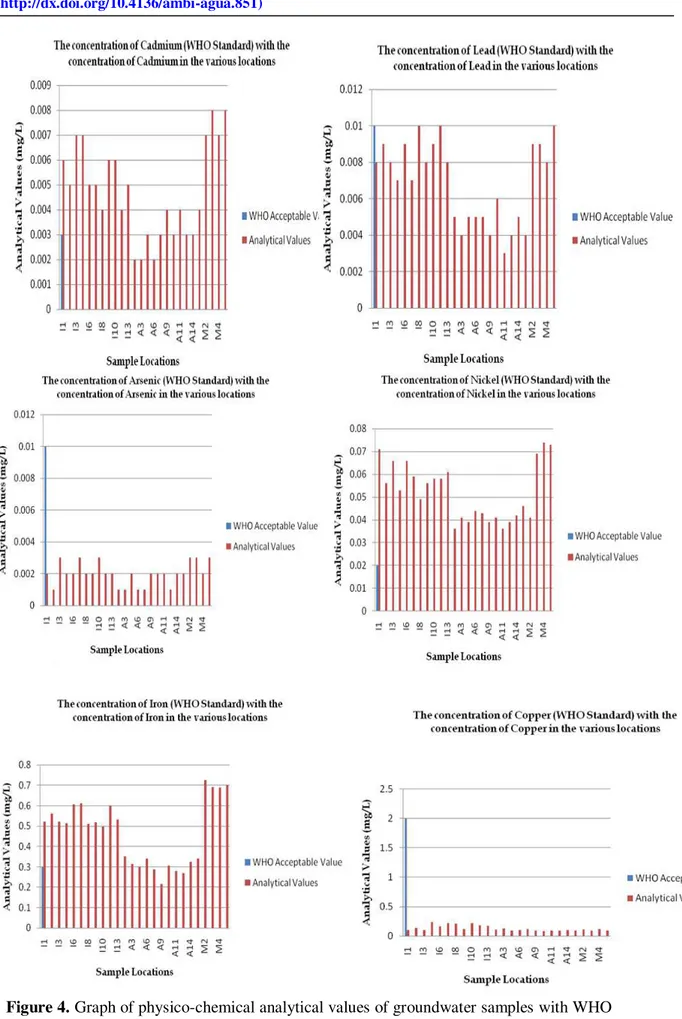
Figure 6. Graph of physico-chemical analytical values of groundwater samples with WHO Acceptable Value (i) Bicarbonate (ii) pH (iii) Electrical Conductivity (EC) and (iv) Total Dissolved Solids.
4. DISCUSSION
The characteristics of each element varies from one sample point to the other and this indicates the difference in the quality of the water sample collected from that particular point. The WHO acceptable values are then compared with the various values to determine and compare the suitability and effect of continual consumption of such water.
The Figures 4, 5 and 6 above indicate the comparison of the analysed values for the groundwater parameters in Akoko North West Local Government of Ondo State with the WHO established standard. For cadmium concentrations, the analyzed values of the samples taken at Arigidi-Akoko are the only ones within the WHO permissible range (0.003 mgL-1) Figure 4(i), in other areas, the difference are less than the acceptable WHO standard concentration (0.003 mgL-1), and are still assumed to be okay for domestic use except for two peaks at locations 9 and 11 in Arigidi. On the other hand, the analyzed values of the samples taken at Ikare and the Ministry area are far above the permissible concentration. It can therefore be concluded that the concentration of cadmium in these areas are anomalous and as such geological.
same lead concentration as the WHO standard overtime so that it does not exceed the acceptable values.
The WHO guideline value for arsenic in drinking water is currently 0.01 mgL-1 although the Nigerian National Standard is 0.05 mgL-1. Few data are so far available for arsenic in groundwater from Nigeria (Smedley and Kinniburgh, 2002). However, from the Figure 4(iii), the analyzed values for the samples fall within the permissible range (0.001 mgL-1, Table 2) for arsenic concentration but it is far less than the acceptable WHO standard concentration (0.01 mgL-1). However, it should be noted the overall concentration which is lesser than the permissible value for arsenic is acceptable because too much arsenic intake is hazardous to human’s health.
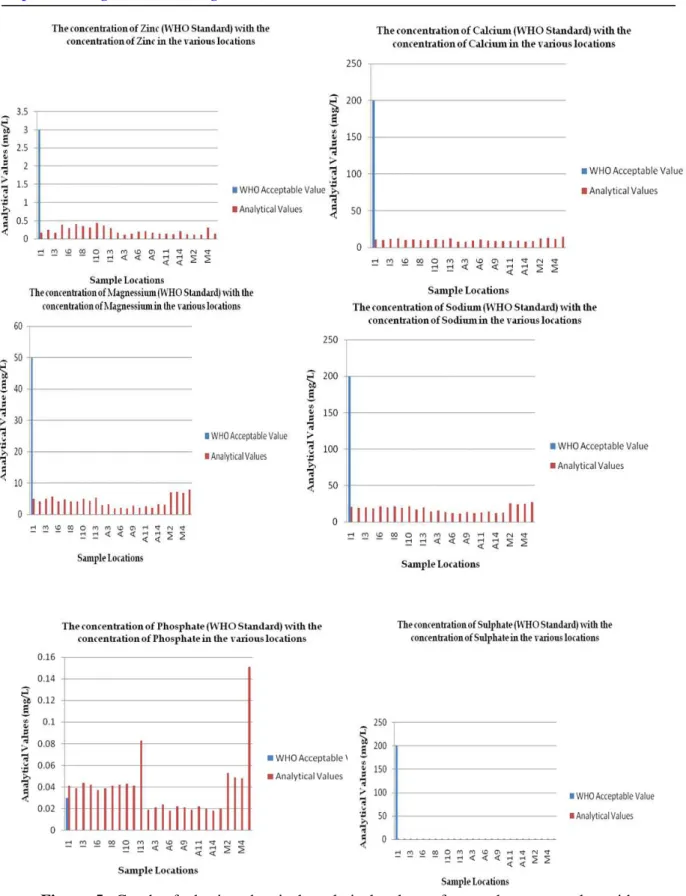
The overall analysis of the values for the groundwater sampled (See Tables 3 and 4, as well as Figures 4, 5 and 6) in comparison with the WHO acceptable standard (See Table 2) indicates that Copper (Figure 4(vi)), Zinc (Figure 5(i)), Calcium (Figure 5(ii)), Magnesium (Figure 5(iii)), Sodium (Figure 5(iv)), Sulphate (Figure 5(v)), Bicarbonate (Figure 6(i)), Electrical Conductivity – EC (Figure 6(iii)) and Total Dissolved Solids (Figure 6(iv)) are far lesser than the WHO acceptable standard(quality) for drinking water. The magnitude of the values for Nickel (Figure 4(iv)), Iron (Figure 4(v)) and Phosphate (Figure 5(v)) are, however, higher than the WHO established standard. The only groundwater quality parameter from the samples analysed for the study which is generally of WHO standard is the pH value (Figure 6(iv)).
Clear differences are observable in all the sampled groundwater from the Hand Held Boreholes, Solar-Powered Boreholes and Hand-Dug wells in the local government area. The summary of the effects of these variations to the human health is presented in Table 5 below. The major threats to the groundwater quality in the study area are from agricultural effluents seepage, septic tank and soak-away pits leakages, water table’s interception with latrines and other various other impacts of human encroachment which do affect the physical and chemistry of the groundwater component in the area. Major anomalies are seen in the concentrations of some of the heavy metals in the area.
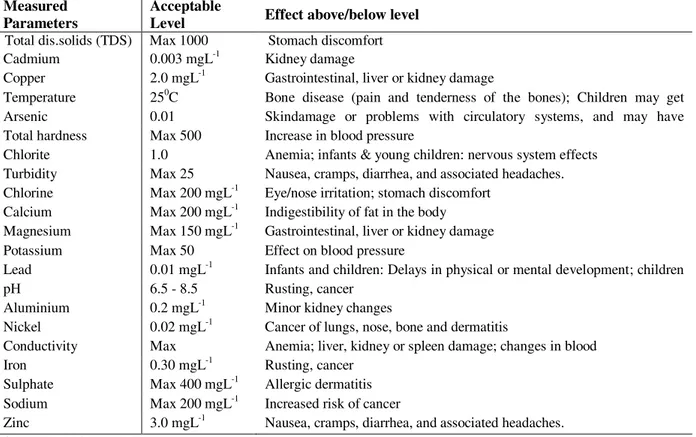
Table 5. The likely effect of metal ingestion above/below acceptable level.
Measured Parameters
Acceptable
Level Effect above/below level Total dis.solids (TDS) Max 1000 Stomach discomfort Cadmium 0.003 mgL-1 Kidney damage
Copper 2.0 mgL-1 Gastrointestinal, liver or kidney damage
Temperature 250C Bone disease (pain and tenderness of the bones); Children may get mottled teeth
Arsenic 0.01 Skindamage or problems with circulatory systems, and may have increased risk of getting cancer
Total hardness Max 500 Increase in blood pressure
Chlorite 1.0 Anemia; infants & young children: nervous system effects Turbidity Max 25 Nausea, cramps, diarrhea, and associated headaches. Chlorine Max 200 mgL-1 Eye/nose irritation; stomach discomfort
Calcium Max 200 mgL-1 Indigestibility of fat in the body Magnesium Max 150 mgL-1 Gastrointestinal, liver or kidney damage Potassium Max 50 Effect on blood pressure
Lead 0.01 mgL-1 Infants and children: Delays in physical or mental development; children could show slight deficits in attention span and learning abilities
pH 6.5 - 8.5 Rusting, cancer
Aluminium 0.2 mgL-1 Minor kidney changes
Nickel 0.02 mgL-1 Cancer of lungs, nose, bone and dermatitis Conductivity Max
500(ohm/cm),
Anemia; liver, kidney or spleen damage; changes in blood Iron 0.30 mgL-1 Rusting, cancer
Sulphate Max 400 mgL-1 Allergic dermatitis Sodium Max 200 mgL-1 Increased risk of cancer
5. CONCLUSION
It can be concluded that the sampled groundwater are in most cases not suitable for human consumption judging by the various concentrations of the physicochemical parameters analyzed from the samples. Because of the total reliance of the entire population in the study area on groundwater for their various uses, there is the need to carry out a research on the link between quality of water intake and the health conditions of the populace in the study area. It was also observed that some of the heavy metals, anions and cations, with the physical parameters are much higher than the WHO acceptable standard for drinking water. Although there were also cases where in some of the analyzed samples, the range and the concentration were within the WHO acceptable standard for drinking water. Most of the high concentrations in the analyzed groundwater are generally from anthropogenic sources and not natural or geological.
The following are hereby recommended as possible solutions to the groundwater quality problems in the study area:
i. that waters in such areas where the physic-chemical constituents are lower than the acceptable standards of the WHO are unsafe for human consumption and domestic use, and therefore should be treated to reduce or ameliorate the problems;
ii. that further work should be carried out to ascertain the specific anthropogenic contaminants in the analyzed waters so as to determine the level of contamination and be able to proffer appropriate remediation;
iii. that in areas where the cationic and anionic concentrations are far below the WHO acceptable levels, supplements should be advised to the residents of such areas or such be distributed so as to make up for the minimal intake recommended for domestic use by the World Health Organization;
iv. that further investigation of the entire area is necessary to determine the specific causes for the chemistry observed and to establish hypotheses on reasons for some of the abnormalities;
v. for the research approach, a larger number of samples should be taken to allow the optimization of a more routine study in the area; and,
vi. the startling statistics from this research work should, therefore, serve as a wake-up call for urgent remedial action from both the Local and State Governments, if the residents in these areas are to continually live healthily. They should be properly orientated on the need not to dump untreated/raw sewage into flowing surface waters and the environments so as to reduce the increasing rate of fecal contamination of both the surface and groundwater bodies from where majority of domestic water supply come from.
6. ACKNOWLEDGEMENT
The authors would like to appreciate and acknowledge the supervisory assistance and guidance of Prof Ogunbajo, M. I. and Prof. Oyinloye, A. O. in this research work.
7. REFERENCES
BOYLE, D. R. Application of groundwater geochemistry in mineral exploration. In: BERRY, M. J. (Ed.). Current activities forum 1988, program with abstracts. Dartmouth: Geological Survey of Canada, 1988.
DUZE, M.; OJO, A. Senior school atlas. Lagos: Macmillan Educational,1982. 113p.
EDET, A. E.; OKEREKE, C. S.; TEME, S. C.; ESU, E. O. Application of remote sensing data to groundwater exploration: a case study of the Cross River State, South-eastern Nigeria. Hydrogeology Journal, v. 6, n. 3, p. 394–404, 1998. DOI: 10.1007/s100400050162 http://dx.doi.org/10.1007/s100400050162
HANIDU, J. A. National growth, water demand and supply strategies in Nigeria in the 1990s. Water Resource Journal of Nigerian Association of Hydrogeologists, v. 2, n. 1, p. 1– 6, 1990.
NATIONAL POPULATION COMMISSION - NPC. National population and housing census. [S.l.], 2006.
OBATOYINBO, O.; OYEDOTUN, T. D. T. Microbial/bacteriological analysis of water resources in Ikare and Arigidi Akoko of Ondo State, Nigeria. In: EIT International Conference on Water Resources Engineering, 1., 18 -19 August 2011, Cha-Am.
Proceedings… p. 279–84. Available in: <http://eitwre2011.fiet.kmutt.ac.th
/theme_en/8WQ_E.pdf>. Accessed 23 Apr. 2012.
OKAGBUE, C. O. Hydrology and chemical characteristics of surface and groundwater resources of the Okigwi area and environs, Imo State, Nigeria. In: OFOEGBU, C.O. (Ed.). Groundwater and mineral resources of Nigeria. Braunschweig: Vieweg and Sohn, 1988. p. 3–16.
OMOTOYINBO, O. S.; OKAFOR, F. C. Influence of rock mineralogy on subsurface water in Ado-Ekiti, Nigeria. AfricanResearchReview, v. 2, n. 2, p. 175–86, 2008.
http://dx.doi.org/10.4314/afrrev.v2i2.41049
RAMANATHAN, A. L. Water quality: guidelines and assessment of risk. New Delhi: School of Environmental Sciences, 2004. p. 110-67.
RIJSWIJK, K. Small community water supplies. The Hague: IRC, 1981. (Technical Paper, n. 18).
SMEDLEY, P. L.; KINNIBURGH, D. G. A review of the source, behaviour and distribution of arsenic in natural waters. Applied Geochemistry, v. 17, p. 517–68, 2002.
http://dx.doi.org/10.1016/S0883-2927(02)00018-5
TIJANI, M. N. Hydrogeochemical assessment of groundwater in Moro area, Kwara state, Nigeria. Environmental Geology, v. 24, n. 3, p. 194–202, 1994. DOI: 10.1007/BF00766889 http://dx.doi.org/10.1007/BF00766889
WORLD HEALTH ORGANIZATION - WHO. Guidelines for drinking-water quality. Vol. 1: recommendations. Geneva, 1984.