ISSN 1549-3652
© 2008 Science Publications
The Determinants of Agricultural Production and Profitability in
Akoko Land, Ondo-State, Nigeria
Fasoranti Olayiwola Olujenyo
Department of Sociology,
Adekunle Ajasin University, Akungba Akoko, Ondo State, Nigeria
Abstract: The study considered the determinants of agricultural production and profitability with special reference to maize production in Akoko North East and South West Local Government Areas of Ondo-State. Data collection was through well structured questionnaire administered on 100 respondents selected through random sampling technique. The methods of analysis used were descriptive statistics, gross margin analysis and production function analysis using the Ordinary Least Square (OLS) criterion to estimate the parameters of the production function. Results showed that majority of the farmers were ageing and quite experienced in maize farming. Also there was high level of illiteracy as about 65% of total respondents had no formal education while 25, 6 and 4% had primary, secondary and technical education respectively. Farming was majorly on subsistence level as the mean farm size was 0.39 hectares. Maize farming was profitable in the study area with gross margin and net returns of N2,637.80 and N2,141.00 respectively. Results showed that farm operation was in stage II of the production function with RTS estimated as 0.62 and factors of production were efficiently allocated with elasticities that were positive but less than one. Results further showed that age, education, labour and cost of non-labour inputs were positively related to output while farm size and years of experience carried negative signs. However, only labour input has significant influence on output.
Key words: Ordinary Least Square, Maize farming, agriculture, Profitability, Agricultural Productivity
INTRODUCTION
In Nigeria, agriculture is made up of forestry, livestock, fishing, food and cash crops such as yams, cassava, maize, cocoa, groundnut and oil palm. The country is largely endowed with natural resources that are necessary for the development of agriculture-such resources include abundant land supply, human and forestry resources. The country has a total land area of about 98.3 million hectares out of which 71.2 million hectares (72.4%) are cultivable but only 34.2 million hectares (34.8%) are under use[1].
Agricultural production is still highly dominated by the small holder farming system. The farms are dominated by small scale farmers who are responsible for about 95% of total production[2]. This is not unconnected with the unattractiveness of agriculture which is a result of lack of necessary infrastructures in the rural areas which forms the bulk of agricultural zones in the country. In addition, small scale agriculture has in the time past suffered from limited access to credit facilities, modern technology farm inputs and inefficient use of resources. Nevertheless, it is on record that 50% of world’s population is dependent on subsistence agriculture[3].
Maize is of great importance to the people of Ondo State. The consumption of maize in western states of Nigeria varies between 2.6-2.8kg per person per week while it was estimated as 0.5 kg per person per week in Eastern States[7]. Given this prime position of maize in the Nigerian economy and given the fact that domestic supply has not been able to meet up with domestic supply, there is therefore the need to examine those factors that affect the profitability and efficiency of maize production. This study examines the determinants of production and efficiency of maize production in Akoko North East and South West Local Government areas of Ondo-State.
Theoretical frame work: The basic thrust of economics of agricultural productions at the micro level is to assist farmers to attain their objectives through efficient farm allocation of resources over a given period of time. Profit maximization could be achieved by maximizing output from a given resource or minimizing the resources required for a given output. Agricultural productivity is synonymous with resource ¨C productivity which is the ratio of total output to the resource/inputs being considered[8]. The basic concepts in productivity measurement are Average Product (AP), Marginal Product (MP), Marginal Rate of Substitution (MRS), Elasticity of Production (EP) and Returns to Scale (RTS). The knowledge of these concepts can be used to study the three stages of the production surface.
The production function could be expressed in different functional forms such as Cobb Douglas, linear, quadratic, polynomials and square root polynomials, semilog and exponential functions. However, the Cobb Douglas functional form is commonly used for its simplicity and flexibility coupled with the empirical support it has received from data for various industries and countries[9]. When time perspective is introduced into the production function, we have the short-run and long-run production function. Many scholars have attempted to give an insight into resource productivity in Nigeria. Using the Ordinary Least Square (OLS) criterion, Abang et al.[10] reported that small-scale cassava farms were more technically efficient than large farms. The study also revealed that education was positively related to the value of marginal product for capital though not statistically important. Others such as Alimi and Akinyemiju[11], Aderinola[12], Aderinola and Abdulkadri[13], Eremie and Akinwumi[14], Ojo[15], investigated the productivity of cassava processing, sugar cane production, mechanized food crop farming, rice production and maize farming respectively. Farmers¡¯ socio-economic variables were found to be
significant determinants of agricultural production and profitability.
Imoudu[16] showed that farm size and labour were the significant determinants of maize output and profitability in Ondo-State. Ojo[17] confirmed this result also.
MATERIALS AND METHODS
The study area: The study area covers Akungba, Supare, Oka, Iwaro, Oba and Etioro in Akoko South West and Ikare, Ugbe, Ikaram, Ibaram and Akunnu in Akoko North East Local Government areas of Ondo State. The area has tropical wet and dry climate. The mean annual rainfall varies from between 1000mm and 1500mm. The vegetation of the area is mainly savannah and decidous forests. The major occupation of the people is farming. The vegetation in the area favours the growth of trees and cash crops such as cocoa, coffee, kolanut, rubber and subsistence crops like yam, cassava, maize and guinea corn. The people of the area are mostly Yoruba and they share similar customs and beliefs. Other economic activities in the area include trading and handicraft such as weaving, carpentry, dyeing and pottery.
Nature, sources of data and sampling technique: Data were collected from primary and secondary sources. Secondary data were collected from relevant texts, journals, CBN Bullions and Statistical bulletin. Well structured questionnaires were used to obtain relevant information from 100 respondents. Respondents were selected through multistage sampling techniques. Five villages were randomly selected from each local government area while ten farmers were selected randomly from each village. Data were collected on the following variables viz:
• Age measured in years
• Farm size in hectares
• Educational status measured by the number years spent in school
• Years of experience
• Sex, labour in man days, output of maize in kg, input costs in Naira and season dummied as dry = 1 and wet = 2
socio-economic variables in the production of agricultural product. Net returns analysis was used to determine the level of profitability. The t-test was used to test for the statistical significance of the variables,
Model specification:
LogY = β0 + β1Logx1 + β2Logx2 + β3Logx3 +
β4Logx4 + β5Logx5 + β6Logx6 + β7Logx7 +
β8Logx8 + ………. (1)
Where:
Y = Output
x1 = Age
x2 = Farm size x3 = Education
x4 = Sex
x5 = Labour Man day x6 = Cost of input
x7 = Season (dry = 1, wet = 2) β1, …. β8 = Parameters to be estimated
u = Random error
Profitability analysis: Gross margin
GM = TR ¨C TVC
………
(2)Net returns
NR = TR ¨C TC
………
(3)Where:
TR = Total Revenue TVC = Total Variable Cost TC = Total Cost
Data analysis
Socio-economic characteristics: Table 1 shows the age distribution of respondents in the study area. Results showed that the age of respondents ranges between 31 and 70 years. The mean age was 57 years while the modal age group was 51-60 years age bracket. By implication therefore, one could infer from this result that maize farmers in the study area are ageing.
Result also show that majority of farmers in the study area are without formal education. Table 2 shows that 65% had no formal education, while 25, 6 and 4% had primary, secondary and technical education respectively. This could have negative impact on the adoption of new techniques of production.
Table 3 shows the years of experience of respondents. Results indicate that 52% of the respondents took on farming as major occupation for
between 21 and 50 years. This is supposed to have positive impact on output, all things being equal.
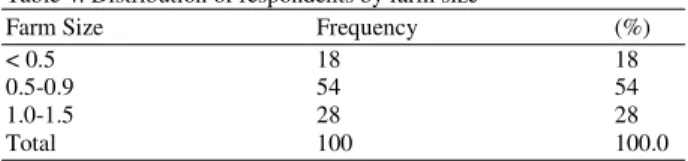
Most farmers in the study area are small scale farmers as 72% reported farm size of less than an hectare while only 28% had between 1.0 and 1.5 hectares of land. (Table 4) Table 5 shows that 93 and 7% of respondents were male and female respectively.
Profitability analysis: The profitability analysis is presented in Table 6. The per hectare gross margin was estimated as N2, 637.80, while the Net Return per hectare was N2, 141.00. This shows that maize farming was generally profitable in the study area. The table shows that total revenue was more than double the total cost incurred by the respondents. All things being equal, greater effort in maize production will enhance the income of the respondents.
Table 1: Age distribution of respondents
Frequency (%) 31-40 20 20 41-50 22 22 51-60 40 40 61-70 18 18 Total 100 100.0
Table 2: Educational status of respondents
Educational Status Frequency (%) No formal education 65 65 Primary 25 25 Secondary 6 6 Technical 4 4 University - - Total 100 100.0
Table 3: Years of experience of respondents
Years of experience Frequency (%) 1-10 13 13 11-20 35 35 21-30 40 40 31-40 10 10 41-50 2 2 Total 100 100.0
Table 4: Distribution of respondents by farm size
Farm Size Frequency (%) < 0.5 18 18 0.5-0.9 54 54 1.0-1.5 28 28 Total 100 100.0
Table 5: Sex distribution of respondents
Table 6: Profitability analysis
Variables (N) Mean Minimum Maximum SD Total revenue 4,15.20 1,680.00 11,000.0 1,84.98 Total cost 2,015.20 800.0 5,760.00 835.33 Total variable cost 1,498.80 300.00 5,500.00 869.98 Total fixed cost 517.60 210.00 950.00 218.10 Gross margin/ha 2,637.80 650.00 6,750.00 1,446.25 Net return/ha 2,141.00 270.00 5,800.00 1,394.65 Farm size 0.39 0.1 1.5 0.25
Table 7: Estimates of the Production Function Analysis Variable Parameters Coefficients Std t-statistic
Constant β0 1.178 0.889 1.321 Age β1 0.364 0.300 1.211 Farm size β2 -0.0094 0.120 -0.082 Education β3 0.094 0.172 0.546 Years of experience β4 -0.135 0.190 -0.711 Sex β5 -0.039 0.242 -0.165 Labour β6 0.474 0.151 3.143 Costs of other inputs β7 0.155 0.157 0.986 Season β8 0.150 0.234 0.639 F ¨C Statistics = 2.633; R2 = 0.429; DW = 1.577
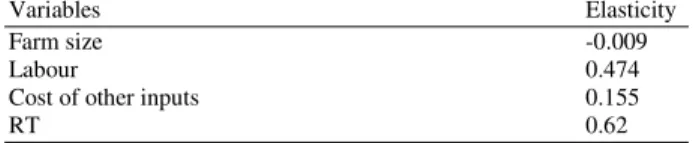
Table 8: Elasticity of production and return to scale (RTS)
Variables Elasticity Farm size -0.009 Labour 0.474 Cost of other inputs 0.155
RT 0.62
Results of the production function analysis: The production function analysis is presented in Table 7. The Table shows that positive relationship exist between total output and age, education, labour, non-labour input cost and type of season. This implies that as more of these variable are employed, there will be an increase in total output of maize. This confirmed with Ojo (2000). On the other hand, results showed inverse relationship between output and farm size, years of experience and sex of respondents. The inverse relationship between output and farm size is unexpected. This could be due to poor farm management and poor soil fertility resulting from lack of land improvement. Also the negative relationship between output and education is unexpected but could be due to the generally small number of years of formal education observed throughout the sample. This has probably hindered the adoption of new techniques of production. Moreover, the negative sign of years of experience is contrary to a prior expectation. This is probably due to the fact that farmers with long years of experience are used to obsolete methods of farming, traditional tools and species which do not encourage high output.
However, the test of significance shows that only labour was statistically significant. The R2 estimated as
0.43 shows that only 43% of variations in output were explained by the explanatory variables included in the model.
Productivity analysis: The input elasticities are presented in Table 8. Results showed that farm size, labour, cost of other inputs have positive but less than unity elasticities indicating a decreasing positive returns to each of the factors. They are therefore efficiently utilized and hence their use is in stage II (i.e., the rational zone) of the production function.
The return to scale (RTS) estimated as 0.62 shows that production is in stage II which is the rational stage of production. Hence, production is efficient
CONCLUSION
The study examined the determinants of agricultural production and profitability with special reference to maize production in Akoko North East and South West Local Government areas of Ondo-State. Data were collected with the aid of structured questionnaires from 100 respondents selected through random sampling technique. The parameters of the production function were estimated using the Ordinary Least Square (OLS) analysis. The value of the parameters were thereafter used to estimate the productivity and efficiency parameters of the factors of production. Moreover, the gross margin and Net returns analyses were used to estimate the profitability of maize of production in the study area.
The analysis of the socio-economic characteristics of the respondents showed that majority of the farmers were ageing and quite experienced in maize production. Also, the level of illiteracy was very high among the respondents as about 65% of total respondents had no formal education while 25, 6 and 4% had primary, secondary and technical education respectively. Respondents are majorly small-scale farmers with a mean farm size of 0.39 hectares.
Farmers therefore should be encouraged to improve their land through the use of fertilizers so as to increase productivity. Among other things, farmers should have more access to extension services in order to improve their knowledge of farm management. Also, the government should introduce the farmers to formal education through adult literacy education, evening classes and establishment of demonstration farms.
REFERENCES
1. Daramola, A.G., 2004. “Competitiveness of Nigeria Agriculture in a Global Economy: Any Dividends of Democracy?”, Inaugural Lecture Series 36 delivered at the Federal University of Technology, Akure, 2nd March, 2004, pp: 1. 2. Awoyemi, C., 1981. “Character of Nigerian
Agriculture” in News from the Central Bank of Nigeria. Central Bank Bullion, 3 (4): 2.
3. Dillon, J.L. and J.B. Hardaker, 1986. Farm Management Research for Small Farmer Development, FAO, Rome.
4. Guy, R., 2001. The Tropical Agriculturist Maize Technical Centre for Agriculture and Rural Cooperation (CTA), Macmillan Publishers. 5. Akande, S.O., 1994. “Comparative Cost and
Return in Maize Production in Nigeria”. NISER Individual Research Project Report, NISER, Ibadan, pp: 1-35.
6. Ojo, S.O., 2000. “Factor Productivity in Maize Production in Ondo-State, Nigeria”. Applied Tropical Agriculture. School of Agriculture and Agricultural Technology, FUTA, Akure, Ondo State, Nigeria, 5 (1): 57-63.
7. Food and Agricultural Organization, 2003. FAO. Food and Agricultural Monthly Bulletin of Statistics, 5 (12): 23.
8. Olayide, S.O. and E.O. Heady, 1982. “Introduction to Agricultural Economics”, University of Ibadan Press, Ibadan, Nigeria, pp: 92.
9. Desai, M., 1976. Applied Econometrics, Philip Allan Publishers Ltd, Deggington, Oxford, pp: 52-60.
10. Abang, S.O., E. Ekpeni and W.W. Usani, 2001. “Technical and Allocative Efficiencies of Small Scale Growers in five selected Local Government Areas of Cross River State”, Global J. Applied Sci., 7 (1): 102-106.
11. Alimi, J.T. and O.A. Akinyemiju, 1987. “Economics of Cassava Production and Processing”. Ife J. Agric., 19: 1-2.
12. Aderinola, E.A. (1988): “Returns and Productivity Coefficients for selected Resources at Bacuta Sugar Estate, Nigeria”, Ahmadu Bello University Press Ltd, Zaria. Savana J. Environ. Social Sci., 9 (1).
13. Aderinola, E.A. and J.O. Kolawole, 1996. “Profitability and Capacity Utilization of Rice Milling Enterprises in Ondo State, Nigeria”. Agro Search, 102: 15-28.
14. Eremie, S.W. and J.A. Akinwumi, 1986. “Profitability of Irrigated Rice Production in Nigeria”, Rural Development in Nigeria, Federal Department of Agriculture, Lagos, Nigeria, 2 (2): 95-104.
15. Ojo, S.O., 2000. “Factor Productivity in Maize Production in Ondo-State, Nigeria”. school of Agriculture and Agricultural Technology, FUTA, Akure, Ondo State, Nigeria. Applied Trop. Agric., 5 (1): 57-63.
16. Imoudu, P.B., 1992. “Economics of Maize Production and Marketing in Ondo State of Nigeria”, Unpublished Ph.D Thesis, Development of Agricultural Economics and Extension, FUTA, Akure, Ondo-State, Nigeria.