Spatial RelationShipS Between Soil attRiButeS
and CoRn Yield in no-tillage SYStem
(1)marcos Sales Rodrigues(2), José eduardo Corá(3) & Carolina Fernandes(4)
SummaRY
Soil properties play an important role in spatial variability of crop yield. however, a low spatial correlation has generally been observed between maps of crop yield and of soil properties. the objectives of the present investigation were to assess the spatial pattern variability of soil properties and of corn yield at the same sampling intensity, and evaluate its cause-and-effect relationships. the experimental site was structured in a grid of 100 referenced points, spaced at 10 m intervals along four parallel 250 m long rows spaced 4.5 m apart. thus, points formed a rectangle containing four columns and 25 rows. therefore, each sampling cell encompassed an area of 45 m2 and consisted of five 10 m long crop
rows, in which the referenced points represented the center. Samples were taken from the layers 0–0.1 m and 0.1–0.2 m. Soil physical and chemical properties were evaluated. Statistical analyses consisted of data description and geostatistics. the spatial dependence of corn yield and soil properties was confirmed. the hypothesis of this study was confirmed, i.e., when sampling the soil to determine the values of soil characteristics at similar to sampling intensity as for crop yield assessments, correlations between the spatial distribution of soil characteristics and crop yield were observed. the spatial distribution pattern of soil properties explained 65 % of the spatial distribution pattern of corn yield. the spatial distribution pattern of clay content and percentage of soil base saturation explained most of the spatial distribution pattern of corn yield.
index terms: geostatistics, precision agriculture, soil sampling intensity, spatial correlation, Zea mays.
(1) part of the thesis of first author, São paulo State university - uneSp, Jaboticabal, São paulo, Brazil. Received for publication in
July 11, 2011 and approved in February 9, 2012.
(2) graduate student, São paulo State university – uneSp. Via de acesso prof. paulo donato Castellane s/n, Cep 14884-900.
Jabo-ticabal (Sp), Brazil. FapeSp Scholar (grant 2008/52559-3). e-mail: [email protected]
ReSumo: RELAÇÃO ESPACIAL ENTRE ATRIBUTOS DO SOLO E PRODU-TIVIDADE DE MILHO EM SISTEMA DE SEMEADURA DIRETA
Atributos do solo desempenham papel importante na variabilidade espacial da produtividade da cultura. Entretanto, o que se observa, geralmente, é uma baixa correlação espacial entre mapas de produtividade e mapas de atributos do solo. O objetivo deste trabalho foi estudar o padrão de distribuição espacial dos atributos do solo e da produtividade de milho e sua relação de causa e efeito, quando avaliados em semelhante intensidade amostral. Foi utilizada uma malha amostral de 100 pontos referenciados na área experimental. Os pontos foram espaçados em intervalos regulares de 10 m ao longo de quatro transeções de 250 m, espaçadas em 4,5 m. Os pontos formaram um retângulo com quatro colunas e 25 linhas. Portanto, cada célula amostral foi composta de cinco linhas da cultura com 10 m, totalizando uma área de 45 m2 cada, onde o ponto referenciado foi considerado o centro da
célula. As amostras foram coletadas nas profundidades de 0-0,1 e 0,1-0,2 m. Foram avaliados atributos físicos e químicos do solo. Realizou-se a análise estatística descritiva dos dados e geoestatística. A produtividade de milho e os atributos do solo apresentaram dependência espacial. A hipótese deste estudo foi confirmada: quando a intensidade amostral dos atributos do solo é semelhante àquela da produtividade da cultura, é observada correlação entre os padrões de distribuição espacial de atributos do solo e produtividade da cultura. Os padrões de distribuição espacial dos atributos do solo explicaram 65 % do padrão de distribuição espacial da produtividade do milho. Os padrões de distribuição espacial dos teores de argila e da porcentagem de saturação por bases foram os que melhor explicaram o padrão de distribuição espacial da produtividade do milho.
Termos de indexação: geoestatística, agricultura de precisão, intensidade de amostragem do solo, correlação espacial, Zea mays.
intRoduCtion
precision agriculture (pa) is based on the understanding that crop yield is affected by the spatial and temporal variability of yield-related factors of soil management. thus, knowledge of the spatial variability of soil properties is fundamental for the implementation of precision agriculture. Soil properties vary across the landscape due to differences in soil formation and related processes, as well as in land management and agricultural practices. however, variations in soil properties are spatially dependent.
Crop yield also shows spatial variability, and several factors can affect this variability, including soil properties. For instance, soil properties influence crop management efficiency and development. the spatial definition of soil and plant properties contributes to the planning of commercial crops and the location of scientific experiments (Reichert et al., 2008).
in practice, though, it has been observed that the spatial distribution pattern of crop yield is usually not well correlated with the spatial distribution pattern of soil property variability, in other words, the correlation between maps of soil properties based on pa techniques and maps of crop yield is low.
Rosa Filho et al. (2009) observed that only soil bulk density and penetration resistance in
the 0–0.1 m layer was significantly correlated with soybean yield in a Rhodic hapludox under no-tillage. Kitamura et al. (2007) reported low correlation coefficients between the texture of a Rhodic hapludox under no-tillage and bean yield, where 7.3 % of bean yield was explained by the clay content in the surface soil layer.
in a study of Silva & alexandre (2005), a positive correlation was observed between corn yield and cation exchange capacity (CeC), and Ca2+ and K+
contents in soils developed from calcareous deposits. in addition, Montezano et al. (2006) observed positive linear correlation between corn yield and clay, organic matter and boron content, while corn yield was negatively correlated with sand, copper, manganese and zinc content in a Rhodic hapludox under no-tillage. in these two studies, all pearson correlation coefficients (r) were below 0.39.
Bourennane et al. (2004) observed low spatial correlation between wheat yield and soil properties in a Xerifluventic haplocambids and udorthent. Similarly, Mallarino et al. (1999) observed low correlation between soil chemical properties and corn yield in five corn fields in the uSa.
Monitoring devices of crop yield allow data acquisition over short intervals (1–3 sec), by which 500–1300 data points can be collected per hectare, depending on the equipment. in these cases, each point represents the crop yield of an area of 8–25 m2.
thus, it is possible to develop highly accurate maps showing spatial variability patterns of crop yield. however, to develop maps showing spatial variability patterns of soil properties, soil sampling is often much less intense, due to the high cost of data acquisition and analysis.
agricultural consultants in Brazil usually develop maps showing spatial variability patterns of soil properties based on soil sampling intensities from one sample per 20 to 25 ha up to one sample per 1 ha. in these cases, the accuracy of the spatial variability patterns in soil property maps is much lower than in crop yield maps, which may be the reason for the low correlation between crop yield and soil property maps reported in the literature. this disparity in sampling intensities can lead to misinterpretations of cause-and-effect relationships between the spatial variability patterns of crop yield and soil properties.
the hypothesis of this study is that when the sampling intensity for soil property assessment is similar to that for crop yield evaluation, it is possible to observe strong correlations between the spatial distribution of crop yield and soil properties, which will enhance the understanding of cause-effect relationships of crop yield and soil properties. therefore, the objectives of this study were to assess the spatial pattern variability of soil properties and of corn yield at a similar sampling intensity, and evaluate their cause-effect relationships.
mateRial and methodS
the experiment was conducted in Jaboticabal, São paulo State, Brazil (21º 14’ 05’’ S, 48º 17’ 09’’ w, 613 m asl). Climatologically, the area belongs to the tropical/megathermal zone or Köppen aw (a tropical climate with dry winter and temperature average of the coldest month above 18 ºC). the mean annual rainfall (1971–2006) is 1417 mm, peaking in the period of october–March and a relatively dry season in the period of april–September. the soil of the experimental area is a clayey Rhodic hapludox.
the experimental area has been managed in a corn-fallow rotation under no-tillage for 10 years. Before corn seeding, weeds were eliminated with non-selective herbicides.
in the 2007/2008 growing season, corn (triple-hybrid Syngenta Master) was planted at 65,000 plants ha-1 on 12/5/2007. Starter fertilizer
consisted of 30 kg n, 70 kg p2o5 and 50 kg ha-1 K 2o
when the plants had 4–6 pairs of totally developed leaves, 100 kg ha-1 n fertilizer was applied.
the experimental site was structured in a grid of 100 referenced points, spaced at 10 m intervals along four parallel 250 m long rows spaced 4.5 m apart. thus, the points formed a rectangle with four columns and 25 rows. each sampling cell encompassed an area of 45 m2 and consisted of five
10 m long crop rows, in which the geo-referenced points were the center.
Corn was harvested 151 days after seeding with a mechanical plot harvester, which harvested corn from one row at a time. thus, corn yield was obtained per sampling cell (for the length of the five 10 m-long corn rows). the corn grain weight of each sampling cell was calculated for a standard 13 % moisture content, and corn yield was expressed in Mg ha-1.
after harvest, soil samples of each cell were taken from the layers 0–0.1 m and 0.1–0.2 m using a dutch auger. Five soil sub-samples were collected per cell to obtain one representative composite sample per cell, where one sub-sample was obtained from the center (geo-referenced point) and the others 2 m away from the central point in the four cardinal directions. For each composite sample, particle size was determined by the standard pipette method (gee & dani, 2002), ph, organic matter (oM), p, K+,
Ca2+, Mg2+, and h + al content (page et al., 1982)
were determined. afterwards, the sum of basis (SB), cation exchange capacity (CeC), and percentage of soil base saturation (V) were calculated.
undisturbed soil cores (0.05 x 0.05 m) were taken from the 0–0.1 m and 0.1–0.2 m layers in each cell (central point) using a double-cylinder, hammer-driven core sampler (grossman & Reinsch, 2002). Soil total porosity (tp), soil macroporosity (Ma), soil microporosity (Mi), soil bulk density (Bd), gravimetric soil water (gSw), and soil water storage (SwS) were determined from these samples (0–0.2 m layer) using the methods proposed by Flint & Flint (2002).
descriptive statistical analyses (mean, median, maximum, minimum, coefficient of variation (CV), coefficient of skewness, coefficient of kurtosis, and frequency distribution of data) were calculated. to test the hypothesis of normality, the Shapiro & wilk (1965) test was conducted.
according to the method of pimentel-gomez & garcia (2002), the variability of soil properties was classified according to the CV, where a CV value below 10 % was considered low, a value between 10 and 20 % was medium, a CV between 20 and 30 % was considered high and a value above 30 % very high.
soil properties. Stepwise regression analysis was used to model the effects of soil properties in both layers (0–0.1 and 0.1–0.2 m) and corn yield, at a significance degree for the F test of 10 %.
to estimate the spatial dependence of samples and to identify systematic and random variations, estimated semivariogram models were produced. Models were selected based on the smallest residual sums of squares (RSS) and the highest coefficient of determination (R2). the semivariograms were
validated via cross-validation, and isotropy in all adjusted models was observed, which indicated that the spatial variability was the same in all directions.
For analysis of the degree of spatial dependence, the classification of Cambardella et al. (1994) was used, which considers strong spatial dependence to be present when semivariograms have a nugget effect equal to 25 %, moderate spatial dependence when the nugget effect is between 25 and 75 %, and weak spatial dependence when the nugget effect is greater than 75 %. after the estimation of experimental semivariograms and adjustment of theoretical models, the data were interpolated using block kriging, generating soft maps (Burrough & Mcdonnel, 1998).
to spatially correlate corn yield and soil properties, cross-semivariograms were estimated. the corn yield was used as the main variable and soil properties as co-variables. Soil variables were used to estimate cross-semivariograms when spatial dependence was observed (Vieira, 2000). Cross-semivariograms with a series of points distributed in one square were selected because they represented a reliable relationship between corn yield and soil properties (Megda et al., 2008). however, the spatial correlation of cross semivariograms with a series of points in more than one square was considered indefinite (Camargo et al., 2008).
ReSultS and diSCuSSion
By comparing average values of soil properties (table 1) to the established limits of tropical soil fertility for corn in the state of São paulo (Raij et al., 1997), low percentages of soil base saturation (V) were observed in the layers 0–0.1 and 0.1–0.2 m . the levels of soil K+ were low in the 0.1–0.2 m and
medium in 0–0.1 m layer. in both, the soil p levels were intermediate, while soil Ca2+ and Mg2+ were
high. low values of ph and medium soil organic matter content (oM) were observed.
Based on the classification of coefficient of variation (CV) proposed by (pimentel-gomez & garcia, 2002), the variability of clay and sand content was low in both layers, while the variability
in silt content was considered medium (table 1). Similar results were obtained by Kitamura et al. (2007), who observed a low variability in clay and medium variability in silt and sand content in a Rhodic hapludox under no-tillage.
in this study, the variability in soil bulk density (Bd) was low (table 1). Similar results were observed by Rosa Filho et al. (2009) for a Rhodic hapludox under no-tillage and by Kiliç et al. (2004) in a typic ustifluvent under conventional tillage. a low variability for soil total porosity (tp) and soil microporosity (Mi) (table 1) was also observed, in agreement with the results of Megda et al. (2008) in a Rhodic hapludox under no-tillage. in this study, the variability of soil macroporosity (Ma) was very high (table 1). these results disagree with observations of Megda et al. (2008), who reported medium variability for Ma and Siqueira et al. (2010), who stated high variability for Ma. the variability of gravimetric soil water (gSw) was medium and low for soil water storage (SwS) (table 1).
the CV of the ph value was the lowest of all soil chemical properties and the variability classified as medium. however, the CV of ph in both layers was 11 %, which is near the lower limit of medium variability (table 1). Similalry, Vitharana et al. (2008) observed a CV of 12 % for ph in a hapludalfs under winter wheat, barley and sugar beet. a lower CV was expected for ph because values typically vary over a narrow interval. Moreover, the CV of ph cannot be compared to other properties because it is measured on a logarithmic scale.
the CV values of the soil organic matter content (oM) were 13 % in the 0–0.1 m and 15 % in the 0.1– 0.2 m layer. thus, variability of oM was classified as medium (table 1). Similar results were obtained by Corá et al. (2004) in a Rhodic eutrudox under sugarcane in conventional tillage and by panosso et al. (2011) in a eutrustox under sugarcane in conventional tillage.
the variability in K+ content was only high in
the 0.1–0.2 m layer, while that of h + al was high in both layers (table 1). Similar results for h + al content were obtained by Corá et al. (2004) in a Rhodic eutrudox under conventional tillage and also by Machado et al. (2007) in a Rhodic eutrudox under conventional tillage. the variability found for the K+
content was similar to the value reported by Corwin et al. (2006) in a natrargid under a forage crop. the variability in p, Ca2+ and Mg2+ contents, and the sum
of bases (SB), cation exchange capacity (CeC), and percentage of soil base saturation (V) values at all depths was very high, as well as of the K+ content
in the 0–0.1 m layer, which agreed with results of Corá et al. (2004) and Machado et al. (2007). the highest CV values were found for SB and the Mg2+
Based on the minimum and maximum values of soil properties and CV values, in general, the variability in soil chemical properties was high, likely due to the residual effects of fertilization. Fertilization is typically applied at planting/seeding, and despite the application by broadcasting of soil ph amendments (lime), the acidity in the area is not homogenously neutralized. Continuous fertilizer applications can change the spatial continuity of soil chemical properties (Cambardella et al., 1994).
according to the coefficients of skewness and kurtosis and normality tests, the distribution of most
properties is non-normal (table 1). For data that did not have a normal distribution, semivariograms were modeled with original and transformed data. however, the result of the fitting of transformed data was not superior to the initial results. therefore, original data were used to model the semivariogram because geostatistical analysis does not require normal data distribution (Cressie, 1991). Corn yield ranged from 4.45 to 9.12 Mg ha-1, with a CV value
of 14 %, with medium variability (table 1).
positive linear correlations were observed between corn yield and clay, oM, Ca2+, Mg2+ soil table 1. descriptive statistics for soil properties of the 0–0.1 and 0.1–0.2 m layers and for corn yield
propertie mean median min. max. CV (%) Coefficients Freq.
distri.
Skewness Kurtosis
layer 0–0.1 m
Clay (g kg-1) 333 335 288 373 6 -0.17 -0.53 n
Sand (g kg-1) 620 620 569 660 3 -0.27 -0.28 n
Silt (g kg-1) 44 44 32 60 14 0.42 -0.40 n
Bd (g cm3) 1.54 1.56 1.37 1.68 6 -0.48 -0.90 n-n
tp (%) 41 40 34 49 8 0.37 -0.49 n
Mi (%) 30 30 27 34 5 0.54 0.41 n
Ma (%) 10 10 3 20 38 0.46 -0.48 n
gSw (cm-3 cm-3) 0.27 0.26 0.20 0.35 14 0.51 -0.65 n-n
p (mg dm-3) 33 31 8 67 48 0.46 -0.78 n-n
oM (g dm-3) 17 17 11 22 13 0.10 0.28 n
ph (CaCl2) 4.8 4.7 3.9 6.4 11 1.01 1.20 n-n
K+ (mmol
c dm-3) 1.9 1.9 0.9 3.6 30 0.81 0.79 n-n
Ca2+ (mmol
c dm-3) 22 15 3 152 125 3.17 10.35 n-n
Mg2+ (mmol
c dm-3) 11 7 2 69 126 2.78 7.07 n-n
h + al (mmolc dm-3) 33 34 9 58 29 -0.07 0.17 n
SB (mmolc dm-3) 36 25 6 223 117 2.94 8.46 n-n
CeC (mmolc dm-3) 69 59 28 232 56 2.74 7.39 n-n
V (%) 44 41 16 96 44 1.02 0.59 n-n
layer 0.1–0.2 m
Clay (g kg-1) 355 356 314 391 6 -0.12 -0.87 n
Sand (g kg-1) 608 608 567 653 3 0.00 -0.83 n
Silt (g kg-1) 37 38 21 53 19 -0.13 -0.30 n
Bd (g cm3) 1.59 1.60 1.37 1.73 5 -0.80 0.28 n-n
tp (%) 37 37 33 45 8 0.95 0.45 n-n
Mi (%) 29 29 25 31 5 -1.20 1.27 n-n
Ma (%) 8 7 3 19 45 1.20 0.66 n-n
gSw (cm-3 cm-3) 0.24 0.23 0.16 0.35 15 1.14 1.25 n-n
p (mg dm-3) 21 20 7 46 45 0.73 -0.04 n-n
oM (g dm-3) 14 14 8 18 15 -0.32 0.11 n
ph (CaCl2) 4.8 4.6 4.0 6.3 11 1.13 1.02 n-n
K+ (mmol
c dm-3) 1.39 1.30 0.80 2.40 26 0.41 -0.39 n-n
Ca2+ (mmol
c dm-3) 20 12 3 150 126 3.17 11.08 n-n
Mg2+ (mmol
c dm-3) 10 5 1 68 146 2.82 7.25 n-n
h + al (mmolc dm-3) 32 34 10 47 26 -0.63 0.30 n-n
SB (mmolc dm-3) 31 19 5 217 127 3.00 9.25 n-n
CeC (mmolc dm-3) 63 54 40 232 52 3.31 11.56 n-n
V (%) 40 34 11 94 55 1.02 0.32 n-n
SwS 0 to 0.2 (mm) 78 77 67 90 7 0.40 -0.75 n-n
Corn yield (Mg ha-1) 7.36 7.56 4.45 9.12 14 -0.52 0.04 n
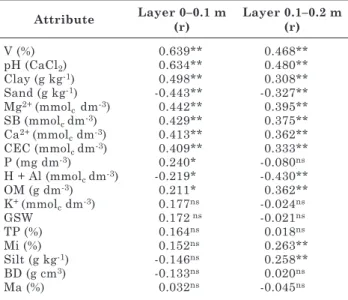
contents, and SB, ph, CeC, and V values in both layers, and between corn yield and p content in the 0–0.1 m layer and for microporosity and silt content in the 0.1–0.2 m layer (table 2). negative correlations between corn yield and sand and h + al content were observed, as expected.
Similar results were observed by Reichert et al. (2008) in an albaqualf under conventional tillage, who observed positive correlations between soybean yield and ph, SB and CeC, as well as the Ca2+
and Mg2+ content. however, the authors observed
negative correlations between soybean yield and clay content. Montezano et al. (2006) observed a positive correlation between corn yield and clay, oM and boron content, and a negative correlation for the sand, copper, manganese and zinc content in a Rhodic hapludox under no-tillage. Silva & alexandre (2005) found a positive correlation between corn yield and the CeC, Ca2+ and K+
contents in soils arising from calcareous deposits. the h + al content showed a negative correlation with corn yield, which was expected because higher concentrations of h + al content increase soil acidity.
the highest correlation coefficients (r-values) were observed for V (0.639), ph (0.634) and clay content (0.498), indicating that these properties were strongly correlated with corn yield. Silva & alexandre (2005) and Montezano et al. (2006) found that the highest r-values did not exceed 0.39.
the stepwise multiple regression analysis revealed that approximately 65 % of variation in corn yield can be explained by soil properties, where V accounted for the greatest part, which explained 44 % of the variation in corn yield (table 3). these results revealed that more than half of the variation in crop yield can be explained by soil properties, which is a valid result because crop yield depends on several factors such as germination rates, weeds, insects, diseases and climate.
a similar result was observed by Reichert et al. (2008), who used a stepwise multiple regression technique to find that approximately 65 % of the variation in soybean yield was explained by the soil properties of an albaqualf under conventional tillage. however, the greatest contribution to the model was made by ph (h2o) and aluminum
saturation in the 0–0.15 m layer.
the estimate of the parameter of soil Ca2+ content
in the stepwise multiple regression has a negative value (table 3). theoretically, this indicates that high Ca2+ concentrations reduced the corn yield.
however, a positive correlation between corn yield and Ca2+ content was observed (table 2).
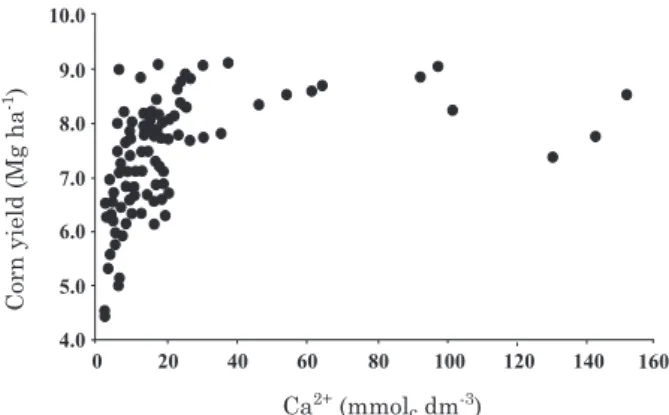
the difference between the minimum and maximum soil Ca2+ content was 149 mmol
c dm-3 and
a CV of 126 % was observed, indicating that the soil Ca2+ content was highly variable (table 1). these
results were confirmed by the dispersion plot of corn yield and Ca2+ content (Figure 1).
the results indicated that corn yield increases as the soil Ca2+ content increases. however, once
a certain soil Ca2+ content is reached, corn yield
stabilizes and a further increase in soil Ca2+
content does not enhance corn yield. Corn yields of 9.0 Mg ha-1 were observed with soil Ca2+ content
between 7 and 98 mmolc dm-3 (Figure 1). it is notable
that multiple stepwise regression analysis considers not only the independent variable, but also the set
table 2. Correlation coefficients (r) between corn grain yield and soil properties in the 0–0.1 and 0.1–0.2 m layers
attribute layer 0–0.1 m
(r)
layer 0.1–0.2 m (r)
V (%) 0.639** 0.468**
ph (CaCl2) 0.634** 0.480**
Clay (g kg-1) 0.498** 0.308**
Sand (g kg-1) -0.443** -0.327**
Mg2+ (mmol
c dm-3) 0.442** 0.395**
SB (mmolc dm-3) 0.429** 0.375**
Ca2+ (mmol
c dm-3) 0.413** 0.362**
CeC (mmolc dm-3) 0.409** 0.333**
p (mg dm-3) 0.240* -0.080ns
h + al (mmolc dm-3) -0.219* -0.430**
oM (g dm-3) 0.211* 0.362**
K+ (mmol
c dm-3) 0.177ns -0.024ns
gSw 0.172 ns -0.021ns
tp (%) 0.164ns 0.018ns
Mi (%) 0.152ns 0.263**
Silt (g kg-1) -0.146ns 0.258**
Bd (g cm3) -0.133ns 0.020ns
Ma (%) 0.032ns -0.045ns
Bd: Soil bulk density; CeC: Cation exchange capacity; gSw: gravimetric soil water; Ma: Soil macroporosity; Mi: Soil microporosity; oM: organic matter content; SB: sum of basis; tp: Soil total porosity; V: percentage of soil base saturation; ns: not
significant; *: Significant at 5 %; **: Significant at 1 %.
table 3. Results of stepwise regression of corn grain yield and soil properties in the 0–0.1 and 0.1–0.2 m layers
Variable Coefficient p-value R2
Constant -2.8240
V (0-0.1 m) 0.0480 0.000 0.4400
Clay (0-0.1 m) 0.0075 0.073 0.0597
Ca2+(0-0.1 m) -0.0209 0.000 0.0441
h +al (0-0.1 m) 0.0356 0.000 0.0505
Silt (0.1-0.2 m) 0.0258 0.009 0.0292
oM (0.1-0.2 m) 0.0650 0.057 0.0121
ph (0-0.10 m) 0.6300 0.082 0.0119
of variables that constitute the model. these factors explain the negative value of Ca2+ content in the
corn yield model.
according to the value of the pearson coefficient, the estimated value of soil h + al content in the corn yield model should be negative. thus, a similar hypothesis to the one involving the Ca2+ content may
be applied. For instance, as the soil concentration of h + al content increases, corn yield decreases until a specific h + al content is attained. additionally,
the inverse correlation that occurs between soil Ca2+
and h + al content is well-known in tropical soils. of the soil properties determined in undisturbed samples, spatial dependence was only observed for microporosity (Mi), and was adjusted to an exponential model in both layers (table 4). this result was similar to findings of Megda et al. (2008) for a Rhodic hapludox under no-tillage and Siqueira et al. (2010) for a Rhodic hapludox under an orange orchard. the absence of spatial dependence for soil bulk density (Bd), soil total porosity (tp) and macroporosity (Ma) is likely due to the cumulative effect of compression from agricultural machines and tools over the previous 10 years under no-tillage. thus, the spatial dependence of Bd, tp, and Ma decreased, and random variability became dominant. this effect was not observed for Mi because, according to hillel (1982), significant reductions in the macropore volume are caused by compaction, while the volume of micropores remains unaltered.
Spatial dependence was observed in granulometric properties in both layers. For the clay content, the gaussian model was adjusted for the 0–0.1 m layer and the spherical model for the 0.1–0.2 m layer. For sand content, the gaussian model was adjusted for
Figure 1. Scatter plot between corn yield and soil Ca2+ content.
table 4. Variogram model parameters of soil properties in the 0–0.1 and 0.1–0.2 m layers and for corn yield
propertie model C0 Sill Range (m) dSd R2 RSS
layer 0–0.1 m
Clay (g kg-1) gau 159.000 356.000 49 M 0.908 6462
Sand (g kg-1) gau 154.100 316.500 33 M 0.848 5707
Silt (g kg-1) exp 22.228 41.150 21 M 0.241 196
Mi (%) exp 0.991 1.9830 29 M 0.741 0.0929
p (mg dm-3) exp 117.702 255.300 20 M 0.579 2006
ph (CaCl2) (1) gau 0.039 0.120 12 M 0.445 2.354e-03
Ca2+ (mmol
c dm-3) (1) gau 77.205 413.100 12 S 0.495 41606
Mg2+ (mmol
c dm-3) (1) gau 21.231 113.033 12 S 0.490 3267
SB (mmolc dm-3) (1) gau 157.737 951.000 14 S 0.510 225413
CeC (mmolc dm-3) (1) gau 142.570 845.189 12 S 0.552 139026
V (%)(1) gau 31.363 138.600 12 S 0.675 1971
layer 0.1–0.2 m
Clay (g kg-1) Sph 229.600 459.300 121 M 0.824 18292
Sand (g kg-1) exp 261.600 523.300 124 M 0.511 56879
Silt (g kg-1) exp 27.910 51.281 47 M 0.215 1852
Mi (%) exp 0.068 1.355 38 S 0.504 0.124
p (mg dm-3) exp 60.502 92.123 36 M 0.503 358
ph (CaCl2) (1) gau 0.025 0.144 13 S 0.683 2.314e-03
K+ (mmol
c dm-3) exp 0.051 0.118 18 M 0.478 6.755e-04
Ca2+ (mmol
c dm-3) (1) gau 2.790 322.400 14 S 0.736 25234
Mg2+ (mmol
c dm-3) (1) gau 1.500 114.200 14 S 0.692 3979
h + al (mmolc dm-3) (1) Sph 18.346 46.859 8 M 0.389 79.9
SB (mmolc dm-3) (1) gau 15.000 807.600 14 S 0.720 174784.0
CeC (mmolc dm-3) (1) gau 10.000 602.100 14 S 0.721 88777
V (%)(1) gau 40.197 228.080 12 S 0.769 4180
Corn yield (Mg ha-1)(1) Sph 0.139 0.445 22 M 0.672 0.0186
(1) the semivariograms were estimated with the residues. Bd: Soil bulk density; tp: Soil total porosity; Mi: Soil microporosity;
Ma: Soil macroporosity; oM: organic matter content; SB: sum of basis; CeC: Cation exchange capacity; V: percentage of soil base saturation; Sph: Spherical; exp: exponential; gau: gaussian; C0: nugget effect; dSd: degree of spatial dependence; M: Moderate;
the surface and the exponential model for the layer beneath. a spherical model was used to adjust the silt content in both layers (table 4). in a Rhodic hapludox under no-tillage, Kitamura et al. (2007) adjusted a spherical model for clay content in the 0–0.1 m layer and for sand content in the 0.1–0.2 layer. For silt content, the authors adjusted an exponential model for both layers.
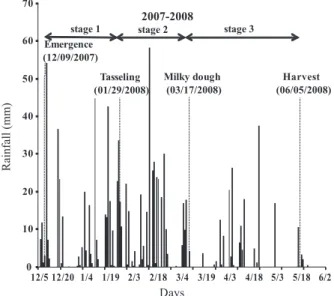
gravimetric soil water (gSw) and soil water storage (SwS) showed no spatial dependence. therefore, the study area could be considered as more homogeneous for gSw and SwS and the soil water was not a determinant factor for the corn yield variability. despite the existence of spatial dependence for soil texture, the variation in soil texture was small and did not affect the variability of soil water.
in addition, the distribution of rainfall was regular during the growing season (Figure 2). therefore, there was no water stress, neither in the crop development nor in the reproductive crop stages. the total rainfall during the growing season was 1009 mm, which is according to the recommendation for corn in the geographic condition of the experiment (21º 14’ 05’’ S, 48º 17’ 09’’ w; 613 m asl). these results confirmed that rainfall distribution was not a limiting factor for corn yield and corn yield spatial variability.
Spatial dependence was observed for soil chemical properties, with the exception of K+ and
h + al content in the 0–0.1 m layer, and of oM in both layers (table 4).
a trend was observed in the data of the Ca2+
and Mg2+ contents, as well as SB, CeC, ph and V
properties in both layers, and h + al content in the 0.1–0.2 m layer, because the semivariograms of these properties, when estimated with the original data, increased without limits for all h values (distance of the samples), indicating that the size of the sampled field was not sufficient to detect all variances (Vieira, 2000). these trends were removed, using the surface analysis method proposed by davis (1973).
the linear trend surface in Y was adjusted for the ph in both layers and for the h + al content and V in 0.1–0.2 m, while the linear and square trend surface in Y was adjusted for the Ca2+ and Mg2+ content, as
well as for SB and CeC in both layers. lastly, the linear trend surface in X and Y was adjusted for corn yield and V in the 0–0.1 m layer. after fitting the trend surface, semivariograms were estimated with the corresponding error.
after removing the trends, the gaussian model was fitted for Ca+2, Mg+2 content, as well as for ph,
SB, CeC and V in both layers (table 4). Reichert et al. (2008) obtained similar results adjusting a gaussian model for Ca+2, Mg+2, and CeC and V
values in an albaqualf under conventional tillage. Similarity of semivariograms of soil Ca+2,
Mg+2 content and ph, SB, CeC and V values was
observed, considering their parameters. the range of these soil properties, which is the parameter that indicates the distance at which the samples are spatially dependent in the semivariograms was similar in both layers, and varied from 11 to 15 m. this similarity indicates analogous spatial distribution patterns. the spatial dependence degree of the above soil properties was strong, with the exception of ph in the 0–0.1 m layer, which was moderate (table 4). thus, the semivariograms explained most of the variation in experimental data. the spherical model was fitted for corn yield, which agreed with the result obtained by Silva & alexandre (2005). a strong spatial dependence was observed for corn yield (table 4).
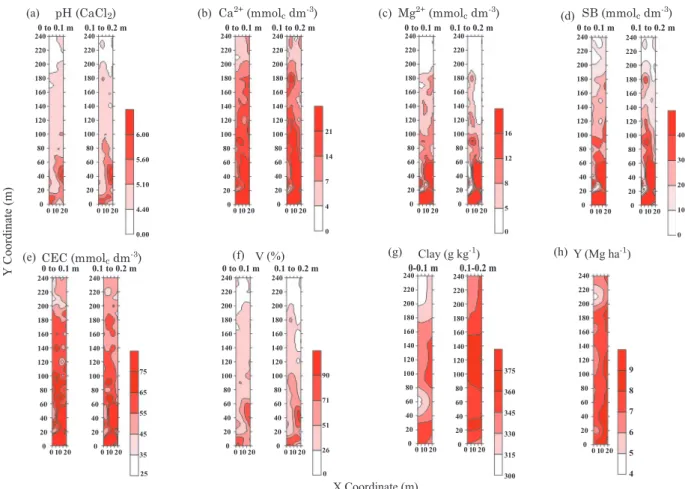
as shown in the contour map, areas of low corn yield were located in the upper region of the study area, between 190 and 240 m, whereas yields were highest (8.0 and 9.0 Mg ha-1) in the lower right corner
(Figure 3h). a similar spatial distribution pattern was observed in the maps of ph (Figure 3a), Ca+2
content(Figure 3b) and Mg+2 content (Figure 3c),
indicating a region of low values in the upper corner of the map and a region of high values in the lower corner.
the spatial distribution pattern was similar in the maps of SB (Figure 3d), CeC (Figure 3e) and V (Figure 3f) because these values were based on the Ca2+ and Mg2+ content. the corn yield and clay
content map (Figure 3g) were similar, with areas of low corn yield and clay content in the upper region of the map.
Cross-semivariograms between corn yield and clay content (Figure 4a) and corn yield and V (Figure 4b) in the 0–0.1 m layer were estimated. the gaussian model was adjusted for these cross-semivariograms. a range of 60 m for clay content to 16 m for V was observed. unlike simple semivariograms, the range of cross-semivariograms indicates the distance of spatial correlation (Vieira, 2000). these results corroborated the visual analysis of contour maps, confirming the spatial dependence of corn yield on clay content and V.
the results of simple linear correlation analysis, stepwise multiple regression analysis, contour maps and cross-semivariograms indicated that soil properties such as the clay content and V were linearly and spatially correlated to corn yield. these results disagree with those obtained by Bourennane et al. (2004) and Montezano et al. (2006), who observed a low correlation between soil chemical properties and crop yield. in the respective studies, the authors obtained yield data from harvesters equipped with yield monitors, enabling the collection of a large amount of data per ha. however, sampling to determine soil properties was performed at a much lower intensity than that for crop yield assessments.
Figure 4. Cross semivariogram between corn yield and clay content (a) and V (b). V: percentage of soil base saturation; gau: gaussian; C0: nugget
effect; C0+C: sill; a: range; RSS: residual sums
of squares.
Figure 3. maps of ph (a), Ca2+ content (b), mg2+ content (c), SB (d), CeC (e), V (f), clay content (g) and Y (h).
For instance, Bourennane et al. (2004) used a regular sampling grid for soil properties at 40 m intervals. Montezano et al. (2006) divided the study area into 80 sampling cells containing four ha apiece, where one soil property was determined in each of the 80 cells.
the corn yield was not estimated in this study. Rather, corn yield was determined for each 45 m2
cell. in several studies relating crop yield and soil properties, crop yield was estimated for each point of the experimental sampling grid by obtaining a sample of the surrounding area. in general, low correlations between soil properties and crop yield were reported in studies involving the estimation of crop yields.
Rosa Filho et al. (2009) used a sampling grid composed of 6 rows and 12 columns, which contained a total of 72 sampling points at 8 m intervals. at each sampling point, the soil physical properties and soybean yield were assessed. For crop yield, points were located within four rows, encompassing a width of 1.80 m in a 3.24 m2 area. Kitamura et al.
(2007) sampled an 8000 m2 area (160 x 50 m) with 75
points at 10 m intervals. to evaluate common bean yield, a 4 m2 area (2 x 2 m) was harvested, and the
corresponding soil sample was obtained from the center of the area. these studies revealed no or low correlation between soil properties and crop yield.
when compared to the size of commercial fields, the area in the present study may be considered small. however, it would not be feasible to sample soil at a similar rate to crop yield in a larger area.
it worth mentioning that the topographic properties were not considered in this study, because the study field was small and plain. therefore, these properties did probably not affect the crop yield.
the results of this study confirm the hypothesis that when soil properties are sampled at a similar rate to crop yield, it is possible to understand the cause and effect relationships related to the spatial distribution of crop yield and soil properties. high correlations between soil properties and crop yield can be observed when variables are sampled at a similar intensity.
however, sampling soil at a similar intensity to crop yield is not economically feasible on a larger scale. thus, solutions that provide similar sampling intensity are necessary for the evaluation of soil properties and crop yield. one possibility is the development of sensors that evaluate soil properties at a similar intensity to crop yield. Sensors that monitor soil properties at a high intensity - electrical conductivity sensors, for instance (Moral et al., 2010), or measurements of soil properties using on-the-go near infrared reflectance spectroscopy or real-time niRS (Christy, 2008) are possible.
ConCluSionS
the hypothesis of this study was confirmed that, when soil is sampled at a similar intensity to crop yield, correlations between the spatial distribution of soil properties and crop yield were observed. the spatial dependence of corn yield and soil properties was confirmed. the spatial distribution pattern of soil properties explained 65 % of the spatial distribution pattern of corn yield. the spatial distribution pattern of clay content and percentage of soil base saturation explained most of the spatial distribution pattern of corn yield.
aCKnowledgementS
we would like to thank the Fundação de amparo à pesquisa do estado de São paulo (FapeSp) for a scholarship to the first author (grant 2008/52559-3).
liteRatuRe Cited
BouRennane, h.; niCoullaud, B.; CoutuRieR, a. & King, d. exploring the spatial relationships between some soil properties and wheat yields in two soil types. precision agric., 5:521-536, 2004.
BuRRough, p.a. & Mcdonnel, R.a. principles of geographic information systems. new York, oxford university press, 1998. 333p.
CaMaRgo, l.a.; MaRQueS JÚnioR, J.; peReiRa, g.t. & hoRVat, R.a. Variabilidade espacial de atributos mineralógicos de um latossolo sob diferentes formas do relevo: ii - correlação espacial entre mineralogia e agregados. R. Bras. Ci. Solo, 32:2279-2288, 2008.
CaMBaRdella, C.a.; MooRMan, t.B.; noVaK, J.M.; paRKin, t.B.; KaRlen, d.l.; tuRCo, R.F. & KonopKa, a.e. Field-scale variability of soil properties in central iowa soils. Soil Sci. Soc. am. J., 58:1501-1511, 1994.
ChRiStY, C.d. Real-time measurement of soil attributes using on-the-go near infrared reflectance spectroscopy. Comput. electron. agric., 61:10-19, 2008.
CoRÁ, J.e.; aRauJo, a.V.; peReiRa, g.t. & BeRaldo, J.M.g. Variabilidade espacial de atributos do solo para adoção do sistema de agricultura de precisão na cultura de cana-de-açúcar. R. Bras. Ci. Solo, 28:1013-1021, 2004. CoRwin, d.l.; leSCh, S.M.; oSteR, J.d. & KaFFKa, S.R.
Monitoring management-induced spatio-temporal changes in soil quality through soil sampling directed by apparent electrical conductivity. geoderma, 131:369-387, 2006. CReSSie, n. Statistics for spatial data. new York, Jonh wiley,
daViS, J.C. Statistics and data analysis in geology. new York, Jonh wiley, 1973. 550p.
Flint, a.l. & Flint, l.e. porosity. in: dane, J.h. & topp, g.C., eds. Methods of soil analysis. physical methods. Madison, Soil Science Society of america, 2002. part 4. p.241-253.
gee, g.w. & dani, o. particle-size analysis. in: dane, J.h. & topp, g.C., eds. Methods of soil analysis. physical methods. Madison, Soil Science Society of america, 2002. part 4. p.255-289.
gRoSSMan, R.B. & ReinSCh, t.g. Bulk density and linear extensibility. in: dane, J.h. & topp, g.C., eds. Methods of soil analysis. physical methods. Madison, Soil Science Society of america, 2002. part 4. p.201-255.
hillel, d. introduction to soil physics. new York, academic press, 1982. 364p.
KiliÇ, K.; ÖZgÖZ, e. & aKBaS, F. assessment of spatial variability in penetration resistance as related to some soil physical properties of two fluvents in turkey. Soil till. Res., 76:1-11, 2004.
KitaMuRa, a.e.; CaRValho, M.d.p.e. & liMa, C.g.d.R. Relação entre a variabilidade espacial das frações granulométricas do solo e a produtividade do feijoeiro sob plantio direto. R. Bras. Ci. Solo, 31:361-369, 2007. MaChado, l.d.o.; lana, Â.M.Q.; lana, R.M.Q.; guiMaRÃeS,
e.C. & FeRReiRa, C.V. Variabilidade espacial de atributos químicos do solo em áreas sob sistema plantio convencional. R. Bras. Ci. Solo, 31:591-599, 2007.
MallaRino, a.p.; oYaRZaBal, e.S. & hinZ, p.n. interpreting within-field relationships between crop yields and soil and plant variables using factor analysis. precision agric., 1:15-25, 1999.
Megda, M.M.; CaRValho, M.d.p.e.; VieiRa, M.X.; andReotti, M. & peReiRa, e.C. Correlação linear e espsacial entre a produtividade de feijão e a porosidade de um latossolo Vermelho de Selvíria (MS). R. Bras. Ci. Solo, 32:781-788, 2008.
MonteZano, Z.F.; CoRaZZa, e.J. & MuRaoKa, t. Variabilidade espacial da fertilidade do solo em área cultivada e manejada homogeneamente. R. Bras. Ci. Solo, 30:839-847, 2006.
MoRal, F.J.; teRRÓn, J.M. & SilVa, J.R.M.d. delineation of management zones using mobile measurements of soil apparent electrical conductivity and multivariate geostatistical techniques. Soil till. Res., 106:335-343, 2010.
page, a.l.; MilleR, R.h. & KeeneY, d.R. Methods of soil analysis: Chemical and microbiological properties. Madison, american Society of agronomy, Crop Science Society of america/Soil Science Society of america, 1982. part 2. 1159p.
panoSSo, a.R.; MaRQueS JR, J.; MiloRi, d.M.B.p.; FeRRaudo, a.S.; BaRBieRi, d.M.; peReiRa, g.t. & la SCala JR, n. Soil Co2 emission and its relation to soil
properties in sugarcane areas under Slash-and-burn and green harvest. Soil till. Res., 111:190-196, 2011.
piMentel-goMeZ, F. & gaRCia, C.h. estatística aplicada a experimentos agronômicos e florestais: exposição com exemplos e orientações para uso de aplicativos. piracicaba, FealQ, 2002. 309p.
RaiJ, B.van; CantaRella, h.; Quaggio, J.a. & FuRlani, a.M.C. Recomendações de adubação e calagem para o estado de São paulo. Campinas, instituto agronômico de Campinas, 1997. 285p.
ReiCheRt, J.M.; daRiVa, t.a.; ReineRt, d.J. & SilVa, V.R.d. Variabilidade espacial de planossolo e produtividade de soja em várzea sistematizada: análise geoestatística e análise de regressão. Ci. Rural, 38:981-988, 2008.
RoSa Filho, g.; CaRValho, M.d.p.e.; andReotti, M.; MontanaRi, R.; Binotti, F.F.d.S. & gioia, M.t. Variabilidade da produtividade da soja em função de atributos físicos de um latossolo vermelho distroférrico sob plantio direto. R. Bras. Ci. Solo, 33:283-293, 2009. ShapiRo, S.S. & wilK, M.B. an analysis of variance test for
normality (complete samples). Biometrika, 52:591-611, 1965.
SilVa, J. & aleXandRe, C. Spatial variability of irrigated corn yield in relation to field topography and soil chemical characteristics. precision agric., 6:453-466, 2005.
SiQueiRa, d.S.; MaRQueS, J. & peReiRa, g.t. the use of landforms to predict the variability of soil and orange attributes. geoderma, 156:410-410, 2010.
VieiRa, S.R. geoestatística em estudos de variabilidade espacial do solo. in: noVaiS, R.F.; alVaReZ V., V.h. & SChaeFeR, C.e.g.R., eds. tópicos em ciência do solo. Viçosa, Mg, Sociedade Brasileira de Ciência do Solo, 2000. p.1-54.