Embedded System for Detection, Recognition and Classification Of
Traffic Signs
Diogo Veríssimo Correia
1, aand Pedro Dinis Gaspar
1, b1, 2
University of Beira Interior, Electromechanical Engineering Department, Rua Fonte do Lameiro – Edifício 1 das Engenharias, 6201-001 Covilhã, Portugal
a
[email protected], [email protected] Keywords: Detection, Recognition, Classification, traffic signs.
Abstract. This study concerns the development of an embedded system with low computational
resources and low power consumption. It uses the NXP LPC2106 with ARM7 processor architecture, for acquiring, processing and classifying images. This embedded system is design to detect and recognize traffic signs. Taking into account the processor capabilities and the desired features for the embedded system, a set of algorithms was developed that require low computational resources and memory. These features were accomplished using a modified Freeman Method in conjunction with a new algorithm "ear pull" proposed in this work. Each of these algorithms was tested with static images, using code developed for MATLAB and for the CMUcam3. The road environment was simulated and experimental tests were performed to measure traffic signs recognition rate on real environment. The technical limitations imposed by the embedded system led to an increased complexity of the project, however the final results provide a recognition rate of 77% on road tests. Thus, the embedded system features overcome the initial expectations and highlight the potentialities of both algorithms that were developed.
Introduction
Signs recognition has a key role in the orientation of humans or machines. There are a large number of visual signs with different applicability used by mankind, such as bar codes, signals with electromagnetic characteristics, traffic signs, among many others. However, there are many signals that cannot be interpreted by each other, i.e. by humans and machines. A human cannot read a barcode and a machine usually has no abilities to decipher traffic signs. The visibility of traffic signs is essential for the safety of drivers and pedestrians, and to make roads safer, besides the awareness of safe driving provided by the police authority, more paths must be followed [1]. One of these paths concerns the development of recognition systems for traffic signs that can aid and alert the driver for the infraction that will commit, as well as risks to their health and that might incur to others. There is a wide range of studies on recognition systems, such as systems based on retro-reflectivity [2], use of color histograms [3], more complex calculations using Fast Fourier Transform (FFT) [4] or complex logarithmic edge detection [5], while [6-7] have used observation of waveforms. Other solutions consist in normalizing images of 16x16 pixels [8] up to 31x31 pixels [9] in order to balance between storage capacity/processing capability and quality of the sampled image. The images are sampled merging various algorithms such as Neural Networks (NN) [5], [10-11], Kohonen networks [12], adaptive resonance theory (ART) [13] and networks with radial basis functions (RBF) [8]. Alternative classifiers have been proposed as the basis for mail sorter [4], nonlinear correlator [14] or a combination of standards-based normalized correlation in a database using traffic signs [13, 15]. According to [9], good results have been achieved when the classification method is based on Support Vector Machines (SVM) with Gaussian filter [8, 16-17]. Characteristics that influence the detection, recognition and classification of signs such as variations in light, color, shape, sign and also pictograms rotation, are almost instinctively addressed and overcome by the human brain, whereas for a machine is highly complex and will require a variety of algorithms and processing forms. A standard used by Traffic Sign Detection, Recognition and Classification Systems (TSDRS) comprises the following tasks: (1) Color segmentation; (2) Corners detection; (3) Form recognition;
All rights reserved. No part of contents of this paper may be reproduced or transmitted in any form or by any means without the written permission of TTP, www.ttp.net. (ID: 193.137.97.99, University of Beira Interior, Covilhã, Portugal-23/04/13,15:43:33)
and (5) Sign classification. This work procedure was followed by [18] using the method implemented by [19]. This approach allowed the recognition of traffic signs in a real setting, because the signs can be fully or partially visible or hidden by natural factors such as trees, or by acts of vandalism where the sign can be painted, or colours suffer saturation variation by attrition. The area of image recognition has suffered numerous technical and technological advances, such as the creation of an algorithm by [20] using human facial features that can detect the presence of faces with reduced computational resources.
This paper discusses an easy and fast way of processing in devices with limited resources on volatile and non-volatile memory and processing capacity, providing a TSDRS solution that runs on lightweight, inexpensive, energy-economic, devices specific for the implementation of embedded systems.
Experimental testing
In this section are described the several implementations that compose the embedded system for detection, recognition and classification of traffic signs, implemented in a microcontroller with low computational resources and low power consumption.
Hardware. The hardware used for the image capture was the CMUcam3 [21] because it fulfills
the minimum requirements of the TSDRS development. The cmucam3 is composed by three main components, the CMOS sensor that is coupled to an image buffer and this last to the microcontroller. The use of the image buffer has benefits of decoupling the controller and the CMOS sensor so that both can operate at different speeds. It also must be taken into account that it is a low-power and low-cost equipment with free software and an embedded controller, which from one side becomes a low investment but from the other make the initiation and development much more difficult.
Software. Two main programs are used: MATLAB [22] to build the database and the Dev-C++ to
write the .c code. The choice of these two programs are related with the prior knowledge base on the former and free cost of the latter that fits the project characteristics.
The base files, compiler and flash utility used were recommended by the CMUcam3 development guide (Cygwin [23] as compiler and Philips LPC2000 flash utility).
Algorithms. To develop an algorithm that is fast and light enough to be implemented in a low
computational resources device was necessary to build it from basic forms of processing. The general procedure for TSDRS is composed by four sections: (1) Signal acquisition; (2) Processing; (3) Classification; and (4) Communication.
The block that comprises the signal acquisition is constituted by the Omnivision CMOS camera sensor module. The procedure consists in converting the gRGB (colour filter array -Bayer filter- for arranging RGB colour with a pattern 25% red) to RGB (Red, Green and Blue colour model) and to stored the image in memory making use of a FIFO (First In, First Out) technique to organize and manipulate the data.
The processing block diagram is composed by four components. The first component consists in obtaining the image from the previous section (Get image from FIFO). Then, the image in RGB colour model is converted to HSV (Hue, Saturation and Value), which is one of the most common cylindrical-coordinate representations of points in an RGB colour model. The original image must be converted from RGB to HSV in order to perform an image binarization (set of 1-bit colour images from the primary image), which is the following component of the block diagram. After performing image binarization into blue and red ones, they are ready to be classified.
The block diagram of the classification process (see Fig. 1) starts receiving the binarized images from the previous section. The first component performs geometry recognition. If there are immediately recognized pictograms, the classification process finishes. In other hand, the pictogram will pass through additional processes in order to adjust it (rotation) to provide supplemental possibilities to be recognized as traffic sign. The image is discarded if it is not recognized as valid after passing through all these processes.
Resulting images Geometry recognition Has pictograms? Recognized signal No Pictogram recognition (method 1) Yes Pictogram valid? Yes Pictogram recognition (method 2) No Pictogram valid? Yes Image rejection No
Fig. 1. Block diagram of the classification process.
The last component of the TSDRS is the communication block. This last process is very important in the development of the end-user device. However, not being a key objective of this study, a serial communication protocol was used given its greater accessibility for computer communication. The values reported by the camera are subdivided as shown in Table 1. Some signs are classified number and others by a number and character. This configuration is due to signs of "Give way" and STOP be unique, while others contain more information within it and therefore appear with "x" concerning values variation depending on the sign.
The algorithms used in the recognition processes were:
• Economic Order [24] to find the center of region of interest (ROI).
• Freeman method [25] to detect the closed form with the inclusion of additional measures to calculate inclination to the center point.
• “Ear pull” algorithm to extract sample images.
The method to discard images shown in Fig. 1 allows the system to obtain a new image, and with a new luminosity or other angle it’s possible to recognize a signal. This method of capturing good images in opposition of making better algorithms to process all images allows the system to perform faster traffic sign recognitions in real time environment.
Table 1. Classification correspondence.
Geometry Colour Blue Info (6x) Obligation (5x) Red Danger (3x) Give way (200) Prohibition (4x) STOP (100)
Detection, recognition and classification process
The algorithm starts the recognition when there are a minimum number of pixels (threshold) and performs an iterative process to find the central point. The iterative process used was based in an economic order to calculate the best way to produce electricity [24]. The use of an iterative process allows processing with small computational recourses in order to define a centroid point. After the recognition task, it runs neighbour values, in the up, down, left and right directions until it finds the edge of the traffic sign. After performing this procedure, it starts a basic calculation to find the
starting point to initiate the application of the Freeman method. This method is applied to a simple line, however, in this work was implemented the inclination calculus of the observed point for the centroid point, allowing to find the next point to process.
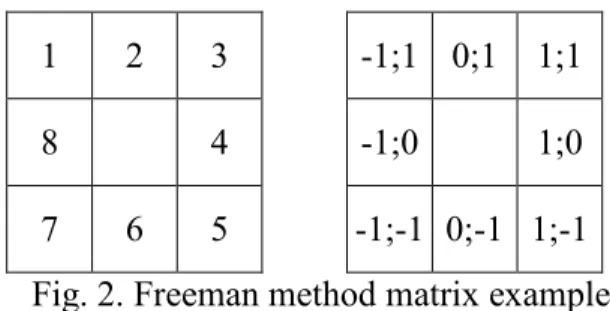
In the road environment there are different elements with the same colour, i.e., inside the images resulting from binarization is also information (not helpful) that must be removed, so it is perform a inspection to evaluate if the form is closed. This process was carried out using the Freeman method [25], but performing it some modifications to include an increment/decrement of x and y variables factor and centroid value. The process is completed successfully if the values of ∆x = 0 and ∆y = 0. This means that the object is closed. This process is described in Fig. 2, composed by two matrices. The left one contains each value assigned while the right one contains the x and y coordinates relatively to the matrix centre (reference point at which it will proceed with for the neighbourhood information).
1 2 3 -1;1 0;1 1;1
8 4 -1;0 1;0
7 6 5 -1;-1 0;-1 1;-1 Fig. 2. Freeman method matrix example.
Initially, the centroid of all joint elements is calculated in order to pass them through the Freeman matrix. This is process is required to start the Freeman matrix from the most distant point from the centroid in order to avoid errors due to non-looping effect. Fig. 3 shows examples of the centroid calculus importance. In Fig. 3 a), the Freeman's matrix started at point {x, y} = {0, 1} making a clockwise sweep. A loop occurs when it reach the most distant point, because the neighbourhood is found at the first point. The centroid was calculated in Fig. 3 b). It will allow to know the farthest point and to which side rotate, allowing to traverse the sign periphery.
a) Freeman's matrix starting point. b) Centroid calculation. Fig. 3. Importance of centroid calculus.
Having the initial point regarding the centroid calculation, the process is always driven to the edge. Thus, in addition of calculating whether the form is closed off, features like x/y that define the sign are determined. The speed of the shape recognition process is increased considering Eq. 1 that provides a way to check a possible form, namely triangular shapes, where the condition is verified.
∑ ∆ = 0 ∪ ∑ ∆ = 0 (1)
This allows recognizing triangular forms (warning signs) and Give Way signs more quickly. The recognition process starts by checking if the form is closed if the above condition is unfeasible. If the form isn’t closed, the system discards this image and acquires a new one. If both conditions are valid the next step on the recognition procedure makes use of the “ear pull” algorithm. Otherwise, the recognition procedure jumps directly to the comparison with the pictogram stored in ROM.
The “ear pull” algorithm runs after recognizing a closed form, and determines the slope of the sign starting from 1/3 of its total width. All sign points, excepting for circular signs, are horizontal in the bottom/top of traffic signs at this position. This slope value is used to generate three image samples for colour components (1) red/blue, (2) black and (3) white that will be compared with values on ROM. Initially, the images quality is low and this feature is deteriorated after their generation with the slope value. However, the conversion process requires low computational processing which in turns it faster. The low quality of the resulting images is enough to compare them with the images stored in ROM. The sign forms are recognized by the comparison of probability values of being one of the regular sign forms. Pictograms are considered as possible sign form whenever its probability value exceeds 60% and as a certain sign if the probability value is higher than 90%. The embedded system recognized 77% of road signs with these conditions. These value was obtained by the Eq. 2.
Recognized percent = !"#$%& '
($)*%& ' + 100% (2)
It’s very important to highlight that 77% of road sign recognition are delivered by practical tests. This recognition rate includes also non recognized signs due to small degradations like saturation loss, high luminance caused by sunlight and the direct sunlight on the CMOS sensor.
Many times was observed that if the vehicle passed again on the same place but with different climatic conditions (without direct sunlight incidence on the sign or on the camera), the system recognized the sign. This situation reveals the high influence of climatic conditions on the recognition results. The total process is shown in Fig. 4 to Fig. 6, demonstrating all the procedure within the TSDRS.
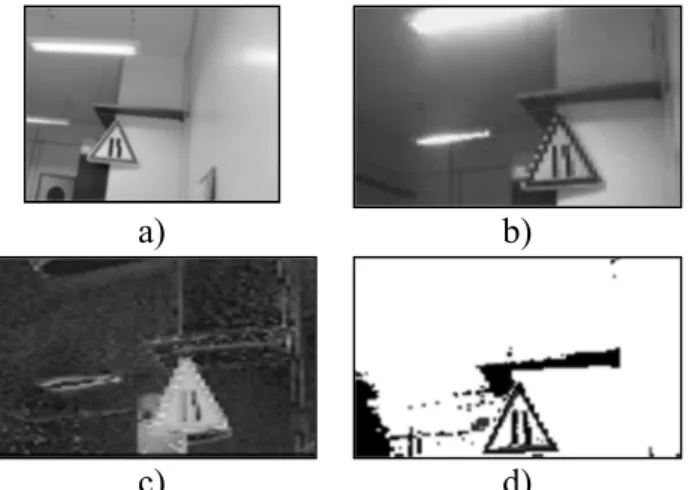
Fig. 4 a) is obtained by a digital camera while Fig. 4 b) is the obtained by the CMUcam3. Fig. 4 c) is the conversion from RGB colour model to HSV while Fig. 4 d) shows the multi-binarization of the image. A black colour edge around the sign is visible in this last figure. This allows the form recognition after application of Freeman’s method.
Fig. 5 a) is a cut containing the important data of the sign. The outer form is erased, and the slope value is calculated to build images in Fig. 5 b), c) and d).
Each stored pictogram has a number that connects them to the form (the possible combination). After triangle recognition (Fig. 5 a)), the algorithm reads that inner information can only be black (Fig. 5 b)), so it only uses Fig. 5 c) to perform classification. After, it compares with the pictogram with traffic sign stored in ROM. If the pictogram can be classified, it reads the communication value (that is written with the pictogram according to all 5 forms) and then communicates the value and its accuracy probability.
The signs communication is unique, but could be various communications by image.
a) b)
c) d)
a) b) c) d) Fig. 5. TSDRS image processing (binarization).
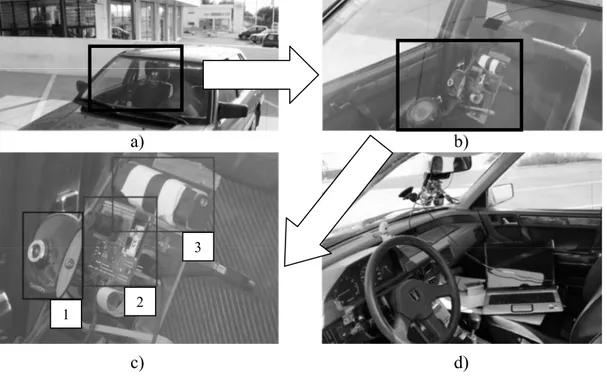
After all laboratory tests, all components were installed in a car as showed in Fig. 6, adding more components that were auxiliary. The components were the batteries to isolate car electrical ground since the laptop power supply used an inverter, laptop and webcam in order to create a movie and receive the data sent by the camera. In Fig. 6 is shown the global view of the system (a), more specific (b) and even more specific (c). In Fig. 6 c) are shown the webcam (1), CMUcam3 (2) and the battery pack (3). Fig. 6 d) shows an inside global view of the system.
a) b)
c) d)
Fig. 6. Road tests apparatus.
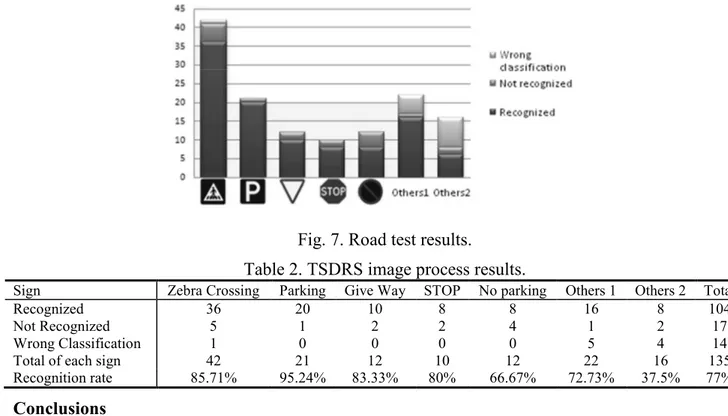
Fig. 7 shows the values of the positive, negative and non-recognized traffic signs obtained with the TSDRS on road tests. The zebra crossing sign was positively recognized 36 different times, it not recognized 5 times and only once a wrong classification was performed by the TSDRS. The parking sign was recognized 20 times and only once was not recognized. The give way sign was encountered 12 times during the road test. Only two this traffic sign was not positively recognized. Similarly, STOP sign was found 10 times being two not recognized. Likewise, the car passed by 12 Parking signs during the road test, not being recognized four times.
The summary of recognized, not recognized and wrong classified signs is shown in Table 2. The signs “Others 1” and “Others 2” are signs that are less common; the “Others 1” are signs that have pictograms with strong lines, e.g., turn left prohibition sign. The signs classified with “Other 2” it’s signs that was predicted to fail, mostly because the lack of definition of the CMOS sensor that wasn’t able to grab the pictograms with thin lines, e.g., snow attention sign.
1 2
Fig. 7. Road test results.
Table 2. TSDRS image process results.
Sign Zebra Crossing Parking Give Way STOP No parking Others 1 Others 2 Total
Recognized 36 20 10 8 8 16 8 104
Not Recognized 5 1 2 2 4 1 2 17
Wrong Classification 1 0 0 0 0 5 4 14
Total of each sign 42 21 12 10 12 22 16 135
Recognition rate 85.71% 95.24% 83.33% 80% 66.67% 72.73% 37.5% 77%
Conclusions
A low power and lower computational resources embedded system is developed for traffic signs detection. Its small memory space presented some difficulties to store all relevant information to perform the totally correct traffic signs recognition. Nevertheless, the algorithms developed for the traffic signs recognition overcome the hardware limitations. It was demonstrated that the system developed is enough to obtain information complementary to other navigation devices, including GPS, thus ensuring real-time updating and an irrefutable importance for redundancy. However, an improvement to embedded system here proposed is the use of a high speed controller that provides a higher refresh rate. The CMOS sensor is not the most suited for this application. A sensor with higher resolution, prepared for outdoor light variations, low light conditions and with more lens aperture can be a useful contribution to acquire more information as traffic signs not only appear at the right side but also at left one.
The detection algorithm simplifies the traffic signs recognition procedure and it is structure in a way that allows further development to detect traffic signs even when its form is not completely closed. Although the several advantages provide by the HSV colour space, in practice, other colour space completely abstract to luminosity should be used, such as the HSL colour space (Hue, Saturation and Luminance).
This approach for detection, recognition and classification of traffic signs is unable to recognize a shape when it is unclosed (i.e., a missing corner). However, as it uses a low power microcontroller with low processing capabilities and reduced memory, the results provided by the algorithms are promising when a more powerful microcontroller, enabling an increased recognition rate.
References
[1] S.M. Bascón, J.A. Rodríguez, S.L. Arroyo, A.F. Caballero, F.L. Ferreras, An optimization on pictogram identification for the road-sign recognition task using SVMs, Computer Vision and Image Understanding, 114(3) (2010) 373-383.
[2] P. Siegmann, R. López, P. Gil, S. Lafuente, S. Maldonado, Fundaments in luminance and retroreflectivity measurement of vertical traffic signs using a color digital camera, IEEE Transactions on Instrumentation and Measurement 57(3) (2008) 607-615.
[3] R. Vicen-Bueno, R. Gil-Pita, M. Rosa-Zurera, M. Utrilla-Manso, F. López-Ferreras, Multilayer perceptrons applied to traffic sign recognition tasks, Proc. of the 8th Int. Conf. on Artificial Neural Networks: computational Intelligence and Bioinspired Systems (IWANN'05), (2005) 865-872.
[4] T. Hibi, Vision based extraction and recognition of road sign region from natural color image, by using HSL and coordinates transformation, Proceedings of the 29th International Symposium Automotive Technology and Automation (1996) 201-206.
[5] D. Kang, N. Griswold, N. Kehtarnavaz, An invariant traffic sign recognition system based on sequential color processing and geometrical transformation, Proceedings of the IEEE Southwest Symposium on Image Analysis and Interpretation (1994) 88-93.
[6] S.H. Hsu, C.L. Huang, Road sign detection and recognition using matching pursuit method, Image and Vision Computing 19(3) (2001) 119-129.
[7] P. Douville, Real-time classification of traffic signs, Real-Time Imaging 6(3) (2000) 185-193. [8] U. Krebel, F. Lindner, C. Wohler, A. Linz, Hypothesis verification based on classification at unequal error rates, Proceedings of the Ninth International Conference on Artificial Neural Networks (ICANN 99) (1999) 874-879.
[9] S. Maldonado, S. Lafuente, P. Gil, H. Gomez, F. Lopez, Road-sign detection and recognition based on support vector machines, IEEE Trans. on Intelligent Trans. Systems 8(2) (2007) 264-278. [10] Y. Aoyagi, T. Asakura, A study on traffic sign recognition in scene image using genetic algorithms and neural networks, Proceeding of the 22nd IEEE International Conference on Industrial Electronics, Control and Instrumentation, vol. 3, Taipeh, Taiwan (1996) 1838-1843.
[11] A. de la Escalera, L.E. Moreno, E.A. Puente, M.A. Salichs, Neural traffic sign recognition for autonomous vehicles, 20th International Conference on Industrial, Electronics, Control and Instrumentation (IECON'94), IEEE, vol. 2 (1994) 84-846.
[12] R. Luo, H. Potlapalli, D. Hislop, Neural network based landmark recognition for robot navigation, Proc. of the International Conference on Industrial Electronics, Control, Instrumentation, and Automation, Power Electronics and Motion Control, IEEE (1992) 1084-1088.
[13] A. de la Escalera, J.M. Armingol, J.M. Pastor, F.J. Rodríguez, Visual sign information extraction and identification by deformable models for intelligent vehicles, IEEE Transactions on Intelligent Transportation Sytems 15(2) (2004) 57-68.
[14] E. Perez, B. Javidi, Nonlinear distortion-tolerant filters for detection of road signs in background noise, IEEE Transactions on Vehicular Technology 51(3) (2002) 567-576.
[15] J. Miura, T. Kanda, Y. Shirai, An active vision system for real-time traffic sign recognition, Proceedings of the IEEE Intelligent Transportation Systems (2000) 52-57.
[16] E. Frias-Martinez, A. Sanchez, J. Valez, Support vector machines versus multilayer perceptrons for efficient off-line signature recognition, Eng. App. of Art. Intelligence 19(6) (2006) 693-704. [17] B. Cyganek, Circular road signs recognition with soft classifiers, Integrated Computer-Aided Engineering 14(4) (2007) 323-343.
[18] H. Shojania, Real-time Traffic Sign Detection (2003). Available from: http://hassan.shojania.com/
[19] A. de la Escalera, J.M. Armingol, M. Mata, Traffic sign recognition and analysis for intelligent vehicles, Image and Vision Computing 21(3) (2003) 247-258.
[20] P. Jones, M. Viola, Rapid Object Detection using a Boosted Cascade of Simple Features, Proceedings of the 2001 IEEE Computer Society Conference on Computer Vision and Pattern Recognition (CVPR 2001), vol. 1, IEEE (2001) 511-518.
[21] A. Rowe, A., Goode, CMUcam3 software installation guide v0.1 for the CMUcam3 embedded vision sensor, Illah Nourbakhsh, Carnegie Mellon University, 2006.
[22] MathWorks, Introduction to MATLAB, MathWorks, 2008. [23] Cygwin, Cygwin User's Guide, Red Hat Inc., 2010.
[24] S. Mariano, Sistemas de decisão óptima em coordenação hidrotérmica para planeamento operacional, Universidade da Beira Interior, 2000. (in portuguese)
[25] A. Lorsakul, J. Suthakorn, Traffic sign recognition using neural network on OpenCV: Toward intelligent vehicle/driver assistance system, Mahidol University, 2007.