GLOBAL EDUCATION DIGEST 2007
Comparing Education Statistics Across the World
�
������
������
The Global Education Digest (GED) 2007 presents a wide range of UNESCO education indicators
that can be used to assess progress towards Education for All and Millennium Development
Goals. These cross-nationally comparable indicators also provide benchmarks for the overall
performance of national education systems.
The Digest provides data for the school year ending in 2005 or the latest year available.
It includes new estimates for education expenditure by region and adds a new indicator of per
pupil expenditure based on purchasing power parities. For comparisons over time, key indicators
are also presented for 1999.
The 2007 edition of the GED focuses on the theme of financing education systems. The analytical
overview surveys a range of global benchmarks for public spending on education, examines
equity issues such as the distribution of funding by education level, and shows differences among
countries in terms of the sources and uses of funds for education.
The UNESCO Institute for Statistics (UIS) is the statistical office of the United Nations Educational,
Scientific and Cultural Organization (UNESCO) and is the UN depository for comparable statistics
in the fields of education, science and technology, and culture and communication.
To access online resources related to the GED – including the statistical tables, time series data
for years between 1999 and 2005, accompanying metadata and other materials – please consult:
www.uis.unesco.org/publications/GED2007.
To order the interactive database on CD-Rom, please contact:
[email protected]
.
UNESCO Institute for Statistics
P.O. Box 6128, Succursale Centre-Ville
Montreal, Quebec H3C 3J7
Livros Grátis
http://www.livrosgratis.com.br
GLOBAL EDUCATION DIGEST
2
0
0
7
Comparing Education Statistics Across the World
]
[
Foreword
The authors are responsible for the choice and the presentation of the facts contained in this book and for the opinions expressed therein which are not necessarily those of UNESCO and do not commit the Organization. The designations employed and the presentation of material throughout this publication do not imply the expression of any opinion whatsoever on the part of UNESCO concerning the legal status of any country, territory, city or area or
Members.
The main objective of UNESCO is to contribute to peace and security in the world by promoting
collaboration among nations through education, science, culture and communication in order to
foster universal respect for justice, the rule of law, and human rights and fundamental freedoms
that are affirmed for the peoples of the world, without distinction of race, sex, language or religion,
by the Charter of the United Nations.
To fulfill its mandate, UNESCO performs five principal functions: 1) prospective studies on education,
science, culture and communication for tomorrow’s world; 2) the advancement, transfer and
sharing of knowledge through research, training and teaching activities; 3) standard-setting actions
for the preparation and adoption of internal instruments and statutory recommendations;
4) expertise through technical co-operation to Member States for their development policies and
projects; and 5) the exchange of specialised information.
UNESCO is headquartered in Paris, France.
The UNESCO Institute for Statistics
The UNESCO Institute for Statistics (UIS) is the statistical office of UNESCO and is the UN depository
for global statistics in the fields of education, science and technology, culture and communication.
The UIS was established in 1999. It was created to improve UNESCO’s statistical programme and to
develop and deliver the timely, accurate and policy-relevant statistics needed in today’s increasingly
complex and rapidly changing social, political and economic environments.
The UIS is based in Montreal, Canada.
Published in 2007 by:
UNESCO Institute for Statistics
P.O. Box 6128, Succursale Centre-Ville Montreal, Quebec H3C 3J7Canada
Tel: (1 514) 343-6880 Fax: (1 514) 343-5740
Email: [email protected] http://www.uis.unesco.org © UNESCO-UIS 2007 Ref: UIS/SD/07-01 ISBN: 978-92-9189-044-6
Design: Sabine Lebeau / les souris zélées
Foreword
Foreword
The analysis in this year’s
Global Education Digest
(GED) focuses on the financing of
education, especially at the primary level. As national policymakers set goals and
objectives for their education systems, such as expanding access or improving quality,
they need to consider the resources required and weigh them against other needs.
Increasingly, policymakers look to international comparisons for guidance in whether
they are investing sufficient levels of resources in education and whether they are
using these resources efficiently and effectively.
As stated by the international community in the Dakar Framework for Action, “no
country shall be thwarted from meeting the [EFA] goals due to lack of resources”
(Education for All Forum, 2000). In response, national governments, international
organizations and donors must assess the gap in levels of resources currently
invested in EFA and those required to actually achieve the goals. In particular, there is
significant interest in benchmarking government efforts to provide universal primary
education.
The role of public financing of education is crucial. For most countries, the state
plays the predominant role in the management and financing of the education
system. How governments fund educational institutions is central to a number of
important policy debates that have gained greater attention in the last decade, such
as decentralisation and privatisation.
For this analysis, the UNESCO Institute for Statistics (UIS) draws on a wide range
of data and highlights where additional information is needed to better monitor
progress and guide policy decisions. It surveys how much governments invest in
education, both in relation to their national income and in terms of absolute levels
of expenditure. It presents new indicators to analyse spending levels across countries,
most notably by reporting on expenditure in purchasing power parities. This allows
for greater comparability across countries than the use of market exchange rates by
reflecting actual price structures for education provision in countries.
But the inequalities are even sharper within countries because children and young
people do not have equal access to education. Some children never enter school and
therefore receive no benefit from public funding for education. According to entry rates,
one out of three children in sub-Saharan countries does not have access to school and,
thus, public resources for education. Many other children enter school but then drop out
before completing primary education. So they only benefit from a few years of public
spending. On the other hand, the small group of students who go on to secondary or
tertiary education receive the greatest benefit from public education funds.
International financial statistics are often criticized for shortcomings in comparability.
While there is still much room for improvement, the UIS has reinforced initiatives with
individual Member States to improve the quality of these data, particularly in terms of
public expenditure on education. The UIS has made greater efforts to document data
sources underlying finance indicators and to identify problems with definitions, as well
as data gaps and areas requiring further development.
Moreover, the UIS collects data to monitor progress towards the international
education-related targets, such as EFA and the Millennium Development Goals. The
Institute undertakes a number of activities across countries which seek to improve the
timeliness, comparability, completeness and reliability of data. For example, a series of
regional workshops on education statistics are taking place in 2007 for statisticians and
policymakers in Member States. These intensive exchanges lead to improvements in the
scope and comparability of data by implementing international measurement standards.
This report is complemented by an interactive database which is accessible on-line
at
www.uis.unesco.org/publications/GED2007
or on CD-ROM
(see section on On-line
Resources)
. The database contains additional indicators and time series that are not
presented in the print version of the Digest. Key indicators in the on-line database are
updated regularly and provide access to the most timely international education data
available.
Hendrik van der Pol
Director
Contents
Foreword
3
Acknowledgements
6
Costs and commitments in financing Education for All
7
Reader’s guide
55
Statistical tables
59
1. Pre-primary education / ISCED 0 / Enrolment and teaching staff
60
2. Primary education / ISCED 1 / New entrants
70
3. Primary education / ISCED 1 / Enrolment and teaching staff
80
4. Measures of progression and completion in primary education / ISCED 1
90
5. Secondary education / ISCED 2 and 3 / Enrolment and repeaters / 2005
100
6. Secondary and post-secondary non-tertiary education / ISCED 2, 3 and 4 /
110
Teaching staff and post-secondary non-tertiary enrolment / 2005
7. Upper secondary (ISCED 3) graduation and entry to tertiary (ISCED 5) education /
120
2005 (selected countries)
8. Tertiary education / ISCED 5 and 6 / Enrolment and teaching staff
124
9. Internationally mobile students in tertiary education by host country and
134
region of origin / 2005 (countries having more than 1000 mobile students)
10. International flows of mobile students in tertiary education / 2005
138
11. Tertiary education / ISCED 5 and 6 / Graduates by field of education / 2005
144
12. School life expectancy
154
13. Public expenditure on education and expenditure on education by nature
164
of spending / Financial year ending in 2005 or latest year available
14. Expenditure on educational institutions as a percentage of gross domestic product / 174
Financial year ending in 2005 or latest year available
15. Adult and youth literacy / 1995-2005
184
ANNEX A / Glossary
191
ANNEX B / Definitions of indicators
196
ANNEX C / International Standard Classification of Education (ISCED97)
200
ANNEX D / Regions
202
ANNEX E / On-line resources
205
This
Global Education Digest
is based on data provided by the countries or territories
covered in this publication. We would like to express our gratitude to all those
statisticians who, in each country and territory, took the time to respond to the UIS,
UOE or WEI questionnaires as well as our requests for clarification. We would also
like to express our thanks to the international organizations, in particular the United
Nations Statistics and Population Divisions, the World Bank, the Organisation for
Economic Co-operation and Development (OECD), Eurostat and other specialised
institutions, that supplied additional information and statistics to complement those
gathered directly by the UIS.
This publication is possible thanks to the work of a number of staff members of the UIS.
The overall preparation of the data presented in this report was the responsibility of
Juan Cruz Perusia, under the supervision of Alison Kennedy and Michael Bruneforth,
and with the collaboration of a team consisting of: Aurélie Acoca, Saïd Belkachla, Hugo
Castellano Tolmos, Ghania Djafri, Léandre Francisco, Monica Githaiga, Tin Nam Ho,
Olivier Labé, Anne-Marie Lacasse, Weixin Lu, Lucy Hong Mei, Saïd Ould Voffal, John
Pacifico, José Pessoa, Pascale Ratovondrahona, Ioulia Sementchouk and Anuja Singh.
The overview chapter was prepared by Michael Bruneforth and Albert Motivans and
edited by Amy Otchet. Others providing inputs to the chapter were: Yanhong Zhang,
Keith Hinchliffe, Serge Peano and Aurélie Acoca. We also thank the anonymous
reviewers of the chapter.
INTRODUCTION
The financing of Education for All (EFA)
has become a key issue in national and
international efforts to achieve universal
primary education by 2015. Basic education is
widely recognised as an essential human right
and a key to poverty alleviation and sustainable
human development. Yet, some governments
are unable to provide sufficient resources to
provide free basic education for all. This, in turn,
has highlighted the role of the international
donor community in closing the gap. Measures
must first better assess the capacity of
governments (and societies) to mobilise
needed resources. They must also reflect the
demographic constraints and policy trade-offs
that influence a government’s ability to achieve
EFA goals.
A number of studies have sought to identify
country characteristics which are associated
with progress towards education goals. These
studies repeatedly stress the importance of
ensuring a sufficient and stable source of
funding for education (Colclough with Lewin,
1993; Mehrotra, 1998; Bruns, Mingat and
Rakotomalala, 2003). Countries with relatively
high primary gross enrolment ratios and
primary completion rates generally devote a
greater share of national income or government
budgets to public primary education. In
addition, expenditure per primary pupil also
tends to be in the middle of the range (relative
to GDP per capita). However, the level of
public funding alone does not indicate good
outcomes. Successful governments also find a
balance between private and public education
costs as they improve efficiency and prioritise
primary school expenditure (Colclough and
Al-Sammarai, 2000).
For most countries, the state plays the
predominant role in the management and
financing of the education system, especially
at the primary level. Governments must often
make difficult decisions about mobilising and
allocating these resources, especially in light of
rising demand from other public service sectors,
such as infrastructure or health care. There is also
competition within the education system. For
example, universities and secondary schools often
vie for the same funding as primary schools.
Policymakers also face other trade-offs when
setting goals for their education systems. Would
resources be better spent expanding access to
schooling or improving the quality of instruction?
And what levels of funding are required?
Cross-national comparisons can help authorities to
assess whether they are adequately investing in
education and using these resources in the most
effective, efficient and equitable manner.
It is difficult to link resource levels to potential
educational outcomes. It is clearly not enough to
simply change spending patterns to bring about
a desired outcome. Education financing must
be used in an effective and efficient manner for
positive change. Moreover, system-level indicators
(such as spending as a share of national income
or GDP) do not provide a clear picture of the
effective use of resources and their impact on
learning. Thus, it is important to combine these
indicators with measures of system performance
and learning outcomes to provide greater insight.
This overview looks at four major funding issues
for policymakers. The first section reviews overall
levels of education funding across the world and
how levels in certain countries compare to those
of others with similar economic resources and
student populations.
The discussion in Section 2 focuses on the costs
of education in absolute and relative terms across
countries. Policymakers must examine the mix
of investment at different levels of education.
This section looks at whether resources are
concentrated in expanding access to primary
education for a broader segment of the
population or if the priority is higher education,
where a much narrower part of the population
benefits from public investment.
Section 3 presents some of the constraints and
opportunities to financing primary education
for all. It examines trends in demographics,
education participation and progression in order
to analyse the factors which influence current and
future patterns of education spending.
Section 4 addresses another key concern for
policymakers: the mix of public and private
funding for education. It analyses the available
comparative evidence on private contributions to
financing education systems, the prevalence of
public and privately-funded institutions, and the
use of state subsidies for educational institutions
through households and individuals.
1. MEASURING AVAILABLE RESOURCES
AND GOVERNMENT COMMITMENT
As stated by the international community in the
Dakar Framework for Action, “no country shall
be thwarted from meeting the [EFA] goals due to
lack of resources” (Education for All Forum, 2000).
In response, national governments, international
organizations and donors must assess the levels
of resources currently invested in EFA and those
required to actually achieve the goals. In particular,
there is growing attention to benchmarking the
efforts by governments in terms of resources
devoted to universal primary education.
This section looks at two main indicators used to
measure government commitment to education.
The first consists of education expenditure as
a share of national wealth or gross domestic
product (GDP) per capita. This represents
the available resources for education in the
broadest sense. It is then possible to better
gauge government commitment by the second
indicator, which represents the share of the total
public budget devoted to education. It reflects the
commitment of governments to education and
the extent to which the sector can compete with
other public spending priorities.
It is important to recognise that these indicators
only reflect public education expenditure –
not private investment. Only one-quarter
of the world’s countries are able to provide
internationally comparable data on private
education expenditure (
see Statistical Table 14
).
They are typically among the world’s
most-developed countries. Section 4 presents a more
detailed perspective on the entire range of
funding sources.
In this section, patterns of government spending
on education for 136 countries with available
data are presented. The focus shifts from patterns
in overall spending on education to the specific
commitment of governments for funding primary
education.
Government spending on education -
Global and regional averages
The overall level of funding for education is an
important issue facing policymakers. Is there
sufficient funding to provide children with a
good quality education? How much do countries
with similar economic resources and student
populations invest in education? Global and
regional averages for education indicators help to
provide a context for analysing country-level data.
Table 1
shows that governments of the world
invested the equivalent of PPP$ 2.5 trillion in
education in 2004. This figure represents 4.4% of
global GDP in PPP$. (
See
Box 1
for an explanation
of PPP dollars, which are the basis for all regional
figures.
)
C O S T S A N D C O M M I T M E N T S I N F I N A N C I N G E D U C A T I O N F O R A L L G L O B A L E D U C A T I O N D I G E S T
2 0 0 7
C O M P A R I N G E D U C A T I O N S T A T I S T I C S A R O U N D T H E W O R L Dresources in education: 5.6% of the regional GDP.
The region is followed by the Arab States (4.9%)
and sub-Saharan Africa (4.5%). The regions of
Latin America and the Caribbean as well as
Central and Eastern Europe are close to the world
average, with 4.4% and 4.2% respectively.
By far the lowest level of public spending is found
in Central Asia and in East Asia and the Pacific –
both of which report only 2.8% of GDP. However,
the figure for East Asia and the Pacific should be
interpreted with caution as the average is based
on an estimate for China for 1999.
TABLE 1
How much do the world’s governments invest in education?
Public education expenditure in PPP$ and as a percentage of regional GDP, by region, 2004
Table 1a. Public education expenditure by region, 2004
Region
Education expenditure
as % of GDP
PPP$ (in billions)
% of regional total
Total Primary level Total Primary level Total Primary level
Arab States 4.9 1.7 77.8 27.0 3.2 3.6
Central and Eastern Europe 4.2 1.1 164.0 41.2 6.7 5.6
Central Asia 2.8 0.6 7.7 1.8 0.3 0.2
East Asia and the Pacific 2.8 1.0 441.7 149.8 17.9 20.2
Latin America and the Caribbean 4.4 1.6 186.5 68.8 7.6 9.3
North America and Western Europe 5.6 1.5 1,355.6 372.3 55.1 50.2
South and West Asia +1 3.6 1.2 169.1 54.6 6.9 7.4
Sub-Saharan Africa 4.5 2.1 59.9 27.9 2.4 3.8
WORLD 4.4 1.3 2,462.2 741.1 100.0 100.0
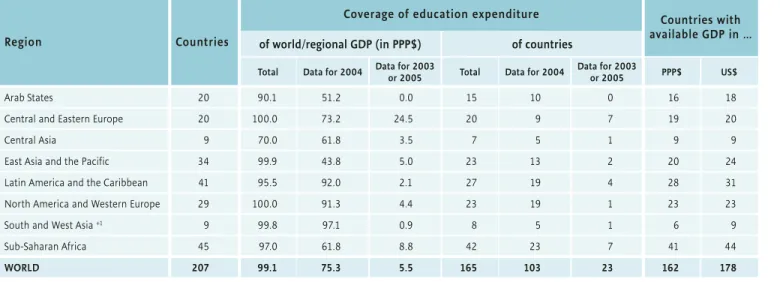
Table 1b. Coverage of data on total public education expenditure by region, 2004
Region
Countries
Coverage of education expenditure
Countries with
available GDP in …
of world/regional GDP (in PPP$)
of countries
Total Data for 2004 Data for 2003 or 2005 Total Data for 2004 Data for 2003 or 2005 PPP$ US$
Arab States 20 90.1 51.2 0.0 15 10 0 16 18
Central and Eastern Europe 20 100.0 73.2 24.5 20 9 7 19 20
Central Asia 9 70.0 61.8 3.5 7 5 1 9 9
East Asia and the Pacific 34 99.9 43.8 5.0 23 13 2 20 24
Latin America and the Caribbean 41 95.5 92.0 2.1 27 19 4 28 31
North America and Western Europe 29 100.0 91.3 4.4 23 19 1 23 23
South and West Asia +1 9 99.8 97.1 0.9 8 5 1 6 9
Sub-Saharan Africa 45 97.0 61.8 8.8 42 23 7 41 44
WORLD 207 99.1 75.3 5.5 165 103 23 162 178
Notes: Global and regional averages are weighted using national GDP in PPP$ in 2004. Due to a lack of data, the relative weight of some countries was based on GDP in US$
in comparison to all other countries weight based on US$. For further details see on-line resources at www.uis.unesco.org/publications/GED2007.
This table presents data for 2004 – not 2005. Therefore, these figures may differ from those found in Statistical Tables 13 and 14.
Regional and global totals are calculated by multiplying the regional averages with the total regional GDP in PPP$. Coverage for primary education differs from that for total expenditure.
+1 Data refer to 2005.
Differences across countries in public education
expenditure as a percentage of GDP are
enormous. Governments investing high levels
in education spend 8 to 20 times more than
low-spending countries in relative terms. In
11 countries, public expenditure on education is
only 2% of GDP or lower: United Arab Emirates
(1.3%) and Qatar (1.6%) in the Arab States;
Indonesia (0.9%) and Cambodia (1.9%) in East
Asia and the Pacifi c; the Dominican Republic
(1.8%) and Bermuda (1.9%) in the Caribbean;
and Equatorial Guinea (0.6%), Cameroon
(1.8%), Zambia (2.0%), Gambia (2.0%) and
Guinea (2.0%) in sub-Saharan Africa. None of
the countries in Central and Eastern Europe,
Central Asia, Latin America, North America and
Western Europe or South and West Asia refl ect
such low rates of public investment.
On the other hand, public expenditure exceeds
8% of GDP in 10 countries: Vanuatu (9.6%) and
Marshall Islands (11.8%) in East Asia and the
Pacifi c; Saint Vincent and the Grenadines (8.2%),
Guyana (8.5%), Saint Kitts and Nevis (9.3%) and
Cuba (9.8%) in the Caribbean; Iceland (8.1%)
and Denmark (8.5%) in Western Europe; and
Botswana (10.7%) and Lesotho (13.4%) in
sub-Saharan Africa. (
See Statistical Table 13
.)
BOX 1
What are PPP dollars?
In order to compare the absolute costs per student or the magnitude of
national education budgets, it is essential to convert local currencies into a
single standard. Results can vary widely according to the method of calculation
used. In most cases, national currencies are based on the U.S. dollar at the
market exchange rate.
Yet, it is widely accepted that purchasing power parities (PPP) better refl ect
the real value of educational investments made by governments and families.
PPPs are rates of currency conversion which eliminate differences in price levels
among countries. This means that a given sum of money, when converted into
U.S. dollars at PPP rates, will buy the same basket of goods and services in all
countries.
On the basis of PPPs, the global education budget in 2004 was worth the
equivalent of $2.46 trillion. This fi gure would fall to 1.97 trillion if converted
into U.S. dollars on the basis of market exchange rates. From a policymaking
perspective, this difference may not be signifi cant. However, the choice of
conversion technique can seriously distort regional and national comparisons,
especially when considering inequalities among countries. For example, the
educational budget for sub-Saharan Africa in US$ represents just 1.1% of the
global total, compared to 2.4% in PPP$.
C O S T S A N D C O M M I T M E N T S I N F I N A N C I N G E D U C A T I O N F O R A L L G L O B A L E D U C A T I O N D I G E S T
2 0 0 7
C O M P A R I N G E D U C A T I O N S T A T I S T I C S A R O U N D T H E W O R L DHow do the global distributions of public education expenditure, national income and population compare?
Global distribution of public expenditure on education, GDP and population aged 5 to 25 years,
by region and for selected countries, 2004
FIGURE 1
��� ��� ��� ��� ��� ��� ��� ��� ���� ��� ��� ��� ��� ��� ��� ���� ���� � �� �� �� �� �� �� �� ��� �� �� � �� �� �� �� �� � �� �� �� � �� �� � � ��� ��� � �� �� �� � ��� � � � �� �� � � �� �� �� � ��� ���� �� �� �� � � �� �� � � �� � �� �� �� � �� �� �� �� � �� �� �� � ��� �� � �� �� � �� � � �� � � ��� �� ��� � � �� �� � �� � �� � � �� �� �� �� �� �� � ��� �� � �� � �� ��� �� � �� �� � � �� �� � �� � � �� �� �� ��� �� � �� �� �� �� �� �� �� � �� �� �� �� �� ������������������������������������������������� ������������������������ �����������������������������The global distribution of public
education spending
Figure 1
shows the percentage distribution
of the world’s public education spending
(measured in PPP$) by region and for selected
countries. The most-developed countries in
North America and Western Europe account for
more than one-half of the global total of public
education spending. Yet, less than 10% of the
world’s school-age population (from primary to
tertiary levels) live in these countries.
The United States, which is home to just 4%
of the global population aged 5 to 25 years,
accounts for more than one-quarter of the
global public education budget. It spends as
much as all governments in six global regions
combined: the Arab States, Central and Eastern
Europe, Central Asia, Latin America and the
Caribbean, South and West Asia, and
sub-Saharan Africa.
The American government spends 28% of
the world’s public expenditure on education,
a proportion that exceeds its share of global
wealth – which represents 21% of global GDP.
Similar cases are seen in France, Germany and
the United Kingdom, where their shares of
education spending outweigh their individual
proportions of the world’s school-age
population and global wealth.
Notes: 1. Data for China are based on a UIS estimate for 1999.
A very different situation emerges in East Asia
and the Pacific, which has the second-highest
share of global public spending on education,
at 18%. These governments invest less in
education than their share of global wealth
(28%) and the school-age population (29%).
More than one-half of the region’s education
spending is attributed to China (home to 17%
of the world’s school-age population) and
Japan (approximately 1% of this population). It
is important to note that the regional figure is
based on 1999 estimates for China, because
more recent data are not available.
In Latin America and the Caribbean, there is a
balance across education spending (8% of the
global total), the regional share of the world’s
children and young people (9%) and global
wealth (8%). The opposite scenario is found in
South and West Asia, where 7% of the world’s
public education resources are spent on 28%
of the school-age population.
The greatest imbalance is found in
sub-Saharan Africa, where only 2.4% of the world’s
education resources are devoted to 15% of the
school-age population. According to estimates,
the education budget of a single country
like France, Germany or Italy outweighs the
education expenditure of all sub-Saharan
African governments combined.
Public education funds and the overall
size of public budgets
To gauge public commitment to education,
the previous discussion focused on the size of
education budgets in relation to a country’s
ability to generate wealth (GDP). It is also
useful to compare the share of education
budgets with the overall state budget. This
breakdown highlights the relative importance
attached to education compared to other
priorities, such as health care or military
defense.
The size of available public resources varies
considerably across countries. Total public
budgets reported by countries range from less
than 10% of the national GDP in the United
Arab Emirates to over 50% in countries such as
Belarus, Cuba, Denmark, Jamaica, the Marshall
Islands, Saint Kitts and Nevis, and Sweden.
Government spending reaches over one-half of
the level of national income in 15 countries.
The highest shares of public spending relative
to GDP are found in the Marshall Islands (75%),
Saint Kitts and Nevis (74%), Jamaica (60%),
Cuba (59%), Guyana (58%), Sweden (57%) and
Denmark (56%).
At the other end of the spectrum, available
public resources are far more limited in the
United Arab Emirates, where government
spending accounts for just 5% of GDP, followed
by Madagascar (13%), Azerbaijan (13%), Zambia
(13%) and Oman (15%).
The share of public resources that are invested
in education also varies across countries. For
example, less than 5% of public expenditure
goes to education in Equatorial Guinea, while
close to 30% is spent in Lesotho and Kenya.
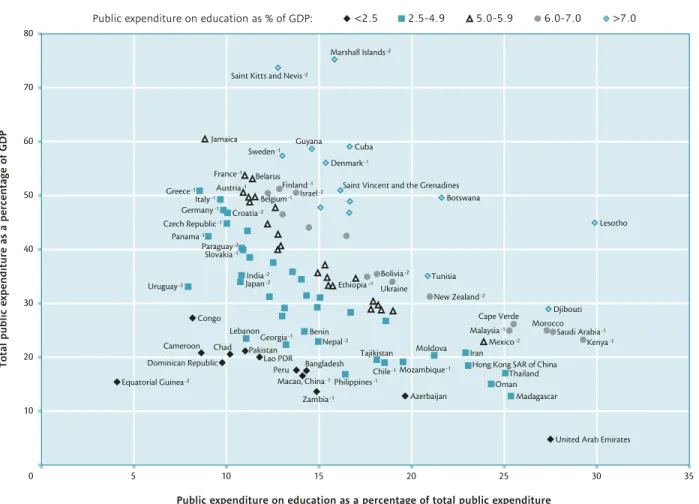
Figure 2
presents the relationship between
public education expenditure as a percentage
of total government expenditure and total
government expenditure as a percentage of
GDP for 104 reporting countries.
The figure shows that in countries where
total public expenditure represents a larger
share of national wealth (such as France,
Jamaica and Sweden), the proportion of public
expenditure that is spent on education is
smaller. Conversely, countries with more limited
available government resources in relation
to national income (such as Madagascar,
Oman and Thailand) tend to spend a higher
proportion of government revenue on
C O S T S A N D C O M M I T M E N T S I N F I N A N C I N G E D U C A T I O N F O R A L L G L O B A L E D U C A T I O N D I G E S T
2 0 0 7
C O M P A R I N G E D U C A T I O N S T A T I S T I C S A R O U N D T H E W O R L DLesotho, all countries with total state budgets
exceeding 40% of GDP spend less than 17% of
these ample budgets on education.
Figure 2 illustrates different patterns of public
spending and the size of the resulting education
budget relative to GDP. For example, Jamaica
and Mexico both spend about 5.4% of their
GDP on education. Jamaica, with a public
budget amounting to 60% of the GDP spends
less than 10% of these resources on education.
The government in Mexico generates far less
revenue in relative terms, amounting to just
over 20% of GDP. Therefore, it must devote 24%
of public spending to generate an education
budget similar to that of Jamaica.
The extent to which the public sector plays
a role in the provision of goods and services
helps to account for differences in public
education expenditure levels across countries.
When governments actively finance and
provide such services, public expenditure
plays a redistributive role in society. This
How do public budgets for education relate to total public expenditure?
Public education expenditure as a percentage of total government expenditure and
total government expenditure as a percentage of GDP, 2005
���������� �������� ������ ���� �������� �������� ��������� �������� �������� ���� ����� �������� ������ ������� ��� ��� ���� ���������� ���������� ������� ��������� ������������� ��������� ���������� ������� ������� ����� ���������� ���� ������� ������������ ������� �������� ���� ���� ��� �� ����� �������� ������� �������� ���������� ���������� ����� ���������� ��������� ��������� ������� ���� ������� �������� ��������� �������� ������� ���������� ��������� ���������� ��������� ������� ��� ��������� ��������� ���� ����� ������� ������� ����� �������� �������� ������� �������� �������� ����� ������� ��� ��� ���������� ������ ��������� ����� ����� ��� ������� ���� �������� �������� ��������� ������� �� �� �� �� �� �� �� �� � � �� �� �� �� �� �� ��������������������������������������������������������������������������� ������ ������� ������������ ��� �� ����������� ��� ��� �������������������������������������������� ���� ������� ������� ������� ����
Notes: Data on total public expenditure (non-education and education expenditure combined) for all levels of government combined (central, regional and local) are obtained from ministries of education by the UIS in absence of an authoritative international source. Because it is not the mandate of the UIS is to publish national accounts data, these data are not included in the UIS database.
+1 Data refer to 2006; -1 Data refer to 2004; -2 Data refer to 2003.
role is partially reflected by the overall size of
available public resources. In countries where
this role is weak (e.g. no infrastructure for tax
collection), there is less revenue to redistribute
through the funding of public services. Since,
in some of these cases, education systems
represent one of the few public services
provided by the government, education
expenditure is likely to make up a large share
of the total.
Changes in national income, public
expenditure and education expenditure
since 1999
How has public education expenditure changed
in real terms since 1999? Is it linked to changes
in the levels of GDP or total public budgets? For
a number of countries, it is possible to examine
how education funding levels have changed
in relation to trends in available resources
(e.g. national income and state budgets).
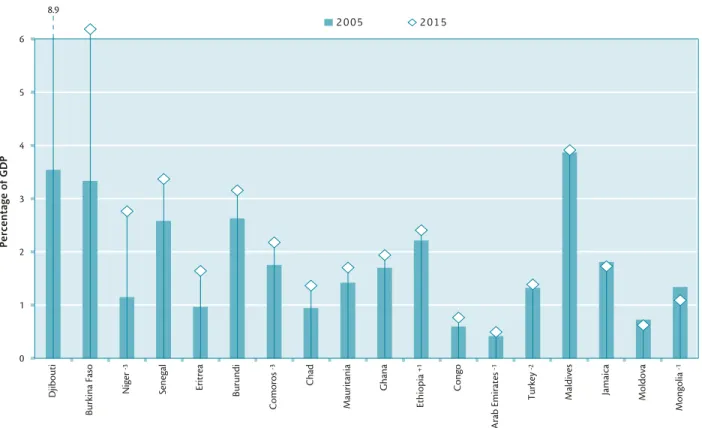
Figure 3
shows trends since 1999 in GDP
growth, total public spending and public
education expenditure for 41 countries with
available data. The change in actual education
spending in absolute values for 2005 is
adjusted for inflation.
Since 1999, national GDP grew in all countries
presented, especially in Central and Eastern
Europe, Central Asia, South and West Asia and
East Asia. Yet, it grew only marginally for some
more-developed countries (e.g. Argentina,
Austria, Denmark, Germany, Italy, Japan and
Portugal).
Thus, the rise in national income in many
countries could potentially lead to more
resources for education. But this ultimately
depends on a government’s ability to mobilise
additional revenue, which almost all countries
succeeded to do, except for Argentina, Guyana
and Saint Lucia.
In a number of countries, public budgets grew
more slowly than GDP. This is the case for
Argentina and Chile, for example, where public
budgets lagged behind the rise in GDP by more
than 10 percentage points since 1999. To the
contrary, public revenues grew faster than
the economy in 25 out of the 41 countries
presented and by more than 30 percentage
points in Colombia, Congo, Hungary, Mauritius
and Slovakia. A combination of growth in public
budgets and the share devoted to education
in Georgia, Tajikistan and Ukraine led to the
greatest increase in education expenditure
worldwide, over 80% since 1999.
The widespread growth in GDP and the even
more rapid growth in public expenditure
provided a good basis for expanding
education budgets in many countries. In
general, growth in the economy and public
expenditures corresponded to increased
education expenditures. Thus, while available
resources help to define the parameters for
public education spending, the political will to
redistribute income and allocate investment in
the sector differs broadly across countries.
In Bangladesh, Finland, Malaysia and Spain,
education expenditure rose in parallel to total
budgets, i.e. the share of public budgets spent
on education did not change compared to 1999,
but education expenditure grew by over 15%
due to the absolute increase in state budgets.
In Colombia, Hungary and Mauritius, education
spending grew by more than 25%, yet public
budgets in total grew 17 to 58 percentage
points faster than that.
C O S T S A N D C O M M I T M E N T S I N F I N A N C I N G E D U C A T I O N F O R A L L G L O B A L E D U C A T I O N D I G E S T
2 0 0 7
C O M P A R I N G E D U C A T I O N S T A T I S T I C S A R O U N D T H E W O R L DDoes public education expenditure keep pace with growth in national wealth and changes
in total government expenditure?
Change in available resources and education expenditure from 1999 to 2005
FIGURE 3
Note: All figures are adjusted for inflation. Source: UNESCO Institute for Statistics database.
Investment in primary education
This section has sought to provide a broad
perspective on efforts to fund education
systems in general. It will now examine
investment at the primary level, which is the
focus of several international education goals.
As shown in
Figure 4
, almost one-third of all
education financing worldwide is allocated
to the primary level (PPP$ 741 billion), which
accounts for 1.3% of global GDP (PPP$).
Sub-Saharan Africa invests the greatest share –
2.1% of GDP – at the primary level. This
region is followed by the Arab States and Latin
America and the Caribbean.
At the opposite end of the spectrum, Central
Asia spends just 0.6% of GDP on primary
education. This may be partly due to variation
in the duration of primary schooling – which
is just four years in many of these countries,
while the duration of lower secondary is
longer than in other regions. This can explain
the higher share of expenditure devoted to
secondary rather than the primary level.
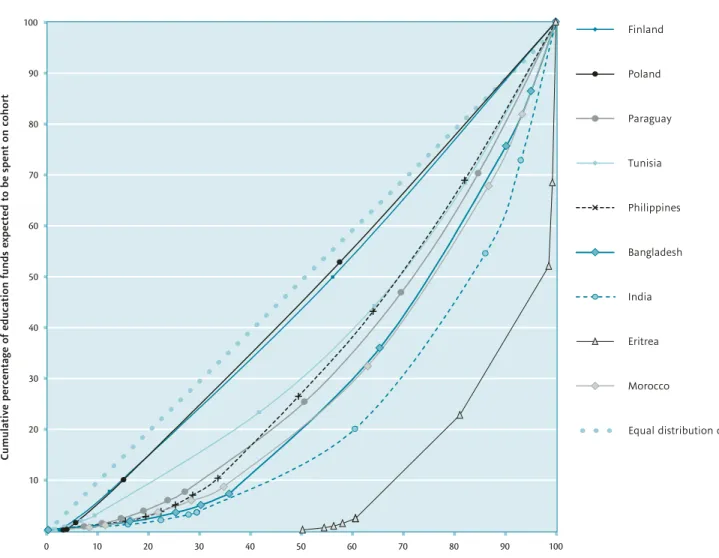
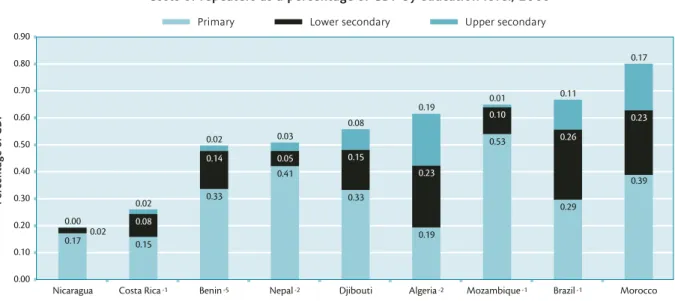
Which countries spend the highest or lowest share of public education expenditure on primary education?
Public expenditure on primary education as a percentage of total public expenditure on education, by country, 2005
How much of regional GDP is spent on primary education?
Global and regional public expenditure on primary and total education as a percentage of GDP (PPP$), 2004
Note: For further information on coverage and reference years, see Table 1. Source: UNESCO Institute for Statistics, Table 1.
��� ��� ��� ��� ��� ��� ��� ��� ��� ��� ��� ��� ���
����� ������� ���� ���� ����
��� ��� �������
����� ��� ���� ����
������� ��� ������� ������
����� ������� ��� ��� ���������
�����������
������ ���� ������ ����� ����������
������� ������
��
�
��
��
��
��
��
��
�
��
�
��
��
��
��
�
��
��
�
��
��
��
��
�
�
��
��
��
�
�
����� �����������������
���
���
���
��� ��� ���
���
���
���
���
��� ���
���
��� ���
���
���
C O S T S A N D C O M M I T M E N T S I N F I N A N C I N G E D U C A T I O N F O R A L L G L O B A L E D U C A T I O N D I G E S T
2 0 0 7
C O M P A R I N G E D U C A T I O N S T A T I S T I C S A R O U N D T H E W O R L DFor a more detailed perspective,
Figure 5
shows expenditure on primary education as a
share of the total education budget by region
for selected countries.
In a number of countries, the share going
towards primary education exceeds 60%
(Burkina Faso, Cambodia, Cameroon,
Dominican Republic and Kenya). This may
refl ect considerable efforts to provide
basic education to relatively large
school-age populations. It may also indicate that
relatively few children and young people
pursue higher levels of education. It may
Which countries spend the highest or lowest share of public education expenditure on primary education?
Public expenditure on primary education as a percentage of total public expenditure on education, by country, 2005
� �� �� �� �� �� �� �� ������� ������� �������� ������� ������� �� ������ �� ������ �� ���� ���� ��� �� � ���� ������ � ���� �� ��� ������� �������� �� ���� �� ����� �� ����������� �� � ������� �� ������� ����� ��� ����� �������� � ��� �������� �� � ����� ������� �� �������� ��������� ���� ������� �� ������� �� ������ �� ������� �� ����� ������ �� �������� �� ������ �� ������ �� ��������� � ���� ����� ���������� �� ������ ����� �� � ������� ������� ���� �� �� � �� �� �� �� � �� �� � �� �� �� �� �� �� � �� �� �� �� �� �� �� �� �� �� �� �� ��� �� �� �� �� �� �� �� � �� �� �� �� �� �� ���� ������ ������� ��� ������� ������ ���� ���� ��� ��� ������� ����� ������� ��� ��� ��������� ��� ������� ����������� ������� ����������� ������
Notes: -1 Data refer to 2004; -2 Data refer to 2003.
Source: UNESCO Institute for Statistics, calculation based on Statistical Table 14.
be the case that the secondary and tertiary
sectors are relatively small and selective
or perhaps more dependent on the private
contributions of students, families and
communities.
In contrast, the share of primary spending
rarely reaches 35% in regions with higher
levels of participation in upper secondary
and tertiary education and in regions with
declining numbers of primary school pupils.
This is notably the case for countries in North
America and Western Europe, as well as in
Central and Eastern Europe.
2. MEASURING THE PUBLIC COSTS
OF PRIMARY EDUCATION
The allocation of public budgets is ultimately
the result of competing demands for limited
resources. Policymakers must constantly seek a
balance in the face of changing contexts: how
much does the school system need and how
much can the government afford to invest?
Countries with rising demand for education are
compelled to keep costs per student low. But
other governments are less constrained by this
demographic pressure and can, therefore, seek
to improve the quality of education provision
more broadly.
To explore these policy choices, this section
will present indicators that refl ect both
perspectives: the cost of educating a student
and the resources (per student) invested in the
education system.
Expenditure per primary student
Public expenditure per student refl ects
the investments and costs associated with
education. It covers the public contributions
to the full range of expenses, including school
construction and maintenance, teacher
salaries, learning materials, as well as loans and
scholarships for tuition and student living costs
(
see
Box 2
).
BOX 2
How is education expenditure defi ned?
UIS data on public education expenditure include the following:
Expenditure on educational institutions
Educational institutions include public and private teaching institutions and
non-teaching institutions, such as ministries, local authorities, curriculum development
or student welfare institutions.
Expenditure includes teacher and staff salaries, as well as pensions and allowances,
school buildings, teaching materials, books, student welfare and administration of
schools. At the tertiary level, expenditure also includes research and development
performed at higher education institutions.
Public subsidies to the private sector
This includes scholarships, grants and loans to domestic students and those abroad
for tuition and living costs. In addition, there are child allowances and special public
subsidies, in cash or in kind, which are contingent upon student enrolment.
Private expenditure
This funding is limited to expenditure on educational institutions and excludes costs
occurring outside institutions (e.g. school uniforms, transport, private tutoring,
student living expenses and opportunity costs).
Capital versus current expenditure
Many researchers and analysts prefer to use current expenditure as the basis for
calculating expenditure per student (UNESCO, 2006). Current expenditure does not
include capital costs, which are generally associated with infrastructure (such as
school construction, maintenance and rental fees). By excluding these costs, current
expenditure better refl ects the actual resources invested in pupils.
However, many countries only report total expenditure that includes capital costs.
Therefore, this is used as the basis for indicators presented in this publication.
All available data on current expenditure are published on the UIS website
(www.uis.unesco.org).
C O S T S A N D C O M M I T M E N T S I N F I N A N C I N G E D U C A T I O N F O R A L L G L O B A L E D U C A T I O N D I G E S T
2 0 0 7
C O M P A R I N G E D U C A T I O N S T A T I S T I C S A R O U N D T H E W O R L DBut how can one compare costs per student
among countries where there are different
currencies and prices? By expressing expenditure
as a percentage of GDP per capita, education
budgets can be compared in relation to national
income level, which is a proxy for a country’s
ability to generate education financing. It is also
possible to directly compare the purchasing
power of the funding provided for education
annually through the use of international PPP$
(
see Box 1
).
Figure 6
shows annual public expenditure per
primary student as a percentage of GDP per
capita for 122 countries with available data.
There are large gaps between countries: 10 to 20
times more resources are allocated per student in
high-spending countries than in those spending
the least in relative terms. From a regional
perspective, Central Asia has the lowest median
of 9%, followed by South and West Asia at 10%
1.
In sub-Saharan Africa, the median expenditure
per primary student was almost 13% of GDP per
capita. But costs across countries in the region
vary by almost a factor of ten: from 4% in the
Congo to 35% in Burkina Faso.
A similar regional median (13%) was found
in the Arab States and Latin America and the
Caribbean. In the first region, expenditure
ranges from 7% in Lebanon and the United Arab
Emirates to 23% in Morocco and even 56% in
Djibouti, which has the highest share of spending
per primary student worldwide. In the second
region, values span from 5% in Guatemala to
38% in Cuba.
The East Asia and the Pacific region has a
median of 15%, with two countries reporting
the lowest spending levels in the world.
Indonesia and Myanmar invest just 3% of per
capita national income annually per primary
student. In contrast, costs are at least five times
higher – ranging from 15% to 22% – in Australia,
Fiji, Hong Kong Special Administrative Region
of China, Japan, Malaysia, New Zealand, the
Republic of Korea and Thailand.
In contrast, countries in North America and
Western Europe tend to spend close to a
regional median of 22%. A similar pattern is
also found in Central and Eastern Europe, where
the median is 17%. Iceland invests the greatest
share per primary student, with 27% of GDP per
capita, followed closely by Cyprus, Denmark,
Italy, Slovenia, Sweden and Switzerland. Even
countries that fall below the median – namely
the Czech Republic, Romania, Slovakia
and Turkey – still make significant annual
investments per primary student of about 12%
to 13% of GDP per capita.
The cost differences among countries tend to
rise with higher levels of education. Annual
public expenditure per secondary student
ranges from 3% to 5% of GDP per capita in
Cameroon, Guatemala, Indonesia, Lao PDR and
Myanmar. In contrast, the costs of educating
a secondary student account for 40% to 50%
of GDP per capita in Botswana, Cyprus, Cuba,
Lesotho and Mozambique. Moreover, Burundi
and Djibouti report the highest relative costs
at 73% and 80% of GDP per capita respectively
(
see Statistical Table 13
).
The gap widens even more dramatically at
the tertiary level. Annual public spending
on a tertiary student ranges from 6% of
GDP per capita in Kazakhstan and 9% in the
Republic of Korea and Peru to 1105% (or more
than 11 times the level of GDP per capita)
in Lesotho.
Yet, low public expenditure does not necessarily
mean that schools or universities are
under-resourced. In many countries, the contributions
of students, families and others are extremely
important, especially at the tertiary level, as the
example of the Republic of Korea shows.
1 Due to limited data coverage at the country level, it is not possible to calculate regional averages. However, the median provides a good indication of
A N D C O M M I T M E N T S I N F I N A N C I N G E D U C A T I O N F O R A L L G L O B A L E D U C A T I O N D I G E S T
2
0
0
7
C O M P A R I N G E D U C A T I O N S T A T I S T I C S A R O U N D T H ERe
la
tiv
e t
o n
at
ion
al G
D
P, h
ow m
uc
h do g
ov
er
n
m
en
ts s
p
en
d p
er p
rim
ar
y s
tude
n
t?
A
n
n
u
al p
u
b
lic e
xp
en
dit
u
re p
er p
rim
ar
y s
tu
d
en
t a
s a p
er
ce
n
ta
ge o
f G
D
P p
er c
ap
ita, 2
0
0
5
F
IG
U
R
E
6
13 .3 16 .6 9.3 14 .6 12 .60 5 10 15 20 25
Fiji-1 Un.ArabEmirates-1 Lebanon Mauritania Algeria-2 Kuwait Jordan-1 Oman-1 Tunisia Morocco Djibouti Turkey-2 Romania-2 Slovakia-1 CzechRepublic-1 Belarus Lithuania-2 Ukraine Moldova Bulgaria-2 Estonia-1 Croatia-2 Latvia-2 Poland-1 Hungary-1 Slovenia-1 Azerbaijan Tajikistan Kazakhstan Mongolia-2 Indonesia-2 Myanmar-2 Cambodia-1 Macao,China-2 LaoPDR Philippines-1 Tonga-1 Malaysia-1 HongKongSARofChina Australia-1 Korea,Rep.-1 NewZealand Thailand Japan-1 Guatemala Peru Uruguay-1 SaintKittsandNevis-1 DominicanRepublic Nicaragua-1 ElSalvador Panama-1 Argentina-1 Grenada-2 Chile Aruba-2 Paraguay-2 Belize-1 Brazil-1 Jamaica SaintLucia Mexico-1 Bolivia-2 CostaRica-1 Guyana Colombia St.Vinc&Grend. Barbados Cuba-1
Percentage of GDP per capita
Re gio n al m ed ia n 12 .8 9.7 21 .8
0 5 10 15 20 25
Ireland-1 Germany-1 Greece-1 France-1 UnitedKingdom-1 Spain-2 Netherlands-1 Finland-1 Belgium-1 Norway-1 Luxembourg-1 UnitedStates-1 Israel-1 Austria-1 Portugal-1 Switzerland-1 Denmark-1 Italy-1 Cyprus-1 Sweden-1 Iceland-1 Bangladesh India-1 Iran Nepal-2 Maldives Congo Zambia Cameroon Chad Gambia-1 Madagascar Uganda-1 Rwanda Eritrea Benin Cent.Afr.Rep. Mauritius Swaziland-1 Ghana Malawi-2 Mozambique-1 SouthAfrica Seychelles-1 Botswana Ethiopia+1 Burundi CapeVerde Namibia-2 Senegal Kenya-1 Lesotho BurkinaFaso
Percentage of GDP per capita
A ra bS ta te s C en tra la nd E as te rn E ur op e Central Asia Ea st A sia a nd th eP ac ific La tin A m er ic aa nd th eC ar ib be an N or th A m er ic aa nd W es te rn E ur op e So ut ha nd W es tA sia Su b-Sa ha ra nA fri ca Ex pe n dit u re p er p rim ar y s tu de n t a s a % o f G D P p er c ap ita 56 38 35 N o te s : + 1 D at a r ef er t o 2 0 0 6
; -1
D at a r ef er t o 2 0 0 4
; -2
C O S T S A N D C O M M I T M E N T S I N F I N A N C I N G E D U C A T I O N F O R A L L G L O B A L E D U C A T I O N D I G E S T
2 0 0 7
C O M P A R I N G E D U C A T I O N S T A T I S T I C S A R O U N D T H E W O R L DAt the other extreme, the cost of educating
a tertiary student is high in Djibouti, where
annual per student investment represents
505% of GDP per capita, followed by
Botswana (480%), Mozambique (435%) and
Rwanda (409%).
It is important to consider that expenditure
may be overstated for countries that subsidise
internationally mobile students. For example,
more than one-half of all tertiary students
go abroad in Belize, Botswana, Gambia and
Lesotho at considerable cost to the state (
see
Statistical Table 10
).
Even when taking into account differences
in national income when comparing
expenditure per student across countries, the
results show that poorer countries tend to
provide substantially less funding per student
than richer countries.
Figure 7
shows the
relationship between annual expenditure per
primary student expressed as a percentage
of GDP per capita and the level of GDP per
capita.
With the exception of the United Arab Emirates,
all countries with a GDP per capita above
PPP$ 10,000 annually spend at least 11% of
GDP per primary student. With the notable
exceptions of Burkina Faso (35%) and Djibouti
(56%), all countries that spend more than
25% of GDP per capita per primary student
are relatively rich with a GDP per capita above
PPP$ 20,000.
Thus, annual spending on primary students in
poorer countries represents a relatively smaller
share of an already low level of GDP per capita.
Figure 7 shows how this double effect amounts
to very high differences in the funds invested in
education across countries.
Purchasing power of education resources
The previous indicator reflects spending
patterns in relative terms, but it is revealing
to also consider the absolute values of these
investments. By converting expenditure per
student into PPP$, it is possible to compare the
purchasing power of these resources in absolute
terms (
see Box 1 and Statistical Table 13
).
For example, Hungary, Kenya, Morocco
and Poland spend about 23% of GDP per
capita annually per primary student. Yet, the
purchasing power of these investments varies
considerably: the same share of resources will
provide PPP$ 250 worth of goods and services
to a student in Kenya, compared to PPP$ 1,010
in Morocco or PPP$ 3,980 in Hungary.
Four countries invest less than PPP$ 100
annually per student: Congo (42), Zambia (56),
Madagascar (76) and Indonesia (89). Purchasing
power per primary student is also extremely
low (ranging from 114 to 147) in Benin,
Burundi, Cambodia, Central African Republic,
Chad, Eritrea, Gambia and Tajikistan.
Developed countries have the highest absolute
levels of education expenditure. Luxembourg
spends the equivalent of PPP$ 15,237 per
primary student, though this is linked to support
for tertiary students who follow programmes
in other countries. Investments in Denmark,
Iceland, Switzerland and the United States range
from PPP$ 8,040 to PPP$ 8,760 annually.
How do rich and poor countries differ in terms of expenditure per student?
Annual public expenditure per primary student as a percentage of GDP per capita
and in PPP$ in relation to GDP per capita, 2005
Notes: The areas between the coloured lines in the chart indicate the different ranges of expenditure per student in PPP$.
+1 Data refer to 2006; -1 Data refer to 2004; -2 Data to 2003; -3 Data refer to 2002.
Sources: UNESCO Institute for Statistics, Statistical Table 13; World Bank, 2006.
C O S T S A N D C O M M I T M E N T S I N F I N A N C I N G E D U C A T I O N F O R A L L G L O B A L E D U C A T I O N D I G E S T