Article
Printed in Brazil - ©2018 Sociedade Brasileira de Química*e-mail: oliveirasantos.oscardeoliveira@gmail.com
Fatty Acid Composition and Carotenoids in Raw and Grilled Tilapia GIFT Fillets
Supplemented with Lycopene,
β
-Carotene and Lutein
Elaine C. Reis,a Marília B. Galuch,a Roberta da Silveira,b Hevelyse M. C. dos Santos,b Cesar Sary,c Thiago F. S. Magon,b Ingrid L. Figueiredo,a Ricardo P. Ribeiro,d
Jesuí V. Visentainera and Oscar O. Santos*,a
aDepartamento de Química, Universidade Estadual de Maringá, Av. Colombo, 5790,
87020-900 Maringá-PR, Brazil
bPrograma Pós-Graduação em Ciência de Alimentos, Universidade Estadual de Maringá,
Av. Colombo, 5790, 87020-900 Maringá-PR, Brazil
cInstituto Federal do Paraná, Av. Araucária, 780, 85860-000 Foz do Iguaçu-PR, Brazil
dDepartamento de Zootecnia, Universidade Estadual de Maringá, Av. Colombo, 5790,
87020-900 Maringá-PR, Brazil
This study evaluated the incorporation of β-carotene, lutein and lycopene into tilapia (genetically improved farmed tilapia, GIFT) fillets supplemented through 0, 20 and 40 days, and their influence on the fatty acid composition and nutritional quality of raw and grilled fillets. A control diet and a diet containing those carotenoids were elaborated with the same lipid source (soybean oil). For carotenoids analysis, the extraction was performed according to the literature, employing acetone and hexane. The relative intensities of m/z ratios of those carotenoids ions were obtained by ultraperformance liquid chromatography-tandem mass spectrometry with chemical ionization at atmospheric pressure (UPLC-APCI MS/MS), and an increase of carotenoid concentration in the supplemented fillets was observed, especially after the grilling process (180 ºC for 15 min). An increase in the concentration of total carotenoids in grilled fillets (75 and 35% higher than raw fillets, for 20 and 40 days of supplementation, respectively, corresponding to 8.32 and 2.42 µg β-carotene g-1 sample) was also
observed. Therefore, the carotenoids promoted the stability of lipid oxidation in grilled samples; fact that can be correlated with antioxidant effect of these compounds, it can be also explained by the breakdown of carotenoids physical barrier and the conditions used in the grilling process. Moreover, acceptable n-6/n-3 indices and recommended polyunsaturated fatty acids/saturated fatty acids (PUFA/ SFA) values were observed in supplemented fillets. Consequently, lutein, β-carotene and lycopene were considered viable as additive on fish diet, since the supplementation promoted the increase of food quality, even after preparation for consumption.
Keywords: genetically improved farmed tilapia, lycopene, lutein, beta-carotene, grilled fish
Introduction
Tilapia (Oreochromis niloticus) is the most cultivated specie in Brazilian aquaculture, with 223% of production’s increase in the last 10 years.1 The GIFT line (genetically
improved farmed tilapia) arose in the 1980s as result of World Fish Center (Pulau Pinang, Malaysia) program revolutionizing the commercial production of this species.2
Tilapia has excellent nutritional properties, with balanced protein composition, essential lipids (mainly
liposoluble), vitamins and minerals,3 and its quality can be
enriched with supplementation provided to the fish through diet, as shown in several studies with different additions (fatty acids, vitamin and antioxidants).4-9
The incorporation of carotenoids into tilapia has been widely studied, since these are naturally present in low quantities in this species.10-14 In general, carotenoids
prevent diseases related to oxidative stress and their antioxidant properties induce a decrease in susceptibility to lipid oxidation of fish meat, avoiding loss of quality.15-17
However, studies evaluating the tilapia nutrients are often performed in raw food and do not provide data related to their post-baking nutritional value. In Brazil, the consumption of raw fish is less common, and this meat is usually prepared using thermal processes (boiling, baking, microwave cooking, grilling and frying in oil), which alter physical and sensorial characteristics (texture, aroma and flavor), as well as the food chemical composition. Grilling is the most used homemade method and has been popularized because of the absence of oil during the food preparation and the lower oxidation of fatty acids.20-23
Liquid chromatography coupled to mass spectrometry (LC-MS) is the most advantageous technique for carotenoid analysis once it provides high sensitivity and selectivity.24
The chemical ionization at atmospheric pressure (APCI) stands out in comparison to the electrospray ionization due to the ability to ionize different groups of carotenoids (xanthophylls and carotenes) in both positive and negative modes.25
Therefore, the objective of this study was to evaluate the incorporation of β-carotene, lutein and lycopene in tilapia GIFT fillets using ultraperformance liquid chromatography-tandem mass spectrometry with chemical ionization at atmospheric pressure (UPLC-APCI MS/MS), as well as to evaluate the grill influence on their nutritional quality and fatty acid composition.
Experimental
Materials
The sources of carotenoids added as feed additives were: β-carotene (100%, CVS/pharmacy, USA); lutein (96% + 4% zeaxanthin, Nature’s Bounty, USA) and lycopene (100%, Radiance, USA).
Experimental diets
Two different diets were elaborated; control diet (CD) and supplemented diet (SD), meeting the nutritional standards for tilapia established by the Brazilian Tilapia Nutrition Tables.26 Base diet was prepared as follows:
ingredients were grounded, mixed and extruded at a feed mill located in the city of Apucarana (Paraná, Brazil). After preparation, part of it was prepared as CD (supplied to fish from control treatment, CT), and part was used as feedstock for SD preparation (supplied to fish from supplementation treatment, ST). Base diet was supplemented with lycopene, lutein and β-carotene solubilized in 50.0 mL of soybean oil and sprinkled on the grains of the CD under constant stirring. Finally, the
CD and SD grains were vacuum packed, protected from light and kept at −18 °C until its usage. The formulation and chemical composition of the experimental diets are presented in Table 1.
The study was developed from September to October 2016 by Universidade Estadual de Maringá (UEM), Chemistry Department, Food Chemistry Laboratory in partnership with Animal Science Department; responsible for the Experimental Fisheries Station (Codapar, Floriano, Paraná, Brazil). A total of 90 GIFT Nile tilapia with initial weight of 78.04 ± 3.21 g were equally divided into 6 hapas. During the first 30 days all fishes were fed with CD to adapt to the new conditions. Then, the first sampling was collected; 3 fish were removed per hapa, and time zero was established; zero days of supplementation, T0. Later, the hapas were divided in two treatments: CT and ST, performed in triplicate. ST animals were feeding with SD. Following 20 and 40 days of supplementation (T20 and T40, respectively) new samplings were acquired; 3 fish were collected per treatment replicate. These animals were sacrificed, weighed and separated: head, fillet, carcass and Table 1. Formulation and chemical composition of experimental diets CD and SD (control and supplemented diet, respectively)
Ingredient Experimental diet
CD SD
Corn bran / % 40.29 40.29
Soybean bran / % 35.00 35.00
Poultry viscera bran / % 5.00 5.00
Blood flour / % 4.00 4.00
Rice bran / % 13.00 13.00
Dicalcium phosphate / % 1.00 1.00
NaCl / % 0.35 0.35
L-Lysine (HCl) / % 0.12 0.12
DL-Methionine / % 0.12 0.12
Choline chloride / % 0.10 0.10
L-Tryptophan / % 0.02 0.02
Soybean oil / % 1.00 1.00
β-Carotene / (mg kg-1) − 3000
Lycopene / (mg kg-1) − ca. 170
Lutein / (mg kg-1) − ca. 100
Proximal compositiona / (g 100 g-1 feed)
Moisture 6.99A ± 0.10 6.46B ± 0.07
Ash 5.42A ± 0.12 5.49A ± 0.037
liver, packed in vacuum polyethylene bags and stored at −18 °C until analysis.
Chemical composition of diets (CD and SD)
Diets moisture, ash and crude protein contents were determined according to AOAC 930.15, 942.05 and 960.52, respectively.27 Diets total lipids content was extracted
according to Bligh and Dyer.28 Carbohydrate values
were estimated by difference, and energetic values were calculated based on conversion factors; carbohydrates 4 kcal g-1 (17 kJ g-1), crude protein 4 kcal g-1 (17 kJ g-1) and
lipids 9 kcal g-1 (37 kJ g-1).29
Total carotenoids concentration
Fresh fillets were frozen at −18 °C and lyophilized for 48 h. The meat powder used to evaluate the carotenoid concentration was obtained by grinding the lyophilized samples in a mill (MA 630, Marconi, Brazil).
Carotenoid content of fillets and feeds was extracted according to Teimouri et al.30 The solutions’ absorptions
were read in triplicate on UV-Vis spectrophotometer (Genesys 10-S, Thermo Fisher Scientific, USA) at wavelength of 450 nm. Calibration curve was obtained using β-carotene (93%, Sigma-Aldrich, Brazil) as standard. Results were expressed as mg of β-carotene per 100 g of sample.
Fatty acid composition
Fatty acids derivatization was performed according to Figueiredo et al.31 Fatty acid methyl esters (FAME)
were separated by gas chromatography on a gas chromatography, TRACE™ Ultra Thermo Scientific™ (Thermo Scientific™, USA) equipped with flame ionization detector (FID) and a fused silica capillary column (100 m × 0.25 mm i.d., 0.25 µm cyanopropyl, CP-7420 select FAME). Injector and detector temperatures were 230 and 250 °C, respectively. Column temperature was maintained at 165 °C for 18 min, programmed at 4 °C min-1 to 235 °C and maintained at this temperature for
20 min. H2 was the carrier gas with a flow of 1.2 mL min-1,
N2 was the auxiliary gas with a flow of 30 mL min-1, FID
flame was produced with H2 (30 mL min-1) and synthetic
air (300 mL min-1). Injected volume was 1.0 µL with split
mode ratio 1/40.31
Retention times and peak areas were determined using Chrom-Quest™ software (Thermo Scientific™, USA). For fatty acids identification, the retention times obtained were compared to methyl esters standards (Sigma, USA) and quantification was performed using tricosanoic acid methyl
ester (Sigma, USA) as internal standard (IS) according to Visentainer.32
Carotenoids extraction
The fillets’ carotenoids were extracted according to Chacón-Ordóñez et al.33
Analysis of β-carotene, lutein and lycopene by UPLC-APCI
MS/MS
An Acquity H-CLASS UPLC (Waters, Milford, MA, USA) chromatography system coupled to a Xevo TQD triple-quadrupole mass spectrometer with APCI ionization source (Waters, Milford, MA, USA) was used. The sample injection volume was 50.00 µL in a flow rate of 0.050 mL min-1, and 100% methanol was used as the
mobile phase.
MS/MS parameters used for the analysis were: corona stream and voltage of 5.4 µA and 3.0 V, respectively; source temperature at 150 °C; cone tension with 35 V; for collision energy a ramp of 25 to 44 eV and gas desolvation temperature of 550 °C was employed. The ionization source (APCI) was set in positive ion mode. Desolvation gas flow rate was set at 250 L h-1. Argon (99.9%) from White Martins
(RJ, Brazil) was used as collision gas at constant pressure of 3.00 × 10⁻³ mbar.
MassLynx and QuanLynx version 4.1 software (Waters) were used for instrument control, data acquisition and processing. The mass spectrometer was operated in MS mode (using MS Scan and Daughters Scan mode). Table 2 summarizes the ions: precursor and product found and according to the literature.24,34
Actual consumption sample-grilling
Tilapia fillets were grilled (Philco jumbo inox, Brazil) with thermostat set at 3. The temperature and cooking duration were established in preliminary tests (cooking temperature of approximately 180 °C and cooking time of Table 2. Selected ion transitions
Component Formula MS scan Daughter scan
β-Carotene C40H56 537.4
457.4; 445.4; 137.1; 177.2
Lutein C40H56O2 569.4
551.4; 477.4; 135.1; 119.1;
175.2
Lycopene C40H56 537.4
457.4; 121.1; 137.1; 177.2;
approx. 15 min). Surface temperatures of fish and grill were recorded with infrared digital thermometer (INCOTERM SCAN TEMP ST-400). The fillets were grilled without the addition of seasonings for nearly 5 min on each side.
Statistical analysis
Data were presented as mean and standard deviation. The Assistat® software v. 7.735 was used for analysis of the
Tukey’s test and Student’s t-test (p < 0.05).
Results and Discussion
Proximal compositions of the experimental CD and SD were evaluated and compared (Table 1) by t-test with 5% significance (p < 0.05), not resulting in statistical difference between the values of ashes, proteins and carbohydrates. Results of total lipids differ statistically, fact explained by the chosen extraction methodology, in which all apolar compounds are extracted, embracing the carotenoids; and for this reason, ST diet presented higher percentage of this constituent. It can be verified on Table 3, which exposes the result for fatty acids in these rations, not showing significant difference. Therefore, diets were isoprotein but not isocaloric.
Total carotenoid values of the treatments tested were also established (Table 1), as expected, the SD presented higher concentrations of carotenoids in comparison to CD. There was no statistical difference between the experimental diets for fatty acids concentration, but it was expected, since the same lipid source (soybean oil) was used in the elaboration of both diets (CD and SD).
Regarding the final animals body weight and weight gain throughout the study period there were no significant differences between the treatments. Data indicated that for both treatments animals reached the same average weight of 132 g. Valente et al.11 and Grassi et al.14 evaluating the
effects of different carotenoid sources in diets for Nile tilapia over 68 and 80 days, respectively, also did not observe alteration in growth performance of supplemented animals. However, differences in the total carotenoid content of fillets were found by these authors.
Total carotenoid concentrations of the raw fillets (Table 4) in the three collection times (0, 20 and 40 days) were compared between each other and between the treatments by t-test with 5% significance (p < 0.05).
The results of raw fillets total carotenoids did not indicate statistical difference as effect of the provided supplementation. These fillets were grilled and the total carotenoid was evaluated once more (Table 5) in order to assess the actual consumption of carotenoids after
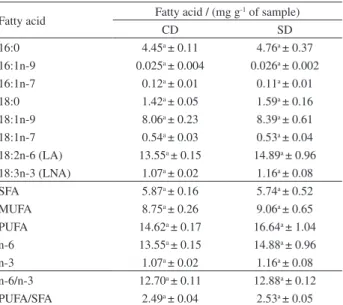
Table 3. Quantification of fatty acids, n-6/n-3 and PUFA/SFA ratios of experimental diets
Fatty acid Fatty acid / (mg g
-1 of sample)
CD SD
16:0 4.45a ± 0.11 4.76a ± 0.37
16:1n-9 0.025a ± 0.004 0.026a ± 0.002
16:1n-7 0.12a ± 0.01 0.11a ± 0.01
18:0 1.42a ± 0.05 1.59a ± 0.16
18:1n-9 8.06a ± 0.23 8.39a ± 0.61
18:1n-7 0.54a ± 0.03 0.53a ± 0.04
18:2n-6 (LA) 13.55a ± 0.15 14.89a ± 0.96 18:3n-3 (LNA) 1.07a ± 0.02 1.16a ± 0.08
SFA 5.87a ± 0.16 5.74a ± 0.52
MUFA 8.75a ± 0.26 9.06a ± 0.65
PUFA 14.62a ± 0.17 16.64a ± 1.04
n-6 13.55a ± 0.15 14.88a ± 0.96
n-3 1.07a ± 0.02 1.16a ± 0.08
n-6/n-3 12.70a ± 0.11 12.88a ± 0.12 PUFA/SFA 2.49a ± 0.04 2.53a ± 0.05 Results expressed as mean ± standard deviation, n = 3; values with different letters in the same row are significantly different (p < 0.05) by t-test; CD: control diet; SD: supplemented diet; LA: linoleic acid; LNA: α-linolenic acid; SFA: total saturated fatty acids; MUFA: total of monounsaturated fatty acids; PUFA: total polyunsaturated fatty acids; n-6: total of omega 6 fatty acids; n-3: total omega-3 fatty acids; n-6/n-3: rate of omega 6/omega 3; MUFA/SFA: total polyunsaturated fatty acids/total saturated fatty acids; PUFA/SFA: total polyunsaturated fatty acids/total saturated fatty acids.
Table 4. Total carotenoids of raw tilapia fillets
Collection time / day Total carotenoids / (µg β-carotene g -1 sample)
CT ST
40 5.77a ± 0.80 6.20a ± 1.53
20 2.08bc ± 0.41 1.38c ± 0.24
0 2.82b ± 0.03 2.22bc ± 0.58
Results expressed as mean ± standard deviation, n = 3; values with different letters are significantly different (p < 0.05) by t-test; CT: control treatment; ST: supplementation treatment.
Table 5. Total carotenoids of grilled tilapia fillets
Collection time / day Total carotenoids / (µg β-carotene g -1 sample)
CT ST
40 2.52bc ± 0.13 8.32a ± 1.91
20 0.84d ± 0.14 2.42bc ± 0.31
0 2.10cd ± 0.29 3.91b ± 0.38
Results expressed as mean ± standard deviation, n = 3; values with different letters are significantly different (p < 0.05) by t-test; CT: control treatment; ST: supplementation treatment.
spinach after heating, had also reported increases of 20-70% in lutein and β-carotene contents from raw leaves to cooked. It is possibly due to the facilitation in the extraction of post-baking carotenoids.
Phan-Thi et al.,37 by monitoring the isomerization
and degradation of β-carotene as effect of heat treatment, verified the conversion of trans-β-carotene (initial form) to cis-β-carotene, after heating, which has greater availability due to its solubility. Thus, carotene would also be easily extracted, and the final carotenoid content would be increased.
Furthermore, Cooperstone et al.38 studied the effects of
thermal processing on lycopene, debated as consequences the bioavailability increase and the isomerization to cis; bioavailable form, as well as the release of lycopene from food matrix; factors that could justify the increase of the total carotenoids of fillets after grilling.
Fatty acid compositions of the raw tilapia fillets compared by Tukey’s test with 5% significance (p < 0.05) between T0, T20 and T40 of CT and ST are set out in Table 6.
Table 6. Quantification of fatty acids, n-6/n-3 and PUFA/SFA ratios of raw tilapia fillets of both treatments tested at different periods of supplementation
Fatty acid
Quantification / (mg g-1 of sample)
CT ST
Collection time / days Collection time / days
0 20 40 0 20 40
A total of 26 fatty acids were found in raw tilapia fillets at different CT and ST times. Among saturated fatty acids (SFA), the highest concentration was palmitic acid; monounsaturated fatty acids (MUFA), oleic acid and polyunsaturated fatty acids (PUFA), α-linolenic acid (LNA). LNA concentrations, according to the statistical test, differed between the treatments, with T20 and T40 of ST presenting the highest LNA values (0.256 and 0.124 mg g-1
of sample, respectively). As result, supplemented T20 fillets were the only ones resulting in n-6/n-3 rates within the range recommended by Simopoulos39 which indicated
doses between 1/1 and 4/1 for prevention of chronic and inflammatory diseases, while other treatments slightly exceeded this proportion. Regarding the recommended PUFA/SFA rates, all fillets presented ratio higher than the minimum recommended by the Department of Health and Social Security of 0.45.10 MUFA/SFA values obtained for
ST were statistically the same compared to CT; excepted ST T20, in which the value was higher (1.14 mg g-1 of sample).
In relation to the long-chain polyunsaturated essential fatty acid levels: arachidonic acid (AA: 20:4n-6), eicosapentaenoic acid (EPA: 20:5n-3) and docosahexaenoic acid (DHA: 22:6n-3), ST T20 and T40 presented statistical difference in comparison to CT for AA and EPA levels, and ST T20 fillets were also higher for DHA levels. The increase in EPA and DHA concentrations in ST T20 fillets can be attributed to the higher α-linolenic acid concentration (precursor of the n-3 fatty acid series). Higher levels of PUFAs are associated with the presence of carotenoids, which are responsible for providing greater nutritional value to fillets and for neutralizing free radicals during storage, before oxidation of these fatty acids in the cell membrane.
Navarro et al.4 supplemented tilapia with vitamin E
and had also attributed the increase of PUFAs in carcasses to the antioxidant activity of the compound incorporated through diet. Besides, other authors obtained the same results evaluating the effects of oxidation on different parts of tilapia supplemented with carotenoids through analysis of the effects of storage, effect of response to environmental stress, fillet rancidity and lipid content.10,12,14 Moreover,
all cited authors above also verified the levels of the incorporated compounds increasing, although the activity of protection against oxidation of other molecules leads to the degradation of the carotenoid molecule.41
ST fillets after grilling were evaluated according to their fatty acid compositions and compared to the same raw fillets by Tukey’s test with 5% significance (p < 0.05) between T0, T20 and T40, these results are presented in Table 7.
The same 26 fatty acids found in the raw fillets were determined in the grilled fillets. Major fatty acids in each class also remained the same (palmitic, oleic and linoleic
acid). After cooking, T40 fillets presented higher linoleic acid (LA) content, previously equal by statistical test for all collection times, as no lipid source was used in the process, this inversion, observed only for longer time of supplementation, could be related to the breakdown of physical barrier of the incorporated carotenoids (cell wall and chromoplasts) due to thermal processing, which results in the elevation of the carotenoid content and its bioavailability from which these molecules can exert their activity protection against PUFA oxidation, in this case, promoted by the high grill temperatures.42,43
The protective effect of carotenoids may also be responsible for maintaining α-linolenic acid concentrations in grilled T40 fillets, against oxidation resulting from the heating temperature. The increase in n-6 levels in this case leads to an increase in n-6/n-3 ratio. As regards the T20 grilled fillets, a decrease in LNA concentration was observed compared to the raw fillets, as consequence, the T20 grilled fillets presented a higher n-6/n-3 ratio. Therefore, all collection times exceeded the recommended value moderately (n-6/n-3 equal 1/1 to 4/1).39 The same
factors that altered n-6/n-3 relations were responsible for the decrease in the MUFA/SFA rate of T20 grilled fillets, for T40 the proportion remained unchanged by the statistical test, and all times met the recommended minimum of 0.45.44
The results exposed that the fatty acids contents were maintained, which can be correlated to the conditions used in the grilling process (temperature and cooking time) and the antioxidant effect of the supplemented carotenoids.
Phan-Thi et al.,37 in their study on the antioxidant
capacity of β-carotene, clarifies that the antioxidant location between hydrophilic and hydrophobic phases of the cell membrane could reduce the oxidizing effect. β-Carotene, due to its size and hydrophobic character, is located inside the membrane bilayer, affecting its fluidity and providing protective effect against lipid peroxidation and lipid protein damage. Lycopene, as an isomer and the possessor of these properties, would probably performs as it, contributing to the maintenance of the fatty acids contents of grilled fillets.
UPLC-APCI MS/MS
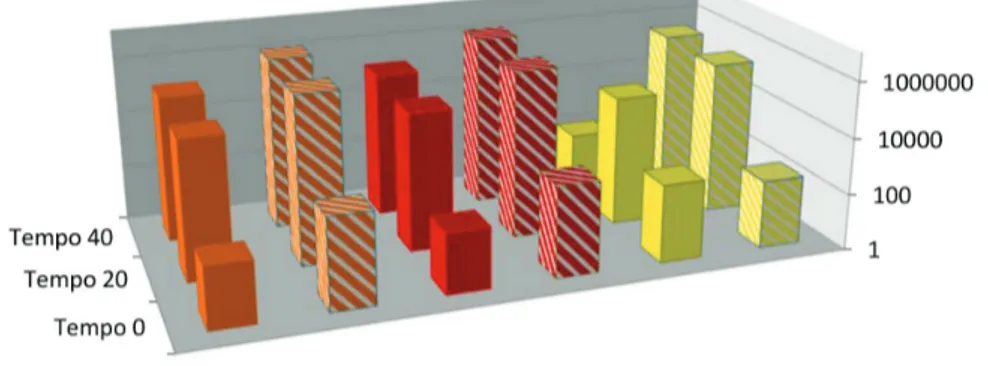
In data processing, blank spectrum was subtracted from sample spectrum, generating centroids. The selected ions: β-carotene, lycopene (537.4 m/z) and lutein (569.4 m/z) (Table 2) had their intensities compared between treatments and between times of supplementation in order to verify its incorporation. Results are presented in Figure 1.
fillets. The increase is attributed to the incorporation of carotenoids from the enriched diets by supplemented tilapia. Supplemented grilled fillets were also evaluated and the intensities were compared with raw fillets. Results are shown in Figure 2.
Results observed in Figure 2 are in accordance to the standard found for the total carotenoid values of raw and grilled fillets. The increase in the relative intensities after grilling is probably due to the same reasons mentioned for the total carotenoids. Moreover, it can also be caused by Table 7. Quantification of fatty acids, n-6/n-3 and PUFA/SFA ratios of ST, raw and grilled tilapia fillets at different periods of supplementation
Fatty acid
Quantification / (mg g-1 of sample)
ST raw fillets ST grilled fillets
Collection time / days Collection time / days
0 20 40 0 20 40
the rupture of the cell wall and the chromoplasts, where the carotenes are located, in response to thermal processing, thus breaking the physical barrier and increasing the carotenoid content, as well as its bioavailability.42,43
Conclusions
Tilapia GIFT supplemented with carotenoids, β-carotene, lutein and lycopene was able to incorporate the compounds, produce satisfactory n-6/n-3 indices and recommended PUFA/SFA values. Also, after grilling the supplemented fillets was possible to observe an effect against lipid oxidation, resulting in the preservation of essential fatty acid indices. At the same time, the total carotenoid contents of the fillets were improved through cooking. Hence, supplementation was effective in endorsing the food quality, even after preparation for consumption, being considered viable as an additive in tilapia feeding.
Acknowledgments
The authors are grateful to CAPES and CNPq for the financial support and research grants.
References
1. Instituto Brasileiro de Geografia e Estatística (IBGE); Produção da Pecuária Municipal, vol. 43; IBGE: Rio de Janeiro, 2015, p. 1-49.
2. Empresa Brasileira de Pesquisa Agropecuária (Embrapa);
Gerenciamento Genético da Tilápia nos Cultivos Comerciais; Embrapa Pesca e Aquicultura: Palmas, 2015.
3. Hernández-Sánchez, F.; Aguilera-Morales, M. E.; REDVET - Rev. Electrón. Vet.2012, 13, 1. Available at http://www. veterinaria.org/revistas/redvet/n060612/061205.pdf, accessed in March 2018.
4. Navarro, R. D.; Navarro, F. K. S. P.; Ribeiro Filho, O. P.; Ferreira, W. M.; Pereira, M. M.; Seixas Filho, J. T.; Food Chem.
2012, 134, 215.
5. Bonafé, E. G.; de Figueiredo, L. C.; Martins, A. F.; Monteiro, J. P.; Junior, O. O.; Canesin, E. A.; Maruyama, S. A.; Visentainer, J. V.; J. Sci. Food Agric.2017, 97, 3469.
6. Carbonera, F.; Montanher, P. F.; Figueiredo, I. L.; Bonafé, E. G.; Santos Jr., O. O.; Sargi, S. C.; Gonçalves, R. M.; Matsushita, M.; Visentainer, J. V.; J. Am. Oil Chem. Soc.2016, 93, 1255. 7. Montanher, P. F.; Silva, B. C. E.; Bonafé, E. G.; Carbonera,
F.; dos Santos, H. M. C.; Figueiredo, I. D.; Maruyama, S. A.; Figure 1. Comparison of the relative intensities of 537.4 and 569.4 ions among the raw fillets of the treatments: control (CT) and supplementation (ST).
Matsushita, M.; Visentainer, J. V.; Eur. J. Lipid Sci. Technol.
2016, 118, 698.
8. Lopes, A. P.; Schneider, V. V. A.; Montanher, P. F.; Figueiredo, I. L.; Santos, H. M. C.; Maruyama, S. A.; Araújo, A. M. M.; Visentainer, J. V.; J. Braz. Chem. Soc.2015, 26, 572.
9. Carbonera, F.; Montanher, P. F.; Palombini, S. V.; Maruyama, S. A.; Claus, T.; Santos, H. M. C.; Sargi, S. C.; Matsushita, M.; Visentainer, J. V.; J. Braz. Chem. Soc.2014, 25, 1237. 10. Arous, W. H.; El-Bermawi, N. M.; Shaltout, O. E.; Essa, M. A.
E.; Middle East Tech. Univ. J. Pure Appl. Sci.2014, 4, 988. 11. Valente, L. M. P.; Araújo, M.; Batista, S.; Peixoto, M. J.;
Sousa-Pinto, I.; Brotas, V.; Cunha, L. M.; Rema, P.; J. Appl. Phycol.
2016, 28, 691.
12. Santo, E. F. E.; Grassi, T. L. M.; Marcos, M. T. S.; Oliveira, D. L.; Cavazzan, J. F.; Ciarlini, P. C.; Narciso, L. G.; Torres, A. A.; Gonçalves, G. S.; Abimorad, E. G.; Ponsano, E. H. G.;
Arq. Bras. Med. Vet. Zootec.2016, 68, 525. 13. Chiu, K.; Liu, W.; Aquaculture2014, 418-419, 32.
14. Grassi, T. L. M.; Santo, E. F. E.; Marcos, M. T. S.; Cavazzana, J. F.; Oliveira, D. L.; Bossolani, I. L. C.; Ponsano, E. H. G.;
Aquacult. Int.2016, 24, 647.
15. Meleiro, V. C.; Nascimento, K. O.; Barbosa Jr., J. L.; Saldanha, T.; Barbosa, M. I. M. J.; Int. Food Res. J.2016, 23, 543. 16. Costa-Rodrigues, J.; Pinho, O.; Monteiro, P. R. R.; Food Chem.
2018, 245, 1148.
17. Sarialtin, S. Y.; Coban, T.; Rec. Nat. Prod.2018, 2, 107. 18. Chew, E. Y.; Clemons, T. E.; Sangiovanni, J. P.; Danis, R. P.;
Ferris, F. L.; Elman, M. J.; Antoszyk, A. N.; Ruby, A. J.; Orth, D.; Bressler, S. B.; Fish, G. E.; Hubbard, G. B.; Klein, M. L.; Chandra, S. R.; Blodi, B.; Domalpally, A.; Friberg, T.; Wong, W. T.; Rosenfeld, P. J.; Agrón, E.; Toth, C. A.; Bernstein, P. S.; Sperduto, R. D.; JAMA Ophthalmol.2014, 132, 142. 19. Rowles, J. L. I.; Ranard, K. M.; Smith, J. W.; An, R.; Erdman,
J. W. J.; Prostate Cancer Prostatic Dis.2017, 1.
20. Weber, J.; Bochi, V. C.; Ribeiro, C. P.; Victório, A. M.; Emanuelli, T.; Food Chem.2008, 106, 140.
21. Yu, L. C.; Zzaman, W.; Akanda, M. J. H.; Yang, T. A.; Easa, A. M.; Turk. J. Fish. Aquat. Sci.2017, 17, 935.
22. Cheung, L. K. Y.; Tomita, H.; Takemori, T.; J. Food Sci.2016, 1. 23. Bi, J.; Li, Y.; Wang, H.; Song, Y.; Cong, S.; Li, D.; Zhou, D.;
Zhu, B.-W.; Tan, M.; New J. Chem.2017, 41, 8490.
24. van Breemen, R. B.; Dong, L.; Pajkovic, N. D.; Int. J. Mass Spectrom.2012, 312, 163.
25. Rivera, S. M.; Canela-Garayoa, R.; J. Chromatogr. A2012,
1224, 1.
26. Furuya, W. M.; Tabelas Brasileiras para a Nutrição de Tilápias, 21a ed.; GFM: Toledo, 2010.
27. Association of Official Analytical Chemists (AOAC); Official Methods of Analysis 930.15, 942.05 and 960.52, 15th ed.; AOAC:
Arlington, 1990.
28. Bligh, E. G.; Dyer, W. J.; Can. J. Biochem. Physiol.1959, 37, 911.
29. Agência Nacional de Vigilância Sanitária (ANVISA); Resolução No. 40, de 21 de Março de 2001; Regulamento Técnico para Rotulagem Nutricional Obrigatória de Alimentos e Bebidas Embalados; Diário Oficial da União, Brasília, 2001.
30. Teimouri, M.; Amirkolaie, A. K.; Yeganeh, S.; Aquaculture
2013, 396-399, 14.
31. Figueiredo, I. L.; Claus, T.; Oliveira, O. S. J.; Almeida, V. C.; Magon, T.; Visentainer, J. V.; J. Chromatogr. A2016, 1456, 235. 32. Visentainer, J. V.; Quim. Nova2012, 35, 274.
33. Chacón-Ordóñez, T.; Esquivel, P.; Jiménez, V. M.; Carle, R.; Schweiggert, R. M.; J. Agric. Food Chem.2016, 64, 1989. 34. Cano, M. P.; Gómez-Maqueo, A.; García-Cayuela, T.;
Welti-Chanes, J.; Food Chem.2017, 237, 612.
35. Francisco, A. S. S.; Carlos, A. V. A.; Afr. J. Agric. Res.2016,
11, 3733.
36. Eriksen, J. N.; Luu, A. Y.; Dragsted, L. O.; Arrigoni, E.; Food Chem.2016, 203, 23.
37. Phan-Thi, H.; Durand, P.; Prost, M.; Prost, E.; Waché, Y.; Food Chem.2016, 190, 1137.
38. Cooperstone, J. L.; Francis, D. M.; Schwartz, S. J.; Food Chem.
2016, 210, 466.
39. Simopoulos, A. P.; Biomed. Pharmacother.2002, 56, 365. 40. Department of Health and Social Security; Committee on
Medical Aspects of Food Policy; Report on Health and Social Subjects, Diet and Cardiovascular Disease, vol. 28; HMSO: London, 1984.
41. Guerin, M.; Huntley, M. E.; Olaizola, M.; Trends Biotechnol.
2003, 21, 210.
42. Palmero, P.; Lemmens, L.; Hendrickx, M.; van Loey, A.; Food Chem.2014, 157, 275.
43. Phinney, D. M.; Frelka, J. C.; Cooperstone, J. L.; Schwartz, S. J.; Heldman, D. R.; Food Chem.2017, 215, 354.
44. Özogul, Y.; Özogul, F.; Food Chem.2007, 100, 1634.
Submitted: December 14, 2017 Published online: March 13, 2018