Article
J. Braz. Chem. Soc., Vol. 25, No. 8, 1431-1438, 2014. Printed in Brazil - ©2014 Sociedade Brasileira de Química 0103 - 5053 $6.00+0.00
A
*e-mail: [email protected]
Influence of Ripening Stages of Tomatoes in the Analysis of Pesticides by Gas
Chromatography
Flaviane A. de Sousa,a Antônio A. Neves,*,a Maria Eliana L. R. de Queiroz,a Fernanda F. Heleno,a Reinaldo F. Teófiloa and Gevany P. de Pinhob
aDepartamento de Química, Universidade Federal de Viçosa, 36570-000 Viçosa-MG, Brazil
bInstituto de Ciências Agrárias, Universidade Federal de Minas Gerais,
39404-006 Montes Claros-MG, Brazil
Parâmetros de maturação de frutos de tomate como pH, °Brix, acidez e teores de licopeno e β-caroteno foram avaliados. Cinco agrotóxicos foram quantificados em extratos orgânicos de tomate em diferentes fases de maturação. A técnica de extração sólido-líquido com partição em baixa temperatura (ESL-PBT) foi utilizada para a obtenção desses extratos orgânicos. O efeito da matriz tomate foi calculado a partir dos resultados da análise por cromatografia gasosa com detector de captura de elétrons (CG-DCE). Correlações entre os parâmetros de maturação e efeito matriz foram estudadas. A correlação entre o teor de carotenoides e o efeito matriz foi elevada para todos os pesticidas estudados. Os resultados indicam que o efeito produzido pela matriz tomate está correlacionada com a presença de licopeno e β-caroteno em extratos orgânicos. A análise de componentes principais (PCA) mostrou que o licopeno, caroteno e a mistura de ambos têm efeitos significativos sobre a resposta cromatográfica de pesticidas.
Some parameters of tomato fruits ripening such as color, pH, °Brix, acidity and lycopene and
β-carotene content were evaluated during the ripening of fruits. Five pesticides were quantified in organic extracts derived from tomatoes at different stages of maturation. The solid-liquid extraction technique with partition at low temperature (SLE-PLT) was used to obtain these organic extracts. The matrix effect of tomato was calculated from the results of analysis by gas chromatography with electron capture detector (GC-ECD). Correlations between maturation parameters and matrix effect were performed. The correlation between the content of carotenoids and matrix effect was high for all pesticides studied. The results indicate that the effect produced by the tomato matrix is correlated with the presence of lycopene and β-carotene in organic extracts. The principal component analysis (PCA) showed that lycopene, carotene and the mixture of both have significant effects on the chromatographic response of pesticides, separating them into distinct groups.
Keywords: matrix effect, tomato, GC-ECD, PCA
Introduction
The tomato (Lycopersiconesculentum Mill) is one of
the vegetable with a large market in Brazil and is much appreciated for its high nutritional value. It is rich in vitamin A and C, phosphate and potassium, besides presenting
about 95% of water in its composition.1
Tomato production in Brazil is approximately three
million tons per year. Sixty-five percent of this production
is destined for fresh consumption and 35% for industrial
processing.2 Tomato fruits are highly susceptible to pests
so, in order to avoid crop losses, a lot of different pesticides
are used to control these pests.3 The successive application
of pesticides and non-observance of grace periods thereof make herbicide residues remain in the fruits after harvest. Then, it becomes necessary to analyze pesticide residues in these fruits to ensure the quality of the food being consumed.
The analysis of trace organic contaminants in foods typically consists of the following consecutive steps:
(i) extraction of analytes from the sample, (ii) removal of
co-extractives from crude extract and (iii) identification and
quantification of target analytes.4 The gas chromatography
of pesticides in different foods and environmental matrices. During chromatographic analysis, the matrix components contained in the organic extracts may influence the quantification of analytes of interest generating inconclusive
results.5 The change in the chromatographic response due to
the presence of co-extractives is named matrix effect. The matrix effect is observed when a considerable difference of response is obtained between standards prepared in the
solvent and those prepared in the matrix extract.6
In samples of tomato the chemical composition of the matrix extracts varies according to the stage of the fruits ripening and the extraction method used. The green color of unripe tomato fruits is due to the presence of chlorophyll. With the onset of maturation, occur the degradation of chlorophyll and the synthesis of yellow
pigments, especially β-carotene and xanthophylls. The
reddish color is characteristic of ripe fruit, due to the accumulation of lycopene. The colors of the tomato species differ from yellow to orange red depending on
the ratio lycopene/β-carotene the fruit has.7 The sugar
and organic acid content also varies during maturation. Sugars (sucrose and fructose) constitute about 65% of total soluble solids and accumulate in the final stage of
fruit ripening.1
The presence of tomato co-extractives in the organic extracts obtained in the solid-liquid extraction with partitioning at low temperature (SLE-PLT) cause significant effects on the chromatographic response of pesticides
analyzed by GC.8-10 In this study, it was attempted to
correlate the observed matrix effect in analysis of five pesticides with certain physicochemical properties of the tomato. Some parameters of tomato fruit ripening such
as color, pH, oBrix, acidity and lycopene and β-carotene
content were evaluated during the ripening of fruits. These data were correlated with the observed matrix effect on the analysis of five pesticides by gas chromatography with electron capture detector (GC-ECD).
Experimental
Samples
Samples of unripe hydroponic tomato of the salad kind, free of pesticides, were acquired in the market of Viçosa-MG and stored at room temperature during the ripening process.
The samples were classified into five stages of
maturation during the storage period. (1) Pinkish green:
between 0% and 10% of the whole surface with reddish or yellowish color; (2) greenish pink: between 10% and 30% of the whole surface with reddish, pinkish or yellowish
color; (3)pinkish: between 30% and 60% of the whole
surface with reddish or pinkish color; (4)light red: between
60% and 90% of the whole surface having reddish pink or red and (5) red: more than 90% of the fruit surface having
intense red coloration.2
Characterization of tomato samples
The tomato color was measured with colorimeter
“Tristimulus” Minolta® (Ramsey, USA) model CR-400
(illuminant C and 10° viewing angle and color space CIELAB) with direct reading of reflectance of the coordinates “L*” (luminosity), “a*” (green to red) and “b*” (yellow to blue). Four readings were made at the middle
region of the fruits in the longitudinal direction.11
The acidity was determined by titration of the pulp
with standardized solution of NaOH 1.00 × 10⁻¹ mol L-1
and 3 drops of phenolphthalein indicator.12
The pH measurement was performed by direct immersion of the electrode in the tomato pulp, according
to the Instituto Adolfo Lutz method.12 The determination
of the pH of the pulp was performed using digital benchtop
pH meter Homis® (São Paulo, Brazil), model MPA 210.
The soluble solids content of the pulp of tomatoes was determined by a manual refractometer model 107-0 to
90% BRIX-Biobrix® (São Paulo, Brazil), according to the
Instituto Adolfo Lutz method.12 The results were expressed
as °Brix.
The level of lycopene and β-carotene were estimated
spectrophotometrically and expressed as level of lycopene.
Standard solutions
Standard lycopene was obtained from tomato samples in advanced ripening stage according to the method
proposed by Nunes and Mercadante.13 The obtained crystals
(75% m/m)14 were solubilized in petroleum ether and
analyzed by GBC Cintra 20 spectrophotometer (Homney,
WV, USA) at a wavelength of 470 nm.2
The solution of β-carotene was prepared by dissolving
Sigma standard (Seelze, Germany) in methanol at a
concentration of 600 mg L-1. A solution at a concentration
of 10 mg L-1 was prepared by diluting in acetonitrile.
Stock standard solutions of chlorothalonil (99.3% m/m), iprodione (99.3% m/m) and deltamethrin (99.7% m/m), purchased from Sigma Aldrich (Seelze, Germany); chlorpyrifos (99.0% m/m), purchased from Chem Service (West Chester, USA) and permethrin (92.2% m/m) acquired from Syngenta (São Paulo, Brazil) were prepared in
acetonitrile at a concentration of 1000 mg L-1 and stored at
prepared containing five pesticides at concentrations of
10 mg L-1 in the same solvent.
Obtaining matrix extracts
The organic extracts from tomato samples in each stage of maturity were obtained from the technique of solid-liquid extraction with partition at low temperature
(SLE-PLT).8 Thus, 4.00 g of crushed tomato samples
were transferred to a 22 mL vial and added to an extracting mixture comprising 0.5 mL of water, 6.5 mL of acetonitrile and 1.5 mL of ethyl acetate. The system was
homogenized and allowed to stand in a freezer at −18 °C
for 6 h. The organic liquid phase was passed through 1.5 g of sodium sulfate and collected into a 10 mL volumetric flask with acetonitrile. The extracts were stored at 4 °C until the time of analysis by gas chromatography and spectrophotometry.
Quantification of pigments in the matrix extracts
The quantifications of lycopene and β-carotene in
matrix extracts, in several stages of maturation, were performed in spectrophotometer with wavelength of
470 nm.2 Analytical curves were obtained at concentrations
between 0.25 and 2.5 mg L-1 in acetonitrile. Concentrations
of two carotenoids in tomatoes organic extracts were calculated by linear regression equation obtained from the analytical curve and were expressed in terms of the concentration of lycopene.
Analysis by GC-ECD
A gas chromatograph Shimadzu (Kyoto, Japan) model GC-2014 equipped with an electron capture detector (ECD), auto injector AOC-20i was used for analyzes. The chromatographic separation of the analytes was performed on a HP-5 capillary column from Agilent Technologies (Palo Alto, USA) with a stationary phase consisting of 5% diphenyl and 95% dimethyl siloxane (30 m × 0.25 mm d.i., 0.1 µm film thick), and nitrogen (Air Products, São Paulo, Brazil) with 99.999% of
purity as the carrier gas at a flow rate of 1.2 mL min-1.
The programming of the oven temperature was 150 °C
(2 min), heated at 40 °C min-1 to 210 °C (1 min), then
again heated at 40 °C min-1 to 260 °C (1 min). Finally the
temperature was raised at 30 °C min-1 to 290 °C (5 min).
The temperatures of the split/splitless injector and detector were 280 and 300 °C respectively. It was injected 1.0 µL of the sample into the chromatograph at a split ratio of 1:5. The total analysis time was 12.75 min.
Matrix effect
Effect of the components of tomato
Standard solutions containing the five pesticides in the
concentration of 100 µg L-1 in acetonitrile and in organic
extracts of the matrix were analyzed by GC-ECD. The five organic extracts used were obtained from the SLE-PLT of tomato samples at different stages of maturation. The areas obtained for the analytes in pure solvent were related to areas obtained from the same compounds in organic extract of the matrices using equation 1:
(1)
where X1 is the average of the areas of the pesticide
prepared in extract of the matrix and X2 is the average of
the areas of the pesticide prepared in pure solvent.
Effect of lycopene and β-carotene
In order to evaluate the influence of lycopene and
β-carotene in the chromatographic responses of the
pesticides, to the standard solutions containing the five
pesticides at concentrations of 100, 300 and 500 µg L-1
were added solutions of lycopene, β-carotene and mixtures
of both pigments in concentrations of 0.5, 1.0, 2.0, 3.0 and
4.0 mg L-1. These concentrations were chosen based on
the concentration of carotenoids found in fruits of tomato,
which was approximately 2.0 mg L-1. The percentage of
matrix effect was calculated by equation 1. The results were explored using principal component analysis.
Principal component analysis
The principal component analysis was performed in order to find patterns in distributions of the five pesticides
and to verify the effect of lycopene, β-carotene and mixtures
of these two carotenoids on each pesticide with the purpose to extract relevant information about this system.
A 15 × 15 matrix was built for the multivariate treatment of data. The five pesticides in three concentrations (100, 300
e 500 µg L-1) were defined as samples and were therefore
placed in the rows. Lycopene, β-carotene and mixtures
of these two carotenoids were defined as variables and therefore were placed in columns. The response used as information of the matrix effect was calculated by equation 1.
Results and Discussion
Quantification of pigments in the matrix extracts
Previous works have shown the influence of the tomato components in chromatographic responses of the pesticides
during the analysis by GC.9,10 Pigments are among the
major components of the tomato. These pigments, when present in the organic extract, can be deposited into the chromatographic system during the injections or, depending on the conditions of analysis, can be decomposed in the injector forming volatile compounds.15 The estimate of the
amount of pigments in the extracts obtained from samples of tomato was performed by UV-Visible spectrophotometry. Absorption spectra of standard solutions of lycopene and
β-carotene were obtained in the range 380-600 nm. Figure 1 shows these spectra.
The levels of these carotenoids in tomato organic extracts, expressed in mg L-1 of lycopene were 0.79, 1.56,
1.60, 2.01 and 2.07 for the stages pinkish green, greenish pink, pinkish, light red and red, respectively (see Table 1).
The levels of these carotenoids present in organic
extracts confirm the assessment of the maturation stages
performed by the relationship of color (a*/b*). The main information acquired is that as the fruit matures, the
concentrations of lycopene and β-carotene increase in
organic extracts obtained by the technique SLE-PLT, as expected.
Characterization of tomato samples
From tomato fruits at each stage of maturation, it was obtained soluble solids data (ºBrix), pH, total titratable acidity and color parameter (a*/b*). Table 1 presents the mean of three replicates obtained for these parameters.
Statistically, by Tukey’s test (p < 0.05) it was not observed
changes in the values of °Brix, pH and total titratable acidity during the period of fruit maturation. Similar results were
found in the literature for these parameters.16-19 The relations
a*/b* and (a*/b*)2 have been commonly used as an index
of fruit maturation and present high correlation with the
different foreseen maturation stages.11
Analysis by GC-DCE
The chromatographic conditions optimized for simultaneous analysis of the five pesticides allowed a good separation of compounds as can be seen in the chromatogram presented in Figure 2A. The retention time of peaks for each compound was used for identification in the organic extract of tomato. Quantitation of the compounds permethrin and deltamethrin that have more than one peak was performed
by summing the areas of the peaks.20
It is observed that the presence of tomato co-extractives causes changes in the baseline of the chromatograms and the responses of pesticides are also changed (Figure 2B). However, no interference peak was detected with the same retention time of the pesticides.
Matrix effect
Table 2 shows the chemical structure of the five pesticides studied. In previous work it was observed the influence of Figure 1. Absorption spectra of lycopene standard solution (–––) and
β-carotene (---) at a concentration of 1.0 mg L-1.
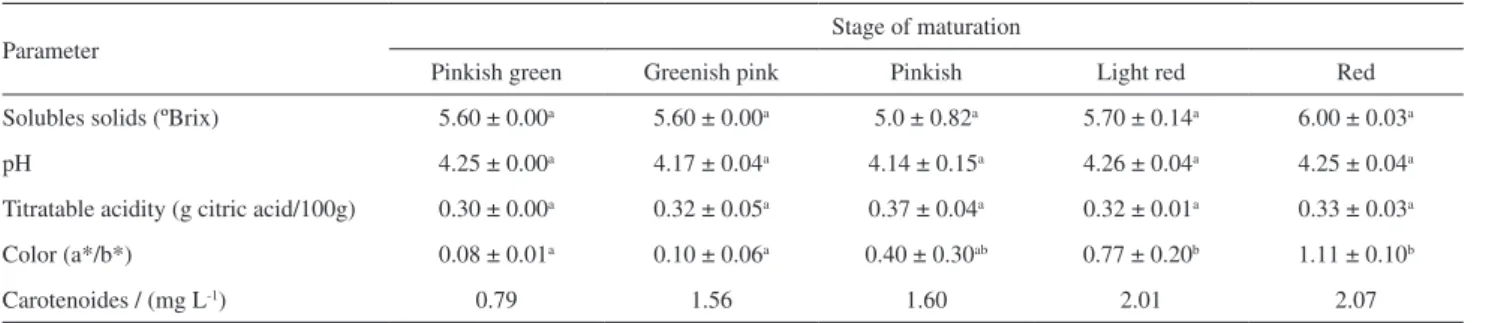
Table 1. Characterization of tomato fruits throughout maturation
Parameter
Stage of maturation
Pinkish green Greenish pink Pinkish Light red Red
Solubles solids (ºBrix) 5.60 ± 0.00a 5.60 ± 0.00a 5.0 ± 0.82a 5.70 ± 0.14a 6.00 ± 0.03a
pH 4.25 ± 0.00a 4.17 ± 0.04a 4.14 ± 0.15a 4.26 ± 0.04a 4.25 ± 0.04a
Titratable acidity (g citric acid/100g) 0.30 ± 0.00a 0.32 ± 0.05a 0.37 ± 0.04a 0.32 ± 0.01a 0.33 ± 0.03a
Color (a*/b*) 0.08 ± 0.01a 0.10 ± 0.06a 0.40 ± 0.30ab 0.77 ± 0.20b 1.11 ± 0.10b
Carotenoides / (mg L-1) 0.79 1.56 1.60 2.01 2.07
However, a systematic analysis of the influence of different stages of ripening of the fruit has not been reported in the literature.
The percentages of matrix effect were evaluated on the difference of the five pesticides responses when analyzed in pure solvent (acetonitrile) and in tomatoes organic extracts at different stages of maturation. The results are shown in Figure 3.
It was observed that for the pesticides chlorothalonil (Figure 3A), iprodione (Figure 3B) and deltamethrin (Figure 3C) there is a positive matrix effect for almost all stages of Figure 2. Chromatogram of a standard solution of pesticides in
acetonitrile (A) and in the organic extract of tomato (B) at a concentration of 100 µg L-1, where: 1: clorothalonil; 2: chlorpyrifos; 3: iprodione;
4: permethrin and 5: deltamethrin.
Table 2. Chemical structure of pesticides
Compound Formula
Chlorothalonil
Chlorpyrifos
Iprodione
Permethrin
Deltamethrin
Figure 3. Matrix effects for pesticides at 100 µg L-1 in different stages
of maturation, where: pinkish green (1); greenish pink (2); pinkish (3); light red (4) and red (5).
different matrix components in chromatographic response
maturation. For the pesticides chlorpyrifos (Figure 3A), iprodione and permethrin (Figure 3B), the matrix effect over the period of maturation were statistically identical.
For the pesticides deltamethrin and chlorothalonil it was observed significant changes in the matrix effect due to the maturation stage. These results suggest that the matrix effect shown by the two pesticides has a correlation with the color of the fruit.
The matrix effect data calculated for each pesticide according to the maturation stage were correlated with the values of ºBrix, total titratable acidity, pH, color and carotenoid concentration. Table 3 presents the results of these correlations.
The matrix effect variable in the analysis of pyrethroidspermethrin and deltamethrin presents a linear relationship with color. That is, as the fruit matures, the color increases and the matrix effect to that pesticide is greater. The color of tomatoes is directly related to the concentration of carotenoids. The lycopene accumulation in the fruits is responsible for the appearance of the red color
and the presence of β-carotene gives rise to the yellowness.
The correlations obtained between the matrix effects observed for pesticides in different maturation stages and the concentrations of carotenoids in these stages were quite
high. Observing the data obtained so far it can be inferred that as the fruit ripens the color increases, increasing
the concentration of lycopene and β-carotene in tomato
fruits. The level of 95% confidence the concentration of carotenoids is correlated positively with the effect of all pesticides studied matrix, being significant only for iprodione, as verified by the data of Table 3.
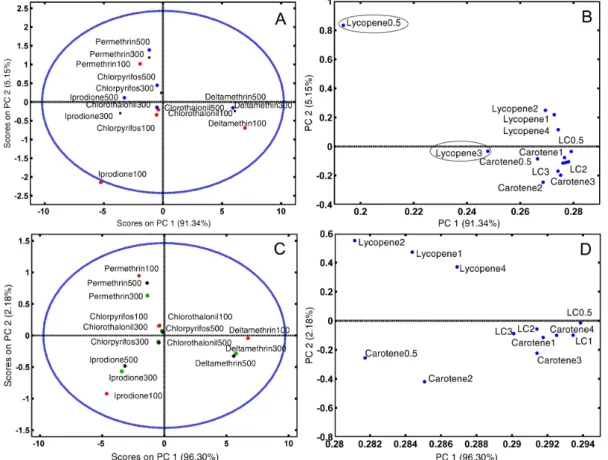
Principal components analysis
Figure 4 shows the PCA results considering the matrix effect observed for the five pesticides in solutions Table 3. Correlation between the matrix effect in different stages of maturation and the physical and chemical characteristics of tomatoes and concentrations of carotenoids
Pesticide ºBrix TAa pH Color Carotenoids
Chlorpyrifos –0.27 0.54 –0.22 0.45 0.75
Iprodione –0.20 0.78 –0.43 0.58 0.86
Permethrin 0.07 0.45 0.24 0.87 0.75
Chlorothalonil –0.19 0.67 –0.50 0.39 0.81
Deltamethrin 0.57 0.18 0.43 0.97 0.76
atitratable acidity
containing the lycopene and β-carotene pigments. The results presented in Figures 4A and 4B show that 96.55% of the variance of the data is explained by the first two components. The graph of scores shown in Figure 4A indicates that pesticides suffer the matrix effect produced by carotenoids and this effect is independent of the concentration of pesticide in the range studied (100, 300
and 500 µg L-1). However, iprodione (Figure 4A) has a
different behavior. The loadings of the variables lycopene
0.5 mgL-1 and lycopene 3 mg L-1 were responsible for this
anomalous behavior, as outlined in Figure 4B. By removing these variables, it was observed a more homogeneous and interpretable distribution of the scores of the samples (Figures 4C and 4D).
An interpretation of Figures 4C and 4D indicates that the first component (96.30% of variance) is responsible for the separation of deltamethrin of other pesticides. The mixture of carotenoids, lycopene and carotene showed a greater positive effect on the chromatographic response of deltamethrin, while lycopene and carotene
with concentrations of 2 mg L-1 and 0.5 mg L-1 had
higher negative effect on the chromatographic responses of the other pesticides. The second component (2.18% of variance) shows that lycopene presents a great effect on the chromatographic response of the permethrin,
while carotene concentrations of 2 mg L-1 and 0.5 mg L-1
negatively influenced on response of iprodione. The responses of chlorpyrifos and chlorothalonil pesticides suffered slight negative effect of both, carotene and lycopene, when pure. The second component confirms that the response of deltamethrin suffers positive effect principally from the carotene and lycopene mixture. The results indicate that the concentrations of carotene showed no interpretable behavior of the effect on responses.
Conclusion
The responses of the analysis by gas chromatography with electron capture detection (GC-ECD) of the studied analytes were affected by components of tomato matrix. These changes could be related to the presence of carotenoids in different stages of maturation. It was observed that, as the fruit matures, there are an increase in concentrations
of β-carotene and lycopene in organic extracts obtained by
SLE-PLT. This fact made the chromatographic responses of pesticides were significantly changed. The matrix effect in this study was independent of analyte concentration. The principal component analysis (PCA) showed that chromatographic responses of pesticides are affected differently by the presence of lycopene, carotene or a mixture of both. The concentrations of carotenoids in the
system did not show linear behavior on the matrix effect on chromatographic responses. When there is matrix effect is recommended to prepare the analytical curve using the extract of the matrix.
Acknowledgements
We thank the Brazilian Agencies: Conselho Nacional de Desenvolvimento Científico e Tecnológico (CNPq), Fundação de Amparo à Pesquisa do Estado de Minas Gerais (FAPEMIG) and Coordenação de Aperfeiçoamento de Pessoal de Nível Superior (CAPES) for their financial support.
References
1. Beckles, D. M.; Postharvest Biol. Technol .2012, 63, 129.
2. Carvalho, W.; Fonseca, M. E. N.; Silva, H. R.; Boiteux, L. S.; Giordano, L. B.; Quim. Nova 2005, 23, 819.
3. Gambacorta, G.; Faccia, M.; Lamacchia, C.; Di Luccia, A.; La Notte, E.; Food Control 2005, 16, 629.
4. Hajslová, J.; Zrostlíková, J.; J. Chromatogr. A 2003, 1000, 181. 5. Pinho, G. P.; Silvério, F. O.; Neves, A. A.; Queiroz, M. E. L. R.;
Starling, M. A. V. M.; Quim. Nova 2010, 33, 909.
6. Picó, Y.; Blasco, C.; Font, G.; Mass Spectrom. Rev. 2004, 23, 45.
7. Shami, N. J. I. E.; Moreira, E. A. M.; Rev. Nutr. 2004, 17, 227. 8. Pinho, G. P.; Neves, A. A.; Queiroz, M. E. L. R.; Silvério, F. O.;
Food Chem. 2010, 121, 251.
9. Pinho, G. P.; Neves, A. A.; Queiroz, M. E. L. R.; Silvério, F. O.; Marthe, D. B.; J. Braz. Chem. Soc. 2012, 23, 294.
10. Sousa, F. A.; Costa, A. I. G.; Queiroz, M. E. L. R.; Teófilo, R. F.; Neves, A. A.; Pinho, G. P.; Food Chem. 2012, 135, 179. 11. Camelo, A. F. L.; Gómez, P. A.; Hortic. Bras. 2004, 22, 534. 12. INSTITUTO ADOLFO LUTZ; Métodos Físico-Químicos para
Análise de Alimentos; Instituto Adolfo Lutz: São Paulo, 2008. 13. Nunes, I. L.; Mercadante, A. Z.; Cienc. Tecnol. Aliment. 2004,
24, 440.
14. Rodriguez-Amaya, D. B.; A Guide to Carotenoids Analysis in Food; International Life Sciences Institute Press: Washington, 2001.
15. Moraes, S. L.; Rezende, M. O. O.; Nakagawa, L. E.; Luchini, L. C.; Quim.Nova 2002, 25, 196.
16. Kluge, R. A.; Minami, K.; Sci. Agric. 1997, 54, 39.
17. Zambrano, J.; Moyeja, J.; Pacheco, L.; Agron. Trop. 1996, 46, 61.
20. Collins, C. H.; Braga, G. L.; Bonato, P. S.; Fundamentos de Cromatografia; Editora da UNICAMP: Campinas, 2006.
21. Pinho, G. P.; Silvério, F. O.; Neves, A. A.; Queiroz, M. E. L. R.; Starling, M. A. V. M.; Quim. Nova 2010, 33, 909.
22. Sousa, F. A.; Costa, A. I. G.; Queiroz, M. E. L. R.; Teófilo, R. F.; Pinho, G. P.; Neves, A. A.; Chromatographia 2013, 76, 67.
Submitted: October 16, 2013