NUCLEIC ACID DERIVED INDICES OR INSTANTANEOUS GROWTH RATE AS TOOLS TO
DETERMINE DIFFERENT NUTRITIONAL CONDITION IN CUTTLEFISH (SEPIA
OFFICINALIS, LINNAEUS 1758) HATCHLINGS
ANTO´ NIO V. SYKES,* PEDRO M. DOMINGUES AND JOSE´ P. ANDRADE
C.C. MAR Universidade do Algarve F.C.M.A., Campus de Gambelas 8000, 817 Faro, Portugal
ABSTRACT Two groups of 100 cuttlefish hatchlings each were used to determine the duration of the yolk reserves, during which growth can be obtained with no food supply. One group was fed live grass shrimp ad libitum from the 3rd day of life onwards, while the other was starved during the whole experiment. The experiment lasted 7 days, because this was the 1st day where a negative growth rate was obtained. Nucleic acid derived indices and instantaneous growth rates (IGR) were used as a way to describe their condition, when all the yolk reserves would be exhausted and to determine the most accurate tool to express growth and condition. RNA/DNA ratios described clearly the differences (P < 0.05) between fed and starved hatchlings cultured at 23 ± 2°C, especially from day 4 onwards. Correlation between IGR and RNA/DNA ratios was only attained for the starved population (R⳱ 0.90; P ⳱ 0.0374). DNA concentration was identical (P > 0.05) between groups and did not displayed a clear pattern with increasing age. Correlation between IGR and DNA was only attained for the fed population (R⳱ −0.90; P ⳱ 0.0374). RNA concentration values were different from day 5 onwards. Any of the nucleic acid derived indexes were not accurate enough to express growth and condition, so IGR seems to be the most accurate and inexpensive way to describe hatchlings growth and condition in controlled conditions.
KEY WORDS: condition indices, cuttlefish, DNA/RNA ratios, growth rates, hatchlings, accuracy methodologies, Sepia
INTRODUCTION
When culturing any species in intensive aquaculture, time of first feeding is of extreme importance. Food should be available when larvae or hatchlings are finishing the absorption of the inner yolk reserves and starting to feed externally. Cuttlefish are known to be voracious feeders throughout their life cycle and accept a wide range of prey (Guerra 1985, Castro & Guerra 1989, Pinczon du Sel & Daguzan 1992, Domingues et al. 2001a, Domingues et al. 2003). Some authors (Wells 1958, Richard 1971, Richard 1975, Boletzky, 1983, Boletzky 1987, and Nixon 1985) have studied the embryonic development and the early life history of cuttlefish and set the end of the inner yolk reserves around the 3rd day of life. However, according to Domingues et al. (2001b), cuttlefish in unfed or poor nutritional condition (as result of prey with poor nutritional profile) can last as much as 20 days. The only way to determine optimal timetables for first feeding, thus optimizing cuttlefish production, is the use of condition analysis. Condition is a measure of the physical status or well being of an animal and may be used to evaluate growth or survival rates (Bolger & Con-noly 1989, Ferron & Leggett 1994).
Nutritional condition of larval stages plays an important role in the knowledge of the recruitment of marine species. Nutritional condition of fish larvae can be evaluated using several methods: morphometric, histologic, and biochemical (Chícharo 1993). How-ever, costs and results associated with each methodology are not similar between them. So, the main questions are which method-ology to choose when trying to evaluate the condition of the ani-mal, and the compromise between costs and accuracy of results to achieve. The use of morphometric methodologies are standards in most aquaculture and fishery laboratories around the world. Nowa-days, biochemical methodologies related to nucleic acid derived indices are becoming standards also.
One of the most commonly used methods for determining the nutritional condition and growth is the RNA/DNA ratio (Buckley 1979, Buckley 1980, Buckley & Lough 1987, Clemmesen 1988,
Clemmesen 1990, Robinson & Ware 1988). The use of this meth-odology is based on the assumption that DNA is present in con-stant concentrations, under changing environmental conditions or during starvation (Richard et al. 1991), whereas RNA varies, de-creasing in starving animals (Buckley 1984, Buckley & Lough 1987). According to Bulow (1987), RNA concentrations are higher in tissues with faster growth rates or with a higher rate of protein synthesis. The RNA/DNA ratio indicates quantities/concentrations of RNA per cell and is the most accurate when estimating tecidular proteossynthetic activity (Bulow 1987, Buckley 1981, Buckley 1984). The use of RNA concentration in a tissue as an indicator of growth is based on the assumption that RNA is related to the potential for protein synthesis (Houlihan 1991). However, large variation in the RNA/DNA ratio may occur in fed larvae (Clem-mesen 1988, Raae et al. 1988). Recent studies suggest that the RNA/DNA ratio is one of the best indicators of the nutritional condition of several marine organisms (Clemmesen 1994, Bailey et al. 1995, Chícharo 1997, Chícharo et al. 1998, Chícharo et al. 2001).
Biochemical methodologies have been proposed to evaluate condition in post-hatch and juvenile cuttlefish (Clarke et al. 1989, Pierce et al. 1999, Koueta et al. 2000). One of those is the RNA/ DNA nutritional condition ratio. However, until now, only RNA concentrations in the muscle were shown to be directly correlated with growth in Octopus vulgaris (Houlihan et al. 1990) and Sepia officinalis (Castro & Lee 1994).
The objective of this research is to determine: (1) how long cuttlefish hatchlings could survive on inner yolk reserves after hatching, using nucleic acid derived indices (RNA/DNA ratio, [DNA]/g and [RNA]/g) and instantaneous growth rates (IGR) as ways to describe their growth and condition and (2) the best de-scriber for condition, based on a compromise of money spent, results achieved, and when to apply it.
MATERIAL & METHODS Experimental Conditions
A group of 100 cuttlefish hatchlings was used to determine the maximum starvation period, while another group of 100 hatchlings
*Corresponding author. E-mail: [email protected]
(control) were fed live grass shrimp (Palaemonetes varians) cap-tured from nature. The control group was fed ad libitum from day 3 to 7. Both groups were placed in baskets (5.4 L water volume, 1-mm mesh) which were in 250 L tanks of a flow-through system with a UV unit, described in Domingues et al. (2001b and 2002). Water flow was of 12 L/h. Water temperature was of 23°C ± 2°C and salinity was of 37 ± 2 PSU; lights were running on a 12 h per day basis. This system ensured an excellent water quality, neces-sary for hatchling culture.
Because several authors reported that cuttlefish hatchlings start external feeding on the 3rd day of life (Richard 1971, Richard 1975, Boletzky 1983), this was the starting period for collection of data on growth, survival, and condition. However, two samples of 20 newly born hatchlings were taken to determine RNA and DNA concentrations and ratio at time of hatching. The experiment lasted until the 7th day, because, at this time, negative growth rates for the starved animals started to be obtained. Each day 20 hatchlings were collected from each group, weighed, frozen, and stored (at −80°C) for later nutritional condition analysis. Collected data were used to calculate: (1) mean weight; (2) mean instantaneous growth rate (IGR) (%BW.d−1
) ⳱ (LnW2-LnW1)/t*100, where W2 and W1 are the final and initial weight respectively, Ln the natural logarithm and t the number of days of the time period; and (3) survival rates.
Nucleic Acid Determinations
Methods for the determination of nutritional condition were adapted from Esteves et al. (2000) and Chícharo et al. (2001).
Purification of tissues was achieved by homogenizing each cuttlefish in 2.5 ml TRIS-HCl solution for 5 sec with an ultra-turrax unit (IKA Labortechnik), and 10 sec in an ultrasonic ho-mogenizer unit (4710 Series, Cole Parmer Instruments Co.). This methodology was applied to obtain maximum homogeneity of tis-sues and disruption of cells, as well as a total destruction of the cuttlebone. After that, the homogenate was washed with 50l 3% sarcosine Tris-HCl and 1.35 mL Tris-HCl (Trizma, pH⳱ 8) so-lutions and centrifuged during 5 min, at 9860 RPM and 4°C. Subsequent fluorescence-photometric measurements were done. DNA+RNA measurements were done combining 0.2 mL of su-pernatant with 0.4 mL of Tris-NaCl (Trizma, pH⳱ 7.5) and 0.05 mL ethidium bromide (EB) (0.1mg/mL), which is a nucleic fluo-rochrome dye specifically designed. DNA measurements were done combining 0.2 mL of supernatant with 0.35 mL of Tris-NaCl (Trizma, pH ⳱ 7.5) and 0.05 ml of ribonuclease A (Type-II A, Sigma, 0.12g.ml−1
). After that, this mixture was incubated in a water bath for 30 min at 37°C and allowed to reach room tem-perature for 20 min. Same quantities of ethidium bromide (EB) (0.1 mg/mL) were then used to stain the DNA and DNA+RNA in mixture samples. Each cuttlefish sample was analyzed in triplicate. Values of DNA and RNA were then estimated calculating the mean value of the 3 replicates.
Determinations of nucleic acid concentration were identical for both DNA+RNA and DNA measurements. The fluorescence due to total RNA was then calculated using the difference between total fluorescence (RNA+DNA) and the fluorescence after the ap-pliance of ribonuclease A. This second fluorescence is assumed to be due to DNA, after the subtraction of the self-fluorescence by the enzyme. Both fluorescences were determined by exciting at 365 nm and reading at 590 nm with a Hitachi spectrofluorometer (model 650-10). Concentrations of both DNA and RNA were
de-termined using standard curves of known concentrations of calf DNA and yeast RNA, after carrying out the same methodology as for the samples.
Data Analysis
Mann-Whitney tests (Zar 1984) were used to determine differ-ences in IGR, RNA/DNA, [DNA]/g larvae and [RNA]/g larvae between fed and unfed hatchlings. Spearman rank order correlation tests (Zar 1984) were used to determine correlations between IGRs and RNA/DNA and IGR and DNA of fed and unfed hatchlings.
RESULTS IGR and Survival
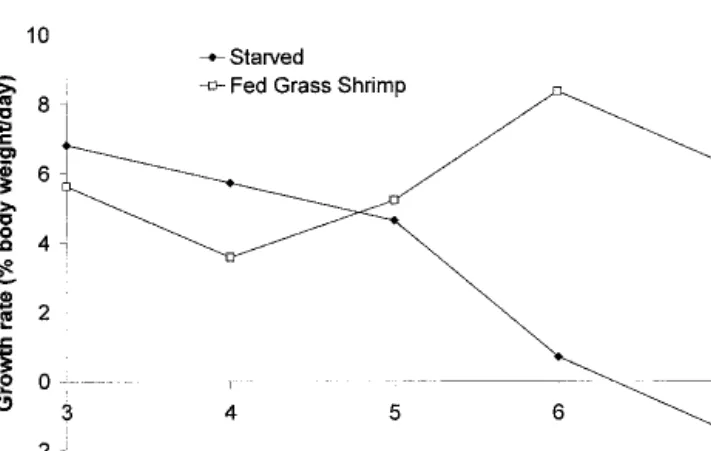
Both starved and fed cuttlefish hatchlings showed different IGRs (P < 0.05) (Fig. 1). Starved cuttlefish group showed a steady decline in IGR from values of about 6% BW.d−1(day 4) to nega-tive values of approximately −1.4% BW.d−1
(day 7). Fed hatchlings showed similar values of IGR (minimum of 3.6% and maximum of 8.4% BW.d−1
) to the ones obtained by Sykes (2003). Mortality was low and only 6 out of 100 hatchlings (6%) died in each group being tested.
Nucleic Acid Derived Indices
Standard calibration curves were obtained for both DNA and RNA. DNA calibration can be described using linear regression analysis by the equation y⳱ 13.961 × +3.7498 (r2⳱ 0.996; n ⳱ 588). RNA calibration can be described using linear regression analysis by the equation y⳱ 4.3829 × +3.9095 (r2⳱ 0.992; n ⳱ 315).
Hatchling condition was significantly different between fed and unfed hatchlings (P < 0.05). RNA/DNA ratio of fed hatchlings increased, whereas in starved hatchlings decreased, throughout the experiment (Fig. 2). Maximum values of RNA/DNA ratio (1.60 at day 7) were obtained in fed hatchlings whereas minimum values (0.00 at day 7) were obtained in starved hatchlings. Standard de-viation of RNA/DNA ratio was high for both groups.
DNA concentration per g of body weight showed no significant differences (P > 0.05) between concentrations until day 4, whereas during day 5 to day 7, DNA concentrations were significantly different (P < 0.05) between both groups (Fig. 3). DNA concen-tration was higher in starved than in fed hatchlings. Maximum values were obtained in starved hatchlings (13.04g/g at day 5) whereas minimum values were obtained in fed hatchlings (5.23
g/g at day 7). Standard deviation was higher in starved than in fed hatchlings.
RNA concentration per g of body weight showed no significant differences (P > 0.05) in concentrations only for day 4 and 5 (Fig. 4). RNA concentration was higher in fed than in starved hatchlings. Maximum values were obtained in fed hatchlings (9.05 g/g at day 5) whereas minimum values were obtained in starved hatchlings (0.00g/g at day 7). Standard deviation was high in both groups.
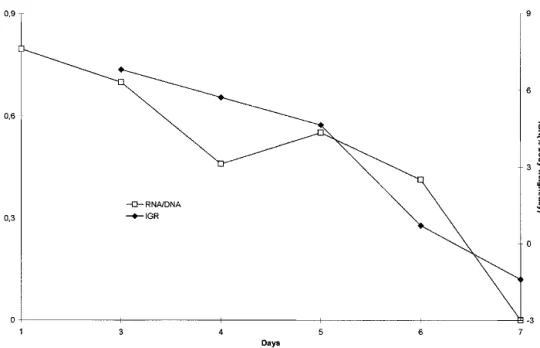
Spearman rank order correlation showed correlation between IGR and RNA/DNA for the starved group (R ⳱ 0.90; P ⳱ 0.0374), but it did not show correlation for the group fed with grass shrimp (R ⳱ 0.80; P ⳱ 0.1041) (Fig. 5 and Fig. 6). IGR and RNA/DNA decreased with increasing age for the starved group while the opposite occurred for the fed group.
Correlation of IGR and DNA for both fed and unfed hatchlings using Spearman rank order correlation showed inconclusive re-sults. Results of the correlation between IGR and DNA for the fed group were significant (R ⳱ −0.90; P ⳱ 0.0374) whereas the correlation for IGR and DNA of the unfed group were not signifi-cant (R⳱ −0.30; P ⳱ 0.6238).
DISCUSSION
According to Berrigan and Charnov (1994), both low tempera-ture and below normal feeding rates will reduce growth rates in most ectotherms. Forsythe et al. (1991) stated that temperature and
ration levels are the main factors determining variations in ceph-alopod growth rates. Because temperature was the same for both groups, differences in growth were directly related to feeding or starving.
Fed cuttlefish hatchlings readily accepted grass shrimp from the 1st day of feeding (day 3) onwards. Results obtained lead us to believe that inner yolk reserves should last at least to the 4th day after hatching, at a temperature of 23°C ± 2°C. This assumption is made based upon the decline in both patterns of IGR and RNA/ DNA ratios for fed hatchlings on the 4th day, and the fast decline in starved hatchlings from the 5th day onwards. However, time for the first feeding should be establish for the 3rd day after hatching because of cuttlefish energy consumption when capturing grass shrimp. If hatchlings are first fed later than this 3rd day, it will probably originate higher mortality values at this optimal culture temperature, because their capability to capture grass shrimp will be greatly diminished by lack of energy resources. This lack of energy resources is supposed to be related to the ending of the inner yolk reserves and their metabolization. The establishment of a time for the first feeding is particularly important because cuttle-fish eggs do not usually hatch in the same day as cuttle-fish do, but instead, they take their time hatching. This problem is caused by females intermittent spawning (Boletzky 1987b).
Previous studies showed that growth rates have been the most accurate way of measuring cuttlefish growth and condition for the first weeks of life. Instantaneous growth rates have been calculated for a number of cephalopods (Forsythe 1993, Lee 1994, Sykes 2003) and can give some indication about cuttlefish condition over time. Unfed or underfed animals will display negative or very slight variations in IGR during survey time, respectively. On the other hand, well-fed animals will display positive IGR. In the present experiment, fed and starved hatchlings showed these pat-terns.
Clarke et al. (1989) reported that in juvenile cuttlefish the RNA/DNA ratio was positively correlated with growth in indi-viduals kept at 17.5°C, but no correlation was found on those kept at 12°C. According to the same author, RNA/DNA ratios of cuttle-fish with low growth rates were similar to those reported for cuttle-fish larvae; nucleic acid ratios at higher growth rates were higher than those reported so far. These authors also stated that higher values of RNA/DNA ratio could be related to the very high growth rates of cephalopods. In the present study, RNA/DNA ratios clearly described the differences between fed and starved hatchlings cul-Figure 3. [DNA]/g of larvae of starved and fed hatchlings. Vertical
lines represent standard deviations.
Figure 4. [RNA]/g of larvae of starved and fed hatchlings. Vertical lines represent standard deviations.
Figure 2. RNA/DNA ratios of starved and fed hatchlings. Vertical lines represent standard deviations.
tured at 23 ± 2°C, especially from day 4 onwards. However, RNA/ DNA ratio results obtained in the present work were similar to those reported for fish larvae, and not higher as expected. This is particularly important because at this temperature cuttlefish will grow exponentially, as reported by Lee (1994) and more recently by Domingues et al. (2001a, 2002) and Sykes (2003). It seems that although feeding and growth rates are extremely high at this time of their life cycle, a correlation between growth and condition cannot be achieved. In fact, for the present study, when trying to establish a correlation between IGR and RNA/DNA ratios for both fed and starved groups, results were not conclusive. Although the present results showed a similar pattern, a statistical correla-tion was only observed for the starved group. According to Clarke
et al. (1989), if the RNA/DNA ratio is to be used as a tool in ecologic studies, there is a need for this relationship of RNA/DNA ratio with the nutritional status and growth rates to be precise. The same authors also add that RNA/DNA ratios would only allow distinction between zero, average and maximal growth. Castro & Lee (1994) stated that RNA/DNA ratio might not always be the best growth indicator for S. officinalis. So, RNA/DNA ratios are not accurate enough for determination of cuttlefish condi-tion, but they will allow distinction between starved and fed ani-mals.
These results indicate that DNA concentration should be of great importance when describing nutritional condition of cuttle-fish hatchlings rather than RNA/DNA ratios. DNA concentration Figure 5. RNA/DNA ratios and IGR for starved hatchlings.
seems to be inversely correlated with IGR. Higher values of DNA were obtained when IGR displayed the lower values. Clarke et al. (1989) reported that the percentage of DNA/dry weight was much more stable in fed larvae than the RNA/DNA ratio. Chícharo (1993) stated that DNA concentration of fish larvae was especially sensitive to starving conditions after complete depletion of yolk reserves. It seems that the same happens with cuttlefish hatchlings. Bergeron and Person Le-Ruyet (1997) suggested that DNA con-centration per g of body weight would be a better and simpler index of larval nutritional status than the RNA/DNA ratios, be-cause it was more stable in fed hatchlings, and the methodology used to measure DNA alone would be easier, more sensitive, and less expensive than RNA/DNA ratios. However, correlation be-tween IGR and DNA was only statistical significant for the fed group, and so DNA concentration is also not accurate enough to describe growth in cuttlefish.
Values obtained for RNA concentration in this study should describe starved hatchling condition and minimum or non existent rate of protein synthesis, at 23°C ± 2°C. Mathers et al. (1994) found that an increase in protein content in fish larvae was not associated with similar increase in RNA concentration. According to Pierce et al. (1999) there is no direct relation between RNA concentration and growth rates in cephalopod species like Loligo forbesi, Eledone cirrhosa and Octopus vulgaris. The work of Castro and Lee (1994) showed, however, that the RNA contents in mantle muscle could be used as short-term indicator of instan-taneous growth rate and condition of cuttlefish. More recently, Koueta et al. (2000) found that changes in RNA content of muscle were related to growth in S. officinalis hatchlings. The same author also stated that RNA content of the muscle increased significantly between underfed (low ration) and maintenance fed (medium ration) groups and were according to Bulow’s (1987) findings for fish. Results from this study fall within the condition results obtained by Castro and Lee (1994) and Koueta et al. (2000), with a clear distinction between fed and starved animals. However, they are once again not accurate enough to describe growth be-cause, in the present study, RNA concentration had great varia-tions between animals that were under the same feeding condi-tions.
According to Richard et al. (1991), all methods for condition analysis have their limits, some are too time-consuming while others require large samples or are valid only for particular larval stages. Last but not the least, the amount of money spent on this kind of methodology is extremely high and results are compara-tively poor in accuracy. This study shows that time tables for the first feeding time can be obtained easily without using nucleic acid
derived indexes by IGR. In spite of the lack of correlation between IGR and RNA/DNA ratios in fed hatchlings, IGR still seems to be the most appropriate evaluator of cuttlefish growth and condition in controlled environments because it can be applied throughout the life cycle and is less expensive and time consuming. Forsythe (1993) stated that exponential growth patterns of some temperate cephalopods mean that very small changes in the growth rates of juveniles will translate into large differences in the adults. These small changes cannot be measured by nucleic acid derived indexes because of the variation associated with this method and described earlier. Nevertheless, it is possible that nucleic acid derived in-dexes could be used as tools to evaluate recruitment and wild larval condition and to evaluate condition of cuttlefish hatchlings in ecologic and fisheries research. Thus, the present work could be seen as a new approach to the determination of standard nutritional condition patterns to be used when studying wild cuttlefish hatchlings condition. However, much work still has to be done concerning these indexes at different temperatures and under con-trolled conditions, to obtain some data that can be used as control to be applied.
According to Jackson and Choat (1992), short lifespan species display exponential or linear growth. Because of this, these ani-mals spend about half of their life as small juveniles. Moltschaniw-skyj and Martinez (1998) added that this may not be a disadvan-tage to their survivorship, and that condition of these juvenile marine organisms, rather than size, may play an important role in population dynamics. According to Van Heukelem (1979), slow growth by under-nutrition results in individuals maturing at smaller sizes, whereas, if growth rates are reduced by lower tem-peratures, then maturation will occur at larger sizes. Based on this assumption, Moltschaniwskyj and Martinez (1998) stated that the effects of temperature and nutrition on growth differ. Taking all this into account, laboratory determination of nucleic acid derived indexes patterns could provide some answers and clues about cuttlefish condition in the wild, and the associated recruitment. Nevertheless, they cannot be used as precise tools to evaluate cuttlefish condition during the first stages of their life, because they are not accurate enough.
AKNOWLEDGMENTS
Anto´nio Sykes and Pedro Domingues thank the Fundação para a Ciência e a Tecnologia, from the Portuguese government, that provided the funding for this research. This study was funded by CORRAM – “Cephalopoda: Octopodidae-relationship of the re-source with the marine environment” Program Praxis XXI, ref. 2/2.1/MAR/1707/95.
LITERATURE CITED
Bailey, K. M., M. F. Canino, J. N. Napp, S. M. Spring & A. L. Brown. 1995. Contrasting years of prey levels, feeding conditions and mortality of larval walleye Pollock Theragra chalcogramma in the western Gulf of Alaska. Mar. Ecol. Prog. Ser. 119:11–23.
Bergeron, J. P & P. Le-Ruyet. 1997. Teneur en and de la larve de Dicen-trarchus labrax: évolution ontogénétique et effect de la privaton de nourritoure. Aquatic Living Resources 10:247–250.
Berrigan, D. & E. L. Charnov. 1994. Reaction norms for age and size at maturity in response to temperature: a puzzle for life historians. Oikos 70:474–478.
Boletzky, S. 1983. Sepia officinalis. In : P. R. Boyle, ed. Cephalopod life cycles. vol. 1. London: Academic Press. pp: 31–52.
Boletzky, S. 1987. Embryonic phase. In: P. R. Boyle, ed. Cephalopod life cycles. vol. 2. London: Academic Press. pp: 5–31.
Boletzky, S. 1987b. Fecundity variation in relation to intermittent or chronic spawning in the cuttlefish, Sepia officinalis L. (Mollusca, Cephalopoda). Bull. Mar. Sci. 40(No. 2):382–387.
Bolger, T. & P. L. Connolly. 1989. The selection of suitable indices for the measurement and analysis of fish condition. J. Fish. Biol. 34:(171– 182).
Buckley, L. J. 1979. Relationship between RNA/DNA ratio, prey density and growth rate in Atlantic cod (Gadus morhua) larvae. J. Fish. Res. Bd. Can. 36:1497–1502.
Buckley, L. J. 1980. Changes in the ribonucleic acid, deoxyribonucleic acid, and protein content during ontogenesis in winter flounder, Pseudopleuronectes americanus, and the effect of starvation. Fish. Bull. 77:707–708.
Buckley, L. J. 1981. Biochemical changes during ontogenesis of cod (Ga-dus morhua L.) and flounder (Pseudopleuronectes americanus) larvae. In: Rapp. P.V. ed. Réun. Cons. Int. Explor. Mer. 178:547–552. Buckley, J. B. 1984. RNA/DNA ratio: an index of larval fish growth in the
sea. Marine Biol. 80:291–298.
Buckley, J. B., R. G. Lough. 1987. Recent growth, chemical composition and prey field of haddock (Melanogrammus aeglefinus) and cod (Ga-dus morhua) larvae and post larvae on Georges Bank, May 1983. Can. J. Fish Aquat. Sci. 44:14–25.
Bullow, F. J. 1987. RNA-DNA ratios as indicators of growth in fish: a review in the age and growth of fish. In: R. C. Summerfelt & G. E. Hall eds. Ames: The Yowa University Press. pp. 45–64.
Castro, B. G. & A. Guerra. 1989. Feeding pattern of Sepia officinalis (Cephalopoda: Sepioidea) in the Ria de Vigo (NW Spain). Journal of the Marine Biological Association of the UK. 69:545–553.
Castro, B. G. & P. G. Lee. 1994. The effects of semi-purified diets on growth and condition of Sepia officinalis L. (Mollusca: Cephalopoda). Comp. Biochem. Physiol. 109A:1007–1016.
Chícharo, M. A. 1993. Estado nutricional em larvas de peixe: análise de ácidos nucléicos e proteínas. Boletin UCA, Universidade do Algarve, UCTRA, pp. 653–669.
Chícharo, M. A. 1997. Starvation percentages in field caught Sardina pilchardus larvae off southern Portugal. Scientia Marina 61:507–516. Chicharo, M. A., L. Chicharo, L. Valdes, J. E. Lopez & P. Ré. 1998. Estimation of starvation and diel variation of the RNA/DNA ratios in field-caught Sardina pilchardus larvae off the north of Spain. Marine Ecology Progress Series 164:273–283.
Chícharo, L., M. Chícharo, F. Alves, A. Amaral, A. Pereira & J. Regala. 2001. Diel variation of the RNA/DNA ratios in Crassostrea angulata (Lamarck) and Ruditapes decussatus (Linnaeus 1758) (Mollusca: Bi-valvia). J. Exp. Mar. Biol. Ecol. 259:121–129.
Clarke, A., P. G. Rodhouse, L. J. Holmes & P. L. Pascoe. 1989. Growth rate and nucleic acid ratio in cultured cuttlefish Sepia officinalis (Mol-lusca: Cephalopoda). J. Exp. Mar. Biol. Ecol. 133:229–240. Clemmesen, C. 1988. A RNA and DNA fluorescence technique to evaluate
the nutritional conditions of individual marine fish larvae. Meeres-forsch 32:134–143.
Clemmesen, C. 1990. Improvements in the fluorimetric determination of the RNA and DNA content in individual marine fish larvae. ICES, CM Biol. Oceanr. Ctte. 14 pp.
Clemmesen, C. 1994. The effect of food availability, age or size on the RNA/DNA ratio of individually measured herring larvae: laboratory calibration. Marine Bio. 118:377–382.
Domingues, P. M., T. Kingston, A. Sykes & J. P. Andrade. 2001a. Growth of young cuttlefish, Sepia officinalis (Linnaeus, 1758) at the upper end of the biologic distribution temperature range. Aquaculture Res. 32: 923–930.
Domingues, P. M., A. Sykes & J. P. Andrade. 2001b. The use of Artemia sp. or mysids as food source for hatchlings of the cuttlefish (Sepia officinalis L.), effects on growth and survival throughout the life cycle. Aquaculture International 9:319–331.
Domingues, P. M., A. Sykes & J. P. Andrade. 2002. The effects of tem-perature in the life cycle of two consecutive generations of the cuttle-fish Sepia officinalis (Linnaeus, 1758), cultured in the Algarve (South Portugal). Aquaculture International 10:207–220.
Domingues, P. M., R. Poirier, L. Dickel, E. Almansa, A. Sykes & J. P.
Andrade. 2003. Effects of culture density and live prey on growth and survival of juvenile cuttlefish, Sepia officinalis. Aquaculture Interna-tional 11:225–242.
Esteves, E., M. A. Chícharo, T. Pina, M. L. Coelho & J. P. Andrade. 2000. Comparison of RNA/DNA ratios obtained with two methods for nucleic acid quantification in gobiid larvae. Journal of J. Exp. Mar. Biol. Ecol. 245:43–55.
Ferron, A. & W. C. Leggett. 1994. An appraisal of condition measures for marine fish larvae. Adv. Mar. Biol. 30:217–303.
Forsythe, J. W. 1993. A working hypothesis of how seasonal change may impact the field growth of young cephalopods. In: T. Okutani, R. K. O’Dor & T. Kubodera, eds. Recent advances in cephalopod fisheries biology. ed. Takai University Press, Tokyo, pp. 133–143.
Forsythe, J. W., R. T. Hanlon & R. H. DeRusha. 1991. Pilot large-scale culture of Sepia in biomedical research. In: E. Boucaud-Camou, ed The cuttlefish. Centre de publications de l’Université de Caen, pp. 313–323.
Guerra, A. 1985. Food of the cuttlefishes Sepia officinalis and Sepia el-egans in the Ria de Vigo (N.W. Spain) (Mollusca: Cephalopoda). Jour-nal of Zoology. 207:511–519.
Houlihan, D. F. 1991. Protein turnover in ectotherms and its relation to energetics in Pacific herring during early developmental stages. Hok-kaido University. Bull. Fac. Fish. 37:30–37.
Houlihan, D. F., D. N. McMillan, C. Agnisola, I. Trara Genoino & L. Foti. 1990. Protein sintesis and growth in Octopus vulgaris. Marine Biol. 106:251–259.
Jackson, G. D. & J. H. Choat. 1992. Growth in tropical cephalopods: an analysis based on statolith microstructure. Can. J. Fish. Aquat. Sci. 49:218–228.
Koueta, N., B. G. Castro & E. Boucaud-Camou. 2000. Biochemical indices for instantaneous growth estimation in young cephalopod Sepia offici-nalis L. ICES Journal of Marine Science 57:1–7.
Lee, P. G. 1994. Nutrition of cephalopods: fuelling the system. Marine and Freshwater Behaviour Physiology 25:35–51.
Le Pecq, J. B. & C. Paoletti. 1966. A new fluorimetric method for RNA and DNA determination. Anal. Biochem. 77:100–107.
Mathers, E. M., D. F. Houlihan & L. J. Burren. 1994. RNA, DNA and protein concentrations in fed and starved herring, Clupea harengus larvae. Marine Ecological Program Series 107:223–231.
Moltschaniwskyj, N. A. & P. Martinez. 1998. Effect of temperature and food levels on the growth and condition of juvenile Sepia elliptica (Hoyle 1885): an experimental approach. J. Exp. Mar. Biol. Ecol. 229: 289–302.
Nixon, M. 1985. Capture of prey, diet and feeding of Sepia officinalis and Octopus vulgaris from hatchling to adult. Vie et Millieu 35:255–261. Pierce, G. J., L. N. Key, P. R. Boyle, K. J. Siegert, J. M. Gonçalves, F. M. Porteiro & H. R. Martins. 1999. RNA concentration and the RNA to protein ration in cephalopod tissues: sources of variation and relation-ship with growth rate. J. Exp. Mar. Biol. Ecol. 237:185–201. Pinczon du Sel, G. & J. Daguzan, 1992. The alimentary diet of Sepia
officinalis (Mollusca: Cephalopoda) during its life cycle in South Bri-tany (France). Abstracts of the 11thInternational Malacological
Con-gress. Siena (Italy). pp.476.
Raae, A. J., I. Opstad, P. Kvenseth & B. T. Walther. 1988. RNA, DNA and protein during early development in feeding and starved cod (Gadus morhua L.) larvae. Aquaculture 73:247–259.
Richard, A. 1971. Contribuition à l’étude expérimentale de la croissance et de la maturation sexuelle de Sepia officinalis L. (Mollusque, Céphalo-pode). Thèse n° 248: Univ. Lille. 264 pp.
Richard, A. 1975. L’élevage de la seiche (Sepia officinalis L., Mollusque Céphalopode). 10th European Symposium on Marine Biology. Vol. I. Ostend, Belgium. pp: 359–380.
Richard, P., J. P. Bergeron, M. Boulhic, R. Galois & J. Person-Le Ruyet. 1991. Effect of starvation on RNA, DNA and protein content of labo-ratory-reared larvae and juveniles of Solea solea. Mar. Ecol. Prog. Ser. 72:69–77.
Robinson, S. M. & D. M. Ware. 1988. Ontogenic development of growth rates of larval Pacific herring, Clupea harengus pallasi, measured with RNA/DNA ratios in the Strait of Georgia, British Columbia. Can. J. Fish. Aquat. Sci. 45:1422–1429.
Sykes, A. 2003. On the use of live grass shrimp (Palaemonetes varians) as the only prey to culture cuttlefish (Sepia officinalis) throughout the life cycle. MSc. Thesis, Instituto de Ciências Biomédicas Abel Salazar. Porto: Universidade do Porto. 61 pp.
Van Heukelem, W. F. 1979. Environmental control of reproduction and life span in octopus: an hypothesis. In: Stancyk, S. E. ed. Reproductive ecology of marine invertebrates. University of South Carolina Press, Columbia, S.C.: pp. 123–133.
Wells, M. J. 1958. Factors affecting reactions to Mysis by newly hatched Sepia. Behavior 13:96–111.
Zar, J. H. 1984. Biostatistical analysis. In: W. McElroy & P. Swanson, ed. Englewood Cliffs, NJ: Prentice-Hall Inc. 619 pp.
![Figure 4. [RNA]/g of larvae of starved and fed hatchlings. Vertical lines represent standard deviations.](https://thumb-eu.123doks.com/thumbv2/123dok_br/18802340.925989/3.945.111.844.130.346/figure-larvae-starved-hatchlings-vertical-represent-standard-deviations.webp)