Response of laying hens to methionine + cystine intake by dilution technique
Hilda Cristina Palma Bendezu1, Nilva Kazue Sakomura1, Luciano Hauschild1, Edney Pereira da Silva1, Juliano Cesar de Paula Dorigam1, Euclides Braga Malheiros1, João Batista
Kochenborger Fernandes2
1 Universidade Estadual Paulista “Júlio de Mesquita Filho”, Faculdade de Ciências Agrárias e Veterinárias, Jaboticabal, SP, Brasil. 2 Universidade Estadual Paulista “Júlio de Mesquita Filho”, Centro de Aquicultura, Jaboticabal, SP, Brasil.
ABSTRACT - The objective of this study was to measure the response of Dekalb White laying hens to different intakes of digestible methionine + cystine (met+cys) to optimise their performance. Two hundred eighty-eight Dekalb White laying hens, ranging in age from 33 to 48 weeks, were used in the study. The birds were randomly allocated into eight treatment (levels of met+cys and the control treatment) groups with six replicates of six hens per unit. The experimental diets consisted of seven increasing levels of met+cys (1.37, 2.75, 4.14, 5.51, 6.89, 7.92 and 8.95 g kg−1) and were prepared using a dilution technique. A control treatment was
used to confirm that the limiting response was due to met+cys intake. Egg production, feed intake, egg weight, egg mass and feed conversion per mass were measured. The data were analysed with repeated measures and regression analyses using Broken Line and Quadratic models, as well as using the combination of both models. The different met+cys intakes influenced the studied variables; all the variables except feed conversion per mass were significantly different between the periods and levels. The digestible met+cys intakes based on the association of the Broken Line and Quadratic models to optimise the birds’ response to egg mass are 671 mg/bird d for 33 to 36 weeks, 728 mg/bird d for 37 to 40 weeks, 743 mg/bird d for 41 to 44 weeks, and 770 mg/bird d for 45 to 48 weeks.
Key Words: Broken Line, dose-response, models, requirement, statistic
ISSN 1806-9290
www.sbz.org.br R. Bras. Zootec., 44(1):15-21, 2015
Received September 9, 2013 and accepted October 9, 2014. Corresponding author: [email protected]
http://dx.doi.org/10.1590/S1806-92902015000100003
Copyright © 2015 Sociedade Brasileira de Zootecnia. This is an Open Access article distributed under the terms of the Creative Commons Attribution Non-Commercial License, which permits unrestricted non-commercial use, distribution, and reproduction in any medium, provided the original work is properly cited.
Introduction
Methionine plays an important role in metabolism (Shafer et al., 1998; Bunchasak, 2009). Among the essential amino acids, methionine is the most studied because it is the first limiting amino acid in the formulation of diets based on corn and soybean meal (Barbosa et al., 2010). Due to its physiological and economic significance, determining the requirement of this amino acid is necessary.
Testing an amino acid at several levels is indispensable to understanding how a bird responds to the gradual increase of a limiting amino acid. According to Sakomura and Rostagno (2007), the gradual increase in the supply of an amino acid provides responses that can be subdivided into three phases: initial (maintenance), linear (response) and stable (without additional response).
To properly fit a mathematical model to the experimental response, the responses in these three phases should be documented (Baker, 1986). Additionally, these assumptions should be considered for the establishment and
spacing of the tested levels. However, many studies have established recommendations without considering these assumptions, possibly contributing to the divergence in the recommendations for the optimal intake of methionine + cystine (met+cys).
Currently, the technique of supplementation is the most used methodology to establish amino acid levels in experimental trials to determine their requirements. This method consists of the gradual increase of the amino acid to the basal diet deficient in the amino acid to be studied. This procedure provokes alterations in the amino acid profile of the dietary protein (Liebert and Benkendorff, 2007). An alternative to the supplementation technique is the dilution technique, which consists of the sequential dilution of a summit diet (high-protein diet) with a protein-free diet but with the same energy levels and other nutrients.
Material and Methods
The study was conducted in Jaboticabal, SP, Brazil, from September 2011 to December 2011.
Two hundred eighty-eight Dekalb White laying hens, ranging in age from 33 to 48 weeks, were used. The birds were divided by age into four periods of 28 days (33-36, 37-40, 41-44 and 45-48 weeks). The birds were allotted according to body weight and egg production to provide the same conditions for all treatments at the beginning of the trial. Diets with the tested levels of met+cys were provided a week before data collection began to allow the birds to adapt to the experimental diets. The birds were housed in a conventional poultry facility with a width of 3 m and a height of 2 m that accommodated cages with galvanised wire. These cages were divided into four compartments measuring 25 × 40 × 40 cm. The cages were arranged laterally in two levels (0.80 cm distant from the floor) and were equipped with galvanised feeders covering the entire length of the front cage coupled with nipple drinkers. The management and light program followed the recommendations of the strain’s guide, using 16 h of continuous light.
Eight treatments (levels of met+cys and the control treatment) were distributed in a completely randomised design with six replicates of six hens per replicate. The levels of met+cys in the test diets were obtained using the dilution technique consisting of blending a high-protein (summit) diet with a protein-free diet (Fisher and Morris, 1970). The minimum content of all amino acids in the summit diet, other than the test amino acid, was specified as 1.5 times the recommendations based on Rostagno et al. (2011), and the level of the test amino acids was maintained at 1.3 times the latter recommendations (Table 1). The purpose of this arrangement was to provide a relative deficiency of met+cys. The treatments of each of the test amino acids required in the test diets were obtained by mixing a high summit diet with a protein-free diet (Table 2). A control treatment was included in the experiment and was obtained by adding a small quantity of the synthetic DL-methionine (99 %) to the level 1 diet (1.37 g kg−1 met+cys) so that the
content of the test amino acid was the same as that in the level 2 (2.75 g kg−1 met+cys) diet but the other nutrients
were the same as in the lowest dilution.
The data for egg production (%), egg weight (g), egg mass (g/bird d), feed intake (g/bird d) and feed conversion per mass were evaluated for each period. Egg production was calculated daily based on the number of birds per replicate, and the egg weight (g) was measured three times a week. These data were used to calculate the egg mass
(g/bird d). Feed intake (g/bird d) was measured at the end of each week, and these data were used to calculate the feed conversion per mass.
The assumptions of normality and homoscedasticity were tested by the Cramer-Von Mises and Levene tests, respectively. If the sphericity of the matrix structure of variance and covariance between the periods by PROC GLM was verified, the data were analysed as repeated measures by the PROC MIXED procedure using SAS (Statistical Analysis System, version 9.2). This analysis
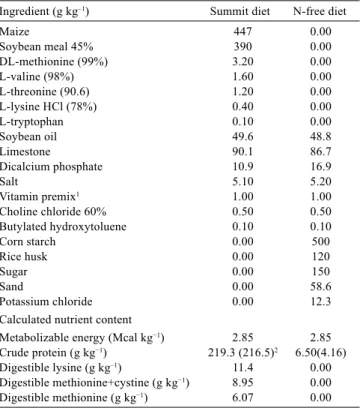
Table 1 - Composition of the summit (high-protein) and nitrogen-free diets used in the response experiments
Ingredient (g kg–1) Summit diet N-free diet
Maize 447 0.00
Soybean meal 45% 390 0.00
DL-methionine (99%) 3.20 0.00
L-valine (98%) 1.60 0.00
L-threonine (90.6) 1.20 0.00
L-lysine HCl (78%) 0.40 0.00
L-tryptophan 0.10 0.00
Soybean oil 49.6 48.8
Limestone 90.1 86.7
Dicalcium phosphate 10.9 16.9
Salt 5.10 5.20
Vitamin premix1 1.00 1.00
Choline chloride 60% 0.50 0.50
Butylated hydroxytoluene 0.10 0.10
Corn starch 0.00 500
Rice husk 0.00 120
Sugar 0.00 150
Sand 0.00 58.6
Potassium chloride 0.00 12.3
Calculated nutrient content
Metabolizable energy (Mcal kg−1) 2.85 2.85
Crude protein (g kg−1) 219.3 (216.5)2 6.50(4.16)
Digestible lysine (g kg–1) 11.4 0.00
Digestible methionine+cystine (g kg−1) 8.95 0.00
Digestible methionine (g kg−1) 6.07 0.00
1 Content/kg: vit A - 7,500,000 IU; vit E - 5,000 IU; vit B1 - 1,800 mg; vit B2 - 4,000 mg; vit B6 - 3,500 mg; vit B12 - 7,500 mcg; pantothenic acid - 15 g; vit B3 - 35 g; selenium - 250 mg; antioxidant - 250 mg; excipient 87.0439%; manganese - 65 g; iron - 45 g; zinc - 50 g; copper - 7,500 mg; iodine - 700 mg.
2 Numbers in parentheses refer to the analysed composition (N*6.25).
Treatment Summit Protein-free Met+cys1
7 1.00 0.00 8.95
6 0.89 0.11 7.92
5 0.77 0.23 6.89
4 0.62 0.38 5.51
3 0.46 0.54 4.14
2 0.31 0.69 2.75
1 0.15 0.85 1.37
Control 0.15 0.85 +1.382
1 Digestible amino acids in g kg–1.
2Amount of amino acids added to control treatment.
demonstrates the effect of the increasing levels of met+cys at different periods, in addition to determining the structure of the covariance matrix.
For the selection of the covariance matrix, the following structure was used: ante-dependence (ANTE(1)), autoregressive (AR(1)), heterogeneous autoregressive (AHR(1)), ARMA (1,1) (ARMA(1,1)), compound symmetric (CS), heterogeneous compound symmetric (CSH), no factor analytic (FAO), factor analytic (FA), Huynh-Feldt (HF), Toeplitz (TOEP), heterogeneous Toeplitz (TOEPH), unstructured (UN), banded (UNAR), unstructured corrs (UNR), and variance components (VC). The best structure was determined by the AKAIKE criterion.
If the sphericity of the matrix structure of variance and covariance between the periods by PROC GLM was not verified, the data were analysed as a split-plot design with the PROC GLM procedure using SAS (Statistical Analysis System, version 9.2.).
The digestible met+cys requirements were estimated by regression analyses using Broken-Line and Quadratic models, as well as using the combination of both models. The studied variables were considered as dependent on the digestible met+cys intake.
The equation for the Broken Line model is as follows: Ŷi = L + U × (R−(met+cys)i) + εi
i =1, 2, ..., n1, n1+1, ..., n
where (R−(met+cys)i) = 0 for i ≥ n1+1 and n1 is the number
of the observations until the breaking point; n is the number of pairs of observations; Ŷi is the estimated value of the
variable studied for the i-level of digestible met+cys in the diet; met+cysi is the met+cys intake; L is the value of the
estimated variable in the stable area (plateau); U is the slope of the ascending line; R is met+cys intake in the breaking point; and εiis the error or deviation related to the distance between the observed value (Yi) and the predicted value (Ŷi) by the model.
The equation for the quadratic polynomial is as follows: Ŷi = β0 + β1 × (met+cys)i + β2 × (met+cys)i2 + ε
i,
in which β0 is the constant of the regression or the intercept;
β1 is the parameter of the regression for the linear component; and β2 is the parameter for the quadratic component.
The optimal met+cys intake was estimated by the Broken Line model at the point where the ascending line converged to a stable line or plateau. In the Quadratic model, these levels were obtained by equalling the first derivative of the equation to zero. The first intercept of the Quadratic model with the plateau of the Broken Line as proposed by Baker et al. (2002) was obtained using the following equation:
= β0 + β1 × (met+cys)i + β2 × (met+cys)i2. The corresponding
met+cys intake was estimated using the following equation (Sakomura and Rostagno, 2007):
Results and Discussion
The dilution technique allowed for the determination of the response of laying hens as a function of different met+cys intakes and the description of the curve response. Performances regarding the control treatment were significantly higher than those in the first treatment (1.37 g kg−1 met+cys),
the lowest dilution in the series, confirming that the amino acids tested were limiting in each tested treatment.
Significant differences were observed concerning the interaction between the level and period of met+cys for all variables, except for feed conversion per mass. These results indicate the possibility to explore the requirement of met+cys for each period and its beneficial contribution to the producer.
Both the increase in feed intake with the highest four met+cys levels as well as the decrease in feed intake with the lowest met+cys levels were due to the amino acid intake, corroborating the results of other studies that tested the same amino acids using the same methodology (Fisher and Morris, 1970; Pilbrow and Morris, 1974; Huyghebaert and Butler, 1991).
The increase in feed intake is an attempt by the birds to consume the required amount of the limiting amino acid to maintain egg production; however, when the deficiency becomes more severe, an increasing feed intake is not possible because the bird would increase heat production (Bowmaker and Gous, 1991). The latter finding is due to the change in the relationship between energy and protein in the diets, which provided more energy intake than necessary to maintain egg production with the lowest met+cys levels. Thus, reducing the feed intake with the lowest met+cys levels was considered a tool to prevent the energy imbalance that would be created if the bird continued consuming diets with a low concentration of amino acids.
response to the amino acid intake at each level tested. This result is in agreement with that reported by other authors (Harms and Damron, 1969; Fisher and Morris, 1970).
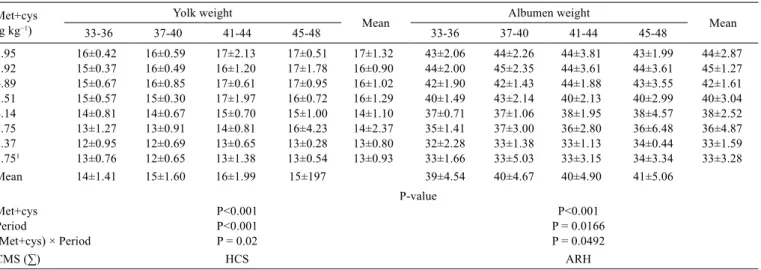
Different egg weights were obtained as a function of met+cys intake, but this variable was only slightly affected (Table 4). The same result was observed by other researchers (Fisher and Morris, 1970; Jordão Filho et al., 2006; Barbosa et al., 2010). The egg weight was also observed to increase over time (P<0.001) because of weight gain in the egg components (Table 5). According to Johnston and Gous (2007), the egg weight increases with the age of the hen but at different rates, so the yolk weight increased at a higher rate. Additionally, methionine participates in the synthesis of phospholipids and thus affects yolk formation (Tsiagbe et al., 1988).
Egg mass was reduced as a function of the met+cys level (P<0.001) in the diet (Table 4). Several studies have reported the effect of different met+cys intakes on egg mass (Togashi et al., 2002, Sá et al., 2007; Barbosa et al., 2010). However, the result in the current study was different from that reported by other researchers such as Varela (2009) who used levels greater than 6.84 g kg−1 met+cys. The
significant interaction between the treatment and period (P<0.001) may be explained by influence of the age of the birds on egg weight and egg production, consequently affecting the potential egg-laying.
Different intakes of met+cys affected the feed conversion per mass (P<0.001), but this variable was not affected over time (P = 0.1614) and there was no interaction between the treatment and period (P = 0.3133) (Table 6).
Table 3 - Mean (± standard error) feed intake (g/bird d) and the egg production (%) from 33 to 48 weeks in response to methionine + cystine (met+cys) intake
Met+cys (g kg−1)
Feed intake
Mean Egg production Mean
33-36 37-40 41-44 45-48 33-36 37-40 41-44 45-48
8.95 97±4.31 100±3.23 101±4.41 100±2.67 100±3.78 96±3.44 97±2.10 98±1.05 94±6.05 96±3.82
7.92 95±5.57 101±3.20 100±3.47 99±4.99 99±4.60 95±5.41 96±4.73 97±2.12 93±5.35 95±4.60
6.89 98.±4.46 98±3.62 98±10.1 105±4.74 100±6.65 94±4.54 94±3.85 95±4.50 96±5.71 94±4.43
5.51 100±4.46 104±2.52 105±3.00 106±7.62 104±5.05 92±3.31 95±1.77 94±3.74 93±10.8 93±5.71
4.14 75±6.55 69±6.77 72±6.07 78±7.09 73±7.02 61±11.2 52±6.87 51±7.59 48±7.26 53±9.27
2.75 58±3.45 58±3.50 61±2.35 64±2.98 60±3.74 24±5.05 22±3.02 20±2.47 20±2.39 21±3.70
1.37 58±3.52 45±11.4 38±7.38 31±8.19 43±12.8 7±2.18 5±1.48 2±1.66 2±1.18 4±2.80
2.751 55±4.41 53±3.05 39±6.02 33±5.25 45±10.3 11±5.42 12±6.67 4.±1.66 3±0.84 7±5.84
Mean 83±18.4 83±23.5 82±24.5 84±26.8 67±35.5 66±37.2 65±38.3 63±38.1
P-value
Met+cys P<0.001 P<0.001
Period P = 0.5517 P = 0.0022
(Met+cys) × Period P = 0.001 P = 0.0165
CMS (∑) NS HCS
1 Control treatment was not considered for the statistical analysis.
CMS - covariance matrix structure; NS - not significant for the sphericity test; HCS - heterogeneous compound symmetric.
Table 4 - Mean (± standard error) egg weight (g/d) and egg mass (g/bird d) from 33 to 48 weeks in response to methionine + cystine (met+cys) intake
Met+cys (g kg−1)
Egg weight
Mean Egg mass Mean
33-36 37-40 41-44 45-48 33-36 37-40 41-44 45-48
8.95 64±1.66 66±1.70 67±1.77 67±1.75 66±1.85 62±2.46 64±1.74 66±1.32 62±4.15 63±2.86
7.92 65±1.26 66±1.03 68±1.81 67±1.87 66±1.92 61±3.85 63±3.69 66±2.84 62±4.63 63±3.94
6.89 64±2.36 64±1.19 65±0.59 65±2.22 65±1.88 60±4.47 60±3.09 62±2.66 63±4.74 61±3.80
5.51 61±1.02 62±0.98 63±1.30 63±1.94 62±1.51 57±1.23 59±0.91 59±2.43 56±6.83 58±3.59
4.14 57±0.92 57±1.62 58±1.75 58±1.24 58±1.52 34±6.12 29±3.87 30±4.08 28±3.84 30±5.00
2.75 50±5.40 54±1.10 54±1.57 54±2.76 53±3.37 13±3.72 11±2.04 11±1.69 11±1.39 11±2.36
1.37 48±3.46 48±1.65 48±1.82 49±1.73 48±2.26 5±1.57 3±0.92 1.9±0.48 2.1±1.65 3±1.55
2.751 50±2.01 50±3.84 48±2.07 47±2.49 49±2.97 6±3.14 7±6.53 2.3±0.85 1.5±0.35 4±3.28
Mean 58±6.99 60±6.33 61±6.98 60±6.54 42±23.3 41±24.8 42±25.9 41±24.9
P-value
Met+cys P<0.001 P<0.001
Period P<0.001 P = 0.1544
(Met+cys) × Period P = 0.0561 P = 0.0056
CMS (∑) FA HCS
1 Control treatment was not considered for the statistical analysis.
The effect of met+cys intake on the feed conversion per mass (P<0.001) was also observed in other studies (Togashi et al., 2002; Jordão Filho et al., 2006; Safaa et al., 2008). This variable depends on feed intake and egg production, which was influenced by the different met+cys intakes (Togashi et al., 2002). In contrast to the results of this study, some authors observed no significant differences in this variable (Pavan et al., 2005). The values of feed conversion per mass were higher with lower levels of met+cys, which was most likely caused by the low protein content in this diet test (Harper et al., 1970). This is a result of the dilution technique used in this study to explore the dynamic response because the beginning of the response curve to the stable area provided a better fit of the models.
A significant interaction between the tested levels and periods confirmed that egg mass changed over time. Thus, for each period, the Broken Line (BL), Quadratic (Q) and Broken Line + Quadratic (BL + Q) models were fitted to the data of the egg mass and the feed conversion to determine the met+cys intake and to optimise these responses. The feed conversion was not affected by the interaction between the period and treatment; thus, these models were adjusted for the average response of the entire study period (33 to 48 weeks). These variables were fitted by the models due to the economic importance of determining the optimal level.
The results for the feed conversion per mass, obtained by the equation BL, BL + Q and Q (Table 7), differed from each other due to the nature of the models used (Oviedo-Rondón and Waldroup, 2002; Siqueira et al., 2009). The
Table 5 - Mean value (± standard error) of yolk weight (g) and albumen weight (g) from 33 to 48 weeks in response to methionine + cystine (met+cys) intake
Met+cys (g kg−1)
Yolk weight
Mean Albumen weight Mean
33-36 37-40 41-44 45-48 33-36 37-40 41-44 45-48
8.95 16±0.42 16±0.59 17±2.13 17±0.51 17±1.32 43±2.06 44±2.26 44±3.81 43±1.99 44±2.87
7.92 15±0.37 16±0.49 16±1.20 17±1.78 16±0.90 44±2.00 45±2.35 44±3.61 44±3.61 45±1.27
6.89 15±0.67 16±0.85 17±0.61 17±0.95 16±1.02 42±1.90 42±1.43 44±1.88 43±3.55 42±1.61
5.51 15±0.57 15±0.30 17±1.97 16±0.72 16±1.29 40±1.49 43±2.14 40±2.13 40±2.99 40±3.04
4.14 14±0.81 14±0.67 15±0.70 15±1.00 14±1.10 37±0.71 37±1.06 38±1.95 38±4.57 38±2.52
2.75 13±1.27 13±0.91 14±0.81 16±4.23 14±2.37 35±1.41 37±3.00 36±2.80 36±6.48 36±4.87
1.37 12±0.95 12±0.69 13±0.65 13±0.28 13±0.80 32±2.28 33±1.38 33±1.13 34±0.44 33±1.59
2.751 13±0.76 12±0.65 13±1.38 13±0.54 13±0.93 33±1.66 33±5.03 33±3.15 34±3.34 33±3.28
Mean 14±1.41 15±1.60 16±1.99 15±197 39±4.54 40±4.67 40±4.90 41±5.06
P-value
Met+cys P<0.001 P<0.001
Period P<0.001 P = 0.0166
(Met+cys) × Period P = 0.02 P = 0.0492
CMS (∑) HCS ARH
1 Control treatment was no considered for the statistical analysis.
CMS - covariance matrix structure; HCS - heterogeneous compound symmetric; ARH - heterogeneous autoregressive.
Table 6 - Mean (± standard error) feed conversion per egg mass (g/g) from 33 to 48 weeks in response to methionine + cystine (met+cys) intake
Met+cys (g kg−1)
Feed conversion
Mean
33-36 37-40 41-44 45-48
8.95 1.61±0.06 1.57±0.06 1.57±0.09 1.54±0.10 1.57±0.08
7.92 1.56±0.03 1.59±0.09 1.52±0.07 1.61±0.05 1.57±0.08
6.89 1.65±0.06 1.63±0.04 1.58±0.19 1.68±0.08 1.64±0.11
5.51 1.77±0.07 1.79±0.05 1.78±0.03 1.82±0.12 1.79±0.07
4.14 2.22±0.27 2.38±0.24 2.43±0.17 2.86±0.35 2.47±0.35
2.75 5.16±2.10 5.28±0.69 5.84±0.86 6.14±0.63 5.61±1.22
1.37 14.1±4.88 16.5±5.56 20.5±3.89 18.7±7.90 17.4±5.77
2.751 12.25±5.98 9.83±3.74 19.44±8.36 24.36±7.78 16.5±8.60
Mean 4.01±4.73 4.39±5.50 5.03±6.69 4.91±6.10
P-value
Met+cys P<0.001
Period P<0.1614
(Met+cys) × Period P = 0.3133
CMS (∑) NS
1 Control treatment was not considered for the statistical analysis.
estimated value by the Q model was closely related to that reported in the literature. However, the estimated values by the BL and BL + Q models were different from those reported in the literature due to the extreme values obtained in the first and second treatment tested as result of the technique of formulation aiming to obtain a large response in the curve response.
The different results of the equations for the egg mass for each period (Table 8) depended on the characteristics of each model used.
R2 is a coefficient of determination, and its value was
close to one, indicating a good fit of the models. However, the BL + Q model was chosen to determine the met+cys intake to obtain the maximum response in the first intercept of the Q model curve and the plateau of the BL model, an observation that is a big advantage because the result is free of the characteristics of each model (Sakomura and Rostagno, 2007).
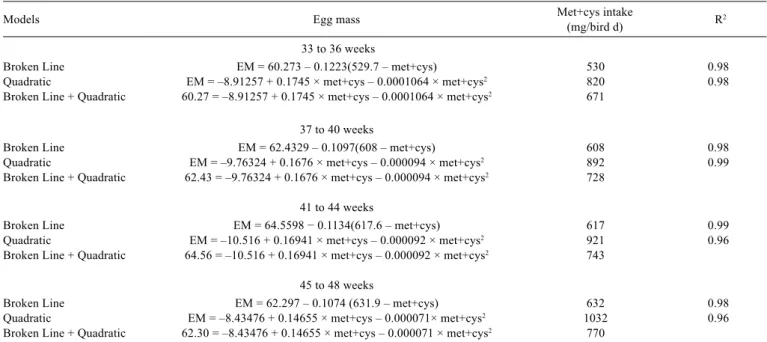
During the first period, the met+cys intakes to optimise the egg mass were 530, 820 and 671 mg/bird d by the BL, Q and BL + Q models, respectively, for 60- and 63-g egg mass as a maximum value.
The differences in the results might be attributed to the characteristics of each model (Siqueira et al., 2009). The lowest values were obtained using the BL model, and this result is a function of the abrupt plateau and did not consider the law of economic returns (Baker, 1986). However, the greatest value was determined by the Q model, which considered symmetrical responses to the nutrient deficiency and excess. Given these disadvantages, the BL + Q model was used because it presented intermediate values between the BL and Q models (Sakomura & Rostagno, 2007).
The BL + Q model in the second, third and fourth periods estimated 728, 743 and 770 mg/bird d met+cys intakes to reach 62.43, 64.56 and 62.30 g, respectively, for the egg mass.
The results showed that the intake of digestible met+cys increased by approximately 100 mg/bird d between 33 and 48 weeks. This increase may be due to an increase in the maintenance requirement as a function of the age of the bird estimated by the BL model as 37, 39, 48 and 52 mg/bird d for the first, second, third and fourth periods, respectively, considering that this model describes the individual response well.
Table 7 - Fitted equations by the Broken Line, Quadratic and Broken Line + Quadratic models for the feed conversion per mass (FC) from 33 to 48 weeks in response to methionine + cystine (met+cys) intake
Models Feed conversion per mass Met+cys intake (mg/bird d) R2
Broken Line FC = 1.7228 – 0.0927 × (222.6 – met+cys) 223 0.97
Quadratic FC = 13.17104 – 0.03711 × met+cys + 0.0000279 × met+cys2 665 0.81
Broken Line + Quadratic 1.7228 = 13.17104 – 0.03711 × met+cys + 0.0000279 × met+cys2 486
Table 8 - Fitted equations by the Broken Line, Quadratic and Broken Line + Quadratic models for egg mass (EM) from 33 to 48 weeks in response to methionine + cystine (met+cys) intake
Models Egg mass Met+cys intake (mg/bird d) R2
33 to 36 weeks
Broken Line EM = 60.273 – 0.1223(529.7 – met+cys) 530 0.98
Quadratic EM = –8.91257 + 0.1745 × met+cys – 0.0001064 × met+cys2 820 0.98
Broken Line + Quadratic 60.27 = –8.91257 + 0.1745 × met+cys – 0.0001064 × met+cys2 671
37 to 40 weeks
Broken Line EM = 62.4329 – 0.1097(608 – met+cys) 608 0.98
Quadratic EM = –9.76324 + 0.1676 × met+cys – 0.000094 × met+cys2 892 0.99
Broken Line + Quadratic 62.43 = –9.76324 + 0.1676 × met+cys – 0.000094 × met+cys2 728
41 to 44 weeks
Broken Line EM = 64.5598 − 0.1134(617.6 – met+cys) 617 0.99
Quadratic EM = –10.516 + 0.16941 × met+cys – 0.000092 × met+cys2 921 0.96
Broken Line + Quadratic 64.56 = –10.516 + 0.16941 × met+cys – 0.000092 × met+cys2 743
45 to 48 weeks
Broken Line EM = 62.297 – 0.1074 (631.9 – met+cys) 632 0.98
Quadratic EM = –8.43476 + 0.14655 × met+cys – 0.000071× met+cys2 1032 0.96
The optimal digestible met+cys intake for the four periods was high compared with those reported in the literature (Togashi et al., 2002; Sá et al., 2007; Barbosa et al., 2010). The difference in those results is related to the type of methodology, and the analysis in the current study was used for each period and not for the overall study period. However, the results of those authors were very close to those found in the present study for the last three periods.
Conclusions
According to the Broken Line + Quadratic model, the intake of digestible methionine + cystine optimises the responses of birds for the periods 33-36, 37-40, 41-44 and 45-48 weeks to 671, 728, 743 and 770 mg/bird d, respectively.
Acknowledgments
The authors thank Fundação de Apoio à Pesquisa do Estado de São Paulo (FAPESP) for financing the research and Programa de Estudantes-Convênio de Pós-Graduação (PEC-PG) for the research grant.
References
Baker, D. H. 1986. Problems and pitfalls in animal experiments designed to establish dietary requirements for essential nutrients. The Journal of Nutrition 116:2339-2349.
Baker, D.; Batal, A.; Parr, T.; Augspurger, N. and Parsons, C. 2002. Ideal ratio (relative to lysine) of tryptophan, threonine, isoleucine, and valine for chicks during the second and third weeks posthatch. Poultry Science 81:485-494.
Barbosa, M. J. B.; Cardozo, R. M.; Souza, V. L. F. and Rickli, M. E. 2010. Níveis de metionina + cistina no desempenho de poedeiras comerciais leves 45 semanas de idade. Revista Brasileira Saúde Produção Animal 10:1032-1039.
Bowmaker, J. E. and Gous, R. M. 1991. The response of broiler breeder hens to dietary lysine and methionine. British Poultry Science 32:1069-1088.
Bunchasak, C. 2009. Role of dietary methionine in poultry production. The Journal of Poultry Science 46:169-179.
Fisher, C. and Morris, T. R. 1970. The determination of the methionine requirement of laying pullets by a diet dilution technique. British Poultry Science 11:67-82.
Gous, R. M. and Morris, T. R. 1985. Evaluation of a diet dilution technique for measuring the response of broiler chickens to increasing concentrations of lysine. British Poultry Science 26:147-161.
Harms, R. H. and Damron, B. L. 1969. Protein and sulfur amino acid requirement of the laying hen as influenced by dietary formulation. Poultry Science 48:144-149.
Harper, A. E.; Benevenga, N. J. and Wohlhueter, R. M. 1970. Effects of ingestion of disproportionate amounts of amino acids. Physiological Reviews 50:428-558.
Huyghebaert, G. and Butler, E. A. 1991. Optimum threonine requirement of laying hens. British Poultry Science 32:575-582. Johnston, S. A. and Gous, R. M. 2007. Modelling the changes in the
proportions of the egg components during a laying cycle. British Poultry Science 48:347-353.
Jordão Filho, J.; Silva, J. H. V. D.; Silva, E. L. D.; Ribeiro, M. L. G.; Martins, T. D. D. and Rabello, C. B. V. 2006. Exigências nutricionais de metionina+cistina para poedeiras semipesadas do início de produção até o pico de postura. Revista Brasileira de Zootecnia 35:1063-1069.
Liebert, F. and Benkendorff, K. 2007. Modeling lysine requirements of Oreochromis niloticus due to principles of the diet dilution technique. Aquaculture 267:100-110.
Oviedo-Rondón, E. O. and Waldroup, P. W. 2002. Models to estimate amino acid requirements for broiler chickens. International Journal of Poultry Science 1:106-113.
Pavan, A. C.; Móri, C.; Garcia, E. A.; Scherer, M. R. and Pizzolante, C. C. 2005. Níveis de proteína bruta e de aminoácidos sulfurados totais sobre o desempenho, a qualidade dos ovos e a excreção de nitrogênio de poedeiras de ovos marrons. Revista Brasileira de Zootecnia 34:568-574.
Pilbrow, P. J. and Morris, T. R. 1974. Comparison of lysine requirements amongst eight stocks of laying fowl. British Poultry Science 15:51-73.
Rostagno, H. S.; Albino, L. F. T.; Donzele, J. L.; Gomes, P. C.; Oliveira, R. F.; Lopes, D. C.; Ferreira, A. S.; Barreto, S. L. T. and Euclides, R. F. 2011. Tabelas brasileiras para aves e suínos: composição de alimentos e exigências nutricionais. 3.ed. UFV, Viçosa, MG. Sá, L. M.; Gomes, P. C.; Albino, L. F. T.; Rostagno, H. S. and Nascif,
C. C. C. 2007. Exigência nutricional de metionina + cistina digestível para galinhas poedeiras no período de 34 a 50 semanas de idade. Revista Brasileira de Zootecnia 36:1837-1845.
Safaa, H. M.; Serrano, M. P.; Valencia, D. G.; Frikha, M.; Jimenez-Moreno, E. and Mateos, G. G. 2008. Productive performance and egg quality of brown egg-laying hens in the late phase of production as influenced by level and source of calcium in the diet. Poultry Science 87:2043-2051.
Sakomura, N. K. and Rostagno, H. S. 2007. Métodos de pesquisa em nutrição de monogástricos. 1.ed. Funep, Jaboticabal.
Shafer, D. J.; Carey, J. B.; Prochaska, J. F. and Sams, A. 1998. Dietary methionine intake effects on egg component yield, composition, functionality, and texture profile analysis. Poultry Science 77:1056-1062.
Siqueira, J. C. D.; Sakomura, N. K.; Nascimento, D. C. N. and Fernandes, J. B. K. 2009. Modelos matemáticos para estimar as exigências de lisina digestível para aves de corte ISA Label. Revista Brasileira de Zootecnia 38:1732-1737.
Togashi, C. K.; Fonseca, J. B.; Soares, R. D. T. R. N and Souza, C. L. M. D. 2002. Determinação de níveis de metionina+cistina para poedeiras semi-pesadas alimentadas com rações contendo levedura seca (Saccharomyces cerevisiae). Revista Brasileira de Zootecnia 31:1426-1433.
Tsiagbe, V. K.; Cook, M. E.; Harper, A. E. and Sunde, M. L. 1988. Alterations in phospholipid composition of egg yolks from laying hens fed choline and methionine-supplemented diets. Poultry Science 67:1717-1724.