UNIVERSIDADE
DE
LISBOA
FACULDADE DE CIÊNCIAS
DEPARTAMENTO DE INFORMÁTICA
IPTV LOG EVENTS PROFILING
Francisco José Lopes Lameira
Mestrado em Segurança Informática
UNIVERSIDADE
DE
LISBOA
FACULDADE DE CIÊNCIAS
DEPARTAMENTO DE INFORMÁTICA
IPTV LOG EVENTS PROFILING
Francisco José Lopes Lameira
Tese orientada pelo Prof. Doutor Hyong Kim e co-orientada pelo Prof. Doutor António CasimiroMestrado em Segurança Informática
I
Resumo
O objectivo central da análise de logs é adquirir novos conhecimentos que ajudem os administradores de sistemas a compreender melhor o modo como os seus sistemas estão sendo usados. As redes de telecomunicações constituem uma das áreas onde a quantidade de dados de log registados é enorme e onde, na maioria das vezes, apenas uma ínfima parte desses dados é analisada. Isso coloca importantes perguntas a um gestor de rede: Devem continuam a registar esses dados? Existe alguma informação relevante que possa ser extraída a partir desses dados? Os métodos para a extrair já existem? Poderemos melhorar a operação e a gestão, se essa informação estivesse disponível? Só após responder a estas perguntas é que um gestor pode decidir o que fazer com um log de dados que consuma imensos recursos.
A finalidade principal do nosso trabalho é analisar o tipo de informações adicionais que possam ser extraídas dos arquivos de log dos servidores de uma plataforma de IPTV. O nosso foco específico é tentar compreender se é possível determinar quais as sequências de eventos que são despoletadas na plataforma quando um cliente executa uma determinada acção. Essas sequências são desconhecidas para nós e não são documentadas pelo fornecedor de software. Para este trabalho escolhemos a sequência de “arranque" que o utilizador despoleta quando inicializa a sua set‐top‐box (STB).
Caracterizamos totalmente essa sequência de pedidos web services que uma STB realiza durante a fase de arranque e autenticação na plataforma IPTV. De seguida, desenvolvemos um método que pode ser aplicado automaticamente para isolar essas sequências nos logs de dados em bruto. Esse método começa por definir o evento de início e depois tenta identificar o evento final da sequência aplicando um conjunto de regras empíricas definidas por nós. Todos os eventos entre aqueles dois constituem a sequência e, embora a maioria deles sejam mandatórios, existem alguns eventos que ocorrem apenas em certos casos, devido às características particulares de cada STB. Finalmente, e depois de isolar as sequências, realizamos uma análise estatística a fim de validar a exactidão do nosso método de identificação/isolamento.
A metodologia é desenvolvida e avaliada utilizando um conjunto de dados reais de uma plataforma de IPTV pertencente a uma empresa de telecomunicações. Os resultados confirmam que o método escolhido pode produzir um resultado com um alto nível de precisão, tendo em conta as características específicas dos dados de entrada. Com o conhecimento adicional que este método pode extrair dos logs de dados, os gestores e os engenheiros de rede podem caracterizar melhor os vários utilizadores que estão usando a plataforma, estabelecendo perfis típicos para as sequências de eventos e isolando as sequências anormais para que as mesmas possam ser alvo de análise adicional em termos técnicos ou de segurança.
Palavras‐chave: Análise de logs IPTV, correlação de logs de servidores, sequenciação de eventos,
eventos periódicos e únicos, sequência de arranque de STB
II
Abstract
The central goal of log analysis is to acquire new knowledge which will help systems administrators to better understand how their systems are being used. Telecommunications networks are one of those areas where the amount of logged data is huge and, most of the times, only parts of it are analyzed. That presents big questions to a network manager: Should they continue to log the data? Is there any relevant information that can be extracted from that data? The methods to extract it already exist? Could operations and management be improved if that information was available? Only by answering these questions can a manager decide what to do with the logging of data that consumes lots of resources.
The main objective of our work is to analyze what type of additional information can be extracted from the server log files of an IPTV platform. Our specific focus is in trying to understand if it is possible to determine what sequences of events are triggered at the platform when a client executes a certain action. These sequences are unknown to us and are not documented by the software provider. For this work, we choose the “boot‐up action” that the user performs when he powers‐on his set‐top‐box (STB).
We fully characterize that sequence of web service requests that an STB performs while booting up and logging into the IPTV platform. Then, we develop a method that can be automatically applied to isolate those sequences in the logs raw data. This method starts by defining the start event and then tries to identify the sequence’s end event by applying a set of empirical rules defined by us. The events in between constitute the sequence and while most of them are mandatory there are some events that only occur in certain cases due to the characteristics of a particular STB. Finally, after isolating the sequences, we perform a statistical analysis in order to validate the accuracy of our identification/isolation method. The methodology is developed and evaluated using a real dataset from a telecommunications company’s IPTV platform. The results confirm that the chosen method can produce an output with a high level of accuracy, taking into account the specific characteristics of the input logs data. With the additional knowledge that this method can extract from the logs data, network managers and engineers can better characterize the many users that are using the platform, establishing the typical sequence of events profiles and isolating the anomalous ones for further inspection focused both on technical and security concerns.
Keywords: IPTV logs analysis, server logs correlation, events sequencing, periodic and one‐time
events, STB boot‐up sequence
III
Acknowledgments
I would like to thank Professor Hyong Kim for his guidance and advice. His experience in ensuring a focus was essential to guarantee that the thesis was doable in the available timeframe. I would also like to thank Professor António Casimiro for helping in making this document a better reading experience. To my colleagues from MSIT‐IS class of 2009/2010, for all the friendship and mutual motivation, with a special note to the ones who adventured with me to Pittsburgh. To João Ferreira for all the long Internet chat discussions and advice. To my family and friends who provided encouragement. I hope you did not forget me by now. A very special thanks to Ana’s parents for all their support and patience.
V Dedicated to Ana and our girls
VII
Contents
1 Introduction ... 1 1.1 Motivation ... 1 1.2 Contributions... 1 1.3 Report structure ... 2 2 Background ... 3 2.1 IPTV platform... 3 2.1.1 High‐Level Architecture... 3 2.1.2 Servers... 4 2.1.3 Service Groups ... 4 2.1.4 Definitions ... 5 2.2 Summary... 5 3 Related work ... 7 3.1 Transactional log analysis ... 7 3.2 Other researched techniques... 7 3.3 Our approach... 8 4 Dataset ... 11 4.1 Dataset characteristics ... 11 4.1.1 Limitations... 13 4.1.2 Pre‐processing... 13 4.2 Data analysis... 13 4.2.1 Data ... 14 4.3 Summary... 16 5 Data preparation... 17 5.1 First analyses ... 17 5.2 Periodic events ... 19 5.3 Cache refreshment events ... 21 5.4 Subscriber related events... 23 5.5 Summary... 26 6 Identifying the boot‐up sequence ... 27 6.1 Sequence isolation... 27 6.1.1 Filtering the events ... 27 6.1.2 The starting event ... 28 6.1.3 Did we find the last event? ... 30 6.2 Sequence characterization ... 31 6.3 Summary... 33 7 Results and their validation ... 35 7.1 Results ... 35 7.1.1 Mandatory events ... 35 7.1.2 Optional events ... 37 7.1.3 Sequence duration ... 38 7.2 Validation of the results ... 39 8 Future work... 41 9 Conclusion... 43 10 References ... 45IX
List of Figures
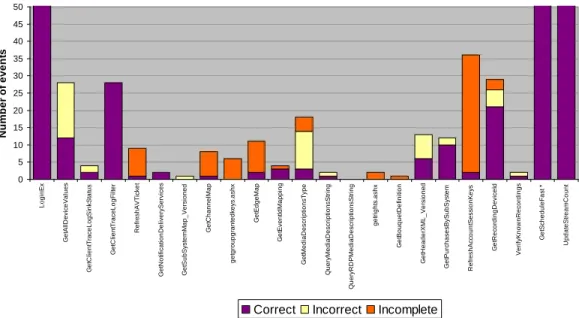
Figure 1 ‐ Functional high‐level diagram... 3 Figure 2 ‐ Major groups of distinct URI Stem + URI Query ... 17 Figure 3 ‐ Periodic events... 19 Figure 4 ‐ Periods where the first daily event occur ... 20 Figure 5 ‐ Some of daily cache refresh events ... 21 Figure 6 ‐ Other daily cache refresh events ... 22 Figure 7 ‐ RefreshAccountSessionKeys refresh event... 23 Figure 8 ‐ Two of the subscriber related events ... 24 Figure 9 ‐ Two correlated events (probably associated with VOD sessions)... 25 Figure 10 ‐ Some of the events exclusively related with the LoginEx event... 25 Figure 11 ‐ Distribution of event types ... 26 Figure 12 ‐ Percentage of events in STBs with the LoginEx event ... 28 Figure 13 ‐ Distribution of each type of events (in relation to the 1st LoginEx event)... 29 Figure 14 ‐ Boot‐up sequence of events ... 32 Figure 15 ‐ Distribution of event types (after isolating the boot‐up events)... 33 Figure 16 ‐ Boot‐up sequences classification... 35 Figure 17 ‐ Boot‐up sequences duration ... 38 Figure 18 ‐ Sequences classification per end event (events >50 not shown)... 40XI
List of Tables
Table 1 ‐ Server functions ... 4 Table 2 ‐ Tracesink log entry fields ... 11 Table 3 ‐ IIS log entry fields ... 12 Table 4 ‐ ELS Boot log entry fields... 13 Table 5 ‐ System events in tracesink logs (for one SG ‐ June 28th, 2010) ... 14 Table 6 ‐ All the distinct URI Stems in the IIS log ... 18 Table 7 ‐ Period duration of the periodic events (graphics) ... 20 Table 8 ‐ Period duration of the periodic events (analytical) ... 21 Table 9 ‐ Periods of these refresh events ... 22 Table 10 ‐ Boot‐up sequence timeline ... 30 Table 11 ‐ Total of boot‐up sequences ... 35 Table 12 ‐ Boot‐up sequences classification details ... 36 Table 13 ‐ Boot‐up sequences that have only LoginEx events... 37 Table 14 ‐ Number of STBs that have LoginEx‐only boot‐up sequences ... 37 Table 15 ‐ Optional events ... 38 Table 16 ‐ Correspondence between our results and the ELS Boot Log... 39 Table 17 ‐ Accuracy of our method in identifying the limit events (boot‐up sequence)... 40XIII
Abbreviations
CFA Client Facing Application server CGW Client Gateway server DVR Digital video recorder ELS External Login Server EPG Electronic Program Guide IIS Internet Information Services IPTV Internet Protocol television RDP Remote Desktop Protocol SG Service Group STB Set‐Top Box TLA Transaction Log Analysis VOD Video‐on‐demand WS Web Service1
1 Introduction
1.1 Motivation
The operations and management of telecommunications networks are based on the data that their network elements continuously provide. This data is usually very diverse due to the complexity of multivendor systems involved in large networks. A small part of this data is presented in online operations monitoring systems, where it provides an overall image of the performance and quality of the service of the various network components, but most of it is compressed and archived in offline storages. Whenever there is an unusual event that requires an immediate and detailed analysis, the recent history data has to be fetched from the storage system and decompressed before it can be analyzed. This kind of online decision‐making analysis presents big challenges for data mining methods and knowledge discovery processes. Also, the complexity of the telecommunications networks has been rapidly growing due to the new services that operators are deploying worldwide like richer Internet capabilities, new mobile phone technologies, wireless connectivity and converging old‐technologies into the IP realm. All these new systems together with an increasing number of customers are boosting the amount of data collected. Continuing to extract valid information from these large amounts of data in order to perform or help the decision‐making process of network management is, consequently, becoming an increased challenge for the existing analysis tools and methods. Another factor that must be taken into account is that network managers know much more about network protocols and their tools than about statistics or data mining. So, new approaches may be required besides increasing the processing and storage capacities to allow them to timely extract and analyze all this data.
The IPTV networks are one example of these new networks that produce their own new set of data. This type of networks is strongly supported in information systems and, consequently, allows for the generation of a very diverse set of log data.
Since this is usually supported in a new network solution and its delivery platform is also a new technology for the IPTV deploying operator, its operation managers have much less experience in understanding the inner works of all the involved hardware and all the possible problems that can occur in its operation than with other network architectures. The new architecture can also present, for example, new security vulnerabilities that they are unable to diagnose due to the fact that, being a new technology, all the data‐mining and other detecting processes they are currently using are still ill‐adjusted to this new set of possibilities, requiring additional long term analyses to fine tune them. Combining the increasing amount of generated data with the uncertainty of us knowing all the events that should be looked upon to know what is happening in the platform/network introduces a great challenge in our quest to decide what is the unessential data that we can offline store or delete and the essential data that we must process and present to the network managers in the most online way possible.
1.2 Contributions
In this thesis we study the types of data present in the output log files generated by an IPTV media delivery platform, in order to identify which sequences of events the platform servers execute in responding to a client request (action). The objective is to characterize those sequences and develop a method that allows their automatic identification inside the log files. The challenge is to determine those sequences among large sets of events, possibly unordered, and including uncertain or unrelated events.
2
After identifying all these logged sequences, further information can be extracted by performing all type of statistical analyses.
The contribution of this thesis is threefold:
Identifying the server log file types that have the most useful data for the type of analysis we intend to perform
Several file types were analyzed and we established correlations between them but, the common data was very little due to the big differences of logged information in each type of file. Nonetheless, the Client Gateway (CGW) IIS log file was chosen as the most complete log file listing all the web services requested to the platform by a client STB. We must notice that the subscriber (client) activity log is not considered in this analysis since its contents might not reflect what was really executed by the platform servers. Characterization of the boot‐up sequence of web services requests made by a client STB One of the most important sequences of events that can only be observed in the servers’ logs is the boot‐up sequence. We characterize all the mandatory and optional events that are included in this sequence and provide some statistics of its presence in our dataset. Other sequences may be identified using a similar process, in a future work.
A method for automatically identifying the boot‐up sequence of events
Given the features of the logged data the automatic recognition of these sequences is not a straightforward process, as we will see later. As such, we establish the criteria that should be used in order to obtain a high level of accuracy in the automatic identification of the boot‐up sequences. Similar criteria may be found to enable the identification of other sequences.
1.3 Report structure
This work is organized as follows:Chapter 2 details the relevant background information. The environment section contains information about the IPTV service platform related with this thesis. Chapter 3 contains some of the ideas present on related work and describes how they differ from our own approach. Chapter 4 describes the real dataset that was used to implement and evaluate this work. Chapter 5 describes all the data preparation phase that was necessary to execute in order to prepare the raw data for processing.
In Chapter 6 we present the results from our characterization of the boot‐up sequence of web service requests and detail the method to automatically identify those sequences in the raw log data file.
Chapter 7 analyses the results of our method applied to the whole available log file and performs some validation of their accuracy by comparison with other platform logs.
3
2 Background
This thesis is based on data provided by an IPTV service provider that currently has approximately 1 million subscribers. The following section describes the major software components and server functions of the IPTV platform solution adopted by this provider.
2.1 IPTV platform
In order to deliver its IPTV service this provider chose the Microsoft Mediaroom IPTV solution. Microsoft Mediaroom is a robust platform that allows for the delivery of high‐quality live TV and video on demand (VOD) over diverse IP network infrastructures. It also enables service providers to offer compelling interactive TV services such as Remote Desktop Protocol (RDP) applications, an Electronic Program Guide (EPG), and a digital video recorder (DVR). In June 2010, this IPTV delivery solution was being used by 26 providers worldwide, including some of the leading TV and video service providers.
2.1.1 High‐Level Architecture
The Microsoft Mediaroom system is constituted by a set of software components that are executed over several platform servers. These servers are usually grouped in “functional modules” (for example: the Head‐End, Local, Regional and Branch modules). The servers that are responsible for the interaction with the STB client belong to the Branch Module while the servers that deliver the video streams to the STB are located in the Local Module. In some implementations there can be some interaction between the Microsoft Mediaroom platform and an IPTV provider’s External Login Server (ELS) to help with identity management (login authentication), profile management (profile storage and profile integration) and service discovery of the platform client STB’s. These high‐level interactions are represented in Figure 1. Figure 1 ‐ Functional high‐level diagram4
2.1.2 Servers
The servers that support Microsoft Mediaroom architecture are grouped in the major functions shown in Table 1. Most of these functions are executed by groups of servers in order to provide redundancy and load balancing (as such, a subscriber can invoke an “action” and his STB client will trigger a sequence of web services requests where each of them can be routed to different CGW servers and, every time one of those CGW servers receives a request, it can forward it to a different CFA server, while within the same “action” sequence, etc.)
Server Description
Head‐End Receive the TV signals from the various satellites and encodes the streams.
Acquisition Server (ASVR) Responsible for multicast streaming of Live TV.
Distribution Server (DSVR) Provides Instant Channel Change (ICC) functionality and Reliable UDP (rUDP) for Live TV.
Video Server (VSVR) Supports the Video‐On‐Demand (VOD) functionality. Store VOD content and stream it to the clients.
Client Facing Application (CFA)
Provides all the public Web Services of the IPTV platform. Responsible for client authentication, notifications, STBs software upgrades and distributing Live TV service maps.
Server Facing Application (SFA)
Provides all the internal Web Services of the IPTV platform. Manages T‐ Servers and interacts with the OSS/BSS layer.
Client Gateways (CGW) Routes traffic requests/answers and notifications between the IPTV platform clients and its servers. Terminal Server (TSVR) Works as a RDP gateway for the applications that the clients can access. Sync Server (SYNDIS) Responsible for updating the client's software image if it cannot reach the Bootstrap Web Service. Service Group Database (SGRxDB)
Contains all the databases associated with the client's data and access rights. Server Facing Branch (SFB) Manages all D‐Server and V‐Server activities. Branch Management (BMGMT) Delivers all the tools for the IPTV platform branch's management. Acquisition Controller (ACQ CONTR) Manages all A‐Server activities. VOD Backend Manage‐ ment (VOD MGMT) Provides the web pages and API for VOD management. VOD Importer (VODIMP) Used to import VOD contents into the IPTV platform. Table 1 ‐ Server functions
2.1.3 Service Groups
Another entity worth mentioning in this architecture is the Service group (SG). Service groups are a subset of branch servers that divide the subscriber management tasks to distribute the processing load and provide a way to perform software upgrades with minimal service interruptions. Service groups enable operators to: • Scale up Microsoft Mediaroom systems to accommodate new subscribers. • Prevent service interruptions while performing system upgrades and other regular system maintenance.5
So, all subscribers are divided into several Service groups and each one of those Service groups comprises its own group of servers (CFA, SFA, CGW, TSRV and SGRxDB) fully independent from similar servers of other Service groups.
2.1.4 Definitions
In the next sections, we assume the following definitions: Event – A single web service request, which represents one entry in the IIS log. The type of event was defined as a concatenation between the URI Stem and the URI Query fields of the log entry. Sequence of events – A group of time‐sequential Events, requested by the same client, which should answer his Action request.
Action – The client’s subscriber activity that triggered a Sequence of events.
2.2 Summary
From the previous architecture and server distribution we can see that, in order to study the consequences of subscriber actions taken using the client set‐top‐box (STB), the best server candidates are the ones to which the STB sends the web service requests and, also, the ones that make those web services available. In this case, the Client Gateways (CGW) servers receive all requests of the STBs, besides the terminal server applications requests, and route them to the Client Facing Application (CFA) servers, the ones that make the web services available to the client. In this thesis the focus of the logs analysis is on both of those servers but other servers’ logs are also analyzed in order to see if they could complement the data or it they could make it easier for the interpretation of each other’s data.
6
7
3 Related work
3.1 Transactional log analysis
The IIS log files used in this thesis fall into the category of transactional logs, files that basically record the interactions that have occurred during a certain period between the system (a group of IPTV platform servers, in this case) and its users (STBs making certain request). The interactions are the communications exchanges that occur between the users and the system and they are collected and analyzed in order to obtain further beneficial information.
Jansen [7] calls this process Transaction Log Analysis (TLA). According to the author, the main objective of TLA is to obtain a clearer understanding of the interactions among the elements of the system on whatever research questions drive the study. TLA method basically involves the following three major stages: Collection ‐ collecting the data in a given period Preparation ‐ cleaning and preparing the data for analysis Analysis ‐ analyzing the data in accordance with our goals All the phases are dependent on each other, on the data that is being analyzed and on the research questions. For this thesis, since the collection process is already being done in the platform servers, we can only change the preparation and analysis phases. TLA is a broad categorization of methods that covers several sub‐categorizations, including Web log analysis (i.e., analysis of Web system logs), blog analysis, and search log analysis (analysis of search engine logs). [8]
Transaction log analysis enables macro‐analysis of aggregate user data and patterns and microanalysis of individual search patterns. The results from the analyzed data help develop improved systems and services based on user behavior or system performance.
From the user behavior side, transaction log analysis can be classified as an unobtrusive method. Unobtrusive methods allow data collection without directly interfacing with participants. This type of data is usually a very valuable research source since it was collected without interfering with the natural flow of behavior and events in the given context. In our study all the data was recorded from a real world platform with no intervention from us.
However one must interpret trace data from transactional logs carefully and with a fair amount of caution, as trace data can also be misleading. For example, with the data in transaction logs, we can see that an STB performed a boot‐up sequence. However, using trace data alone, we cannot conclude whether the STB executed the boot‐up sequence because the user pressed the power button or because the STB had a software error and executed a reboot.
3.2 Other researched techniques
Lou et al. [1] propose an approach to mine inter‐component dependencies from unstructured logs. The technique, requiring neither additional system instrumentation nor any application specific knowledge, analyses co‐occurrence of events (within a certain time interval) and their correspondence through a least one identical parameter. The authors show how false positive and false negative rates are influenced by the co‐occurrence time intervals considered. Initially, some
8
time interval interdependence conditions were included in our methods but due to the high variation of the time offsets of our events they were removed and replaced by another condition based on other parameters.
Zhu et al. [2] describes an algorithm for inferring system log formats in an automatic way. In the start of this thesis some thoughts were put into this because some of the log files that we had to process had no off‐the‐shelf tools that enable their quick processing. But, after focusing just on the IIS log files this method was deemed unnecessary.
Pauw [3] presents a visual and analytic tool that supports performance analyses and debugging, using large event traces to understand complex systems. Their goal is to reduce the cognitive and computational load on the analyst while providing answers to the most natural questions in a problem determination session. Although we do not use nor developed a similar tool, some of the visual methodology employed in defining the event sequences is similar, in principle, with this technique.
In the case of heavy load servers (like in our case), transactional logs flat files sometime become too much of burden to review only due to their size and that is why they are usually ignored. So techniques to facilitate the review of these files should also be employed. Microsoft [5] shows how one can use Microsoft SQL Server to facilitate the review of these IIS log files. In our study we use a very similar technique but employing a MySQL open‐source database. The most common methods of transactional log data analysis are focused on search engine query logs [6] and are used to explore the characteristics of the searchers’ behaviors, enabling, for example, the prediction of future behaviors. Although the data is similar to our log data, these techniques tend to be much focused on just determining user profiles.
Hatonen [4] suggests two methods to handle the huge amount of data that is continuously collected from the elements and devices of telecommunications networks and to improve the quality of decision‐making information available to their managers. The methods are based on log data summarization and semantic compression of log data, respectively, and they basically discard all the entries not considered relevant. But, these methods can only be applied after we have a complete knowledge of the data being compressed which is not the case in our study. After having identified all relevant event sequences in our data, these methods can be used, in a future work, to reduce the information displayed to a network manager.
3.3 Our approach
As described previously, we researched several methods to get ideas of what could be used in our work but, in the amount of time that we had available, we did not find a method that could be employed “as is” to handle all our problem conditions. Main hurdles were:
The sequences that we must identify are not previously defined.
Data logs’ entries do not have a timestamp with sufficient precision to allow their correct ordering. As such, the events belonging to a specific sequence can be out of order or intertwined with events from other sequences, if ordered using the timestamp field.
Some sub‐sequences (smaller groups of events) may be part of several different sequences or, simultaneously, may constitute a periodic event that is not part of any sequence.
9
The sequences may include, in certain cases, optional events ‐ these events are not present on every occasion.
We could have used a probabilistic approach to define the groups of events with the most number of occurrences but since this process can be further obfuscated by of the fact that the sequences may have optional (but valid) events that only occur in certain occasions, we decided to not follow a probabilistic approach and, instead, develop a new method that would be able to identify the precise start and end points of the sequences in question. If correctly defined this should ensure the most accurate results.
10
11
4 Dataset
The dataset we use in this project was obtained from the IPTV Microsoft Mediaroom platform used by an IPTV provider. It consists of several days of logs (tracesink logs, IIS logs and ELS boot logs) activity taken from the platform’s servers, and several hours of activity logs recorded from real subscribers’ set‐top‐boxes (STB). This chapter describes the characteristics of the data contained in those server logs and the analyses that were done in order to see if that data could be used to implement this thesis.
4.1 Dataset characteristics
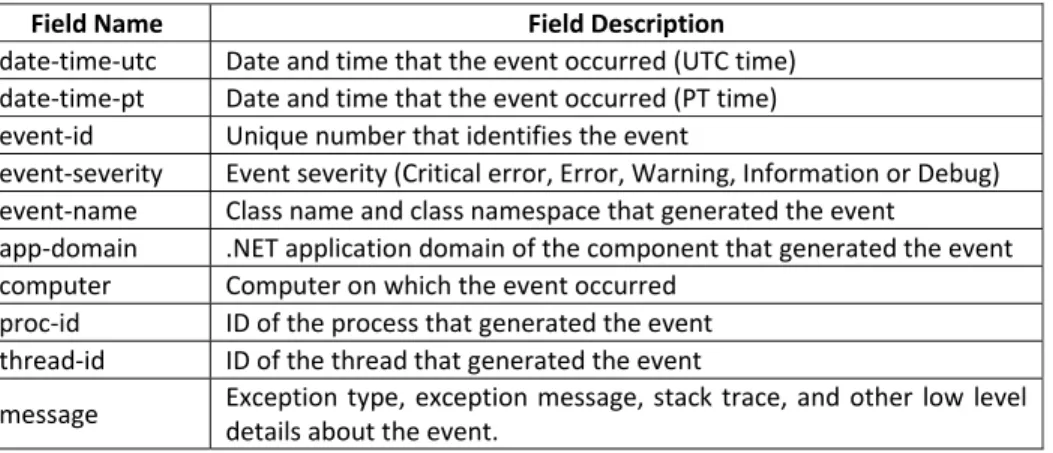
The tracesink logs consist on text logs, listing all the system events that occur on each server. System events flag errors, warn of potential problems, or provide notification of processes that have taken place. Service providers can use system event information to tune system maintenance and to troubleshoot problems. Each log entry contains the following fields: Field Name Field Description date‐time‐utc Date and time that the event occurred (UTC time) date‐time‐pt Date and time that the event occurred (PT time) event‐id Unique number that identifies the event event‐severity Event severity (Critical error, Error, Warning, Information or Debug) event‐name Class name and class namespace that generated the event app‐domain .NET application domain of the component that generated the event computer Computer on which the event occurred proc‐id ID of the process that generated the event thread‐id ID of the thread that generated the event
message Exception type, exception message, stack trace, and other low level details about the event.
Table 2 ‐ Tracesink log entry fields
Typical sizes for these daily files are: 20 MBytes/server for CFA servers, 6 MBytes/server for SFA servers and 380 kBytes/server for CGW servers.
The IIS logs consist on text logs, listing all the Web Services (WS) requests made to each of the servers that provide web services to internal and external platform clients (internal servers and STB clients, respectively). Each log entry contains the following fields: Field Name Field Description date Date of the conclusion of the WS request (UTC time) time Time of the conclusion of the WS request (UTC time) s‐sitename Name of the website (usually W3SVC1, meaning “website 1”) s‐computername Name of the server that answered to the request s‐ip IP of the server(s) to which the request was sent (usually the Service Group IP) cs‐method Operation requested (usually “POST” or “GET”) cs‐uri‐stem URI stem (usually the filename on the server) cs‐uri‐query URI query (the query requested) s‐port Port of the server (usually “80”)
12 cs‐username Name of the client (usually “‐“) c‐ip IP of the client cs‐version Client’s web service version (usually “HTTP/1.1”) cs(User‐Agent) Client’s software version and globally unique identifier (GUID) cs(Cookie) Cookie used (usually “‐“) cs(Referer) Client’s web service referrer (usually “‐“)
cs‐host Address of the server that hosted the requested web service (usually the Service Group address) sc‐status HTTP Status Code sc‐substatus Associated Sub Status Code sc‐win32‐status Associated Win32 Status Code sc‐bytes Bytes sent from the server to the client cs‐bytes Bytes sent from the client to the server time‐taken Time taken to service the request Table 3 ‐ IIS log entry fields Typical sizes for these daily files are: 230 MBytes/server for CFA servers, 75 MBytes/server for SFA servers and 230 MBytes/server for CGW servers. Subscriber activity logs are created at every Mediaroom client (STB), every time a subscriber: • Tunes the set‐top box to a new channel • Turns the set‐top box on or off • Selects an item from any menu • Purchases a VOD asset • Purchases an RDP application • Purchases a PPV event • Launches or closes the browse panel • Launches an RDP application • Disconnects from a launched RDP application • Navigates away from a launched RDP application • Transitions to a new trick state, such as fast‐forward, play, or rewind • Runs a client‐resident application, such as the menu or the program guide Subscriber activity events enable service providers to gain a better understanding of the services and features that subscribers are using on the Microsoft Mediaroom client. Service providers can use this information to improve customer marketing campaigns, advertising sales, and relationships with networks. Typical sizes for these files are: 800 MBytes/Service Group corresponding to a period of 4 hours. Due to the huge daily volume of activity data generated by all the STBs of a service group, these logs are loaded onto a database divided in periods of 4 hours of log reporting (every 4 hours they load into the database all the activity logs received from the STBs that reported logs in the last 4 hours). This means that the data is only available for a period of 4 hours. After that, it is overwritten by newer data.
ELS boot logs are created in the provider’s ELS platform and contain every STB authorization request to log in to the platform, whenever a STB is powered on or connected to the network, that is passed from the Mediaroom platform to the provider’s external login server.
13 The ELS web service triggers the provisioning of the STB if necessary, verifies that the STB is entitled to connect to the service provider, and returns information signaling the result of the authentication request. Each log entry contains the following fields: Field Name Field Description CreationDate Date / Time of the request AccountExternalID Customer account DeviceGUID STB GUID DeviceIP STB IP Action Type of Request (“DeviceLogin” or “DeviceProvision”) ErrorCode Error code (if successful ErrorCode=0) Table 4 ‐ ELS Boot log entry fields Typical size for this daily file is: 30 MBytes (containing the boot authorization requests made by all STB that tried to login to the platform).
4.1.1 Limitations
All of the data included in the dataset was generated during normal daily usage performed by a subgroup of IPTV subscribers (that subgroup corresponds to one Service Group that currently includes approximately 60.000 subscribers).
There was no data generated by request or using specific laboratory STB’s. Since we had already plenty of logged data this requirement was not considered initially. As such, during this project we had no access to the provider’s IPTV service.
4.1.2 Pre‐processing
Since a Service Group is constituted by a physical group of different servers working in parallel and performing load balancing between them, any sequence of requests (action) made by a particular STB can result in several requests to different servers (of that group) that have the same function (for example, the CGW). Because of this, no individual server’s log has any meaning by itself. To solve this, one must group the logs of all the same‐type servers, in a Service Group, and concatenate them. Then, we must reorder those sequences of events by date and time.
This will provide a unique log for the CGW server function, a unique log for the CFA server, etc. for the whole Service Group
This type of preprocessing was done for every tracesink log and IIS log files before starting the analysis phase.
4.2 Data analysis
In order to check for the information contained in each type of server log and the possible relationships between the different types, a detailed inspection must be made of the contents of each type of log files.
The goal is to see if all types of logs can provide enough information, per se, to characterize different actions (constituted by certain sequence of events), or if, only when joined together, they can add up the information needed to establish those different actions.
14
4.2.1 Data
Tracesink Logs The tracesink logs consist on a complete list of all the system events that occur on each server. We could see that the IPTV platform has the “Debug” detail mode enabled, in most of the server groups, which results in the logging of a great amount of events (this mode usually should only be activated when there is a need to help in debugging application code, according to Microsoft documentation). Due to this fact, these logs list mostly events that are internal to applications running on those servers and cannot be directly correlated with end‐users STB requests or other servers’ requests. The Error/Warning types of events are also displayed on real‐time platform administration displays to allow operators to take action if warranted. It is possible to independently configure the level of debugging in each server but most of them remain configured with the default value. In Table 5 we can see an example of the predominance of “Debug” events over all other types, for various server group types:CFA CGW SFA SYNDIS TSVR VSVR
Critical Error 48 0 0 0 1 0 Debug 192.419 8.019 77.637 0 136.615 85.747 Error 7.225 0 5 14 8 500 Information 52.141 10 450 35.230 211 4.336 Success Audit 2.181 0 0 0 0 0 Warning 12.085 672 39 835 0 0 Total 266.099 8.701 78.131 36.079 136.835 90.583 Table 5 ‐ System events in tracesink logs (for one SG ‐ June 28th, 2010) In these logs, the events are registered with a timestamp granularity of 1/100th of a second. Since all the servers are synchronized with the same time reference this allows for a good merging of the log files, keeping most of the real event order. Our first data analyses were done with this type of files. It was possible to group Event Names in the same App Domains and observing that different servers (within a Service Group) have App Domains names that differ in a numeric suffix corresponding to each of the servers of that service group. Other results included:
There is little diversity on the type of events being logged. For example, in a 2‐hour CFA tracesink log with 25,295 entries we can identify just 11 distinct App Domains and 44 distinct Event Name/App Domain combinations. The corresponding CGW log has only 2 distinct App Domains and 2 Event Name/App Domain.
The number of logging entries is very much dependent on the action being logged. The severity of the events logged also depends on the App Domain. Not every App
Domain has the same level of logging embedded. In the CFA logs, some of the entries do not have any STB GUID associated because they are mostly events associated with internal caches (EPG, Timeshift, etc.) refreshes. These types of events have no correlation with a STB request. In the same CFA 2‐hour example, 20% of the events were of this kind.
15
IIS Logs
The IIS logs consist on text logs, listing all the Web Services (WS) requests made to the respective servers. All the servers that do not host web services do not produce log files of this type (for example, VSVR, TSVR, etc). In the specific case of the CGW (client gateways) servers, they include in their IIS logs all the requests made by the STBs to CFA servers, although those requests are only distributed (forwarded) to those CFA servers. So, basically, a CGW IIS log is similar to the CFA IIS log but also includes extra requests that are not visible in the CFA logs like: GET Channel Packages (/ListingsClientDataDelivery/PackedListingsForClient/…) Other request with an ill‐formed query The GET channel packages are routed to other servers (besides the CFA) and the ill‐formed query are not forwarded. By looking at the IIS web service names some of the actions being requested become immediately recognizable but most of them are not. And, when trying to correlate this type of log information with the tracesink log we see that there is little correspondence between both logs.
Since all the web service requests served at the CFA servers, which should have been requested through the CGW gateways, are logged in the CFA IIS logs one can try and correlate those entries with the ones in the CFA tracesink log. But, if we exclude the “Debug” system events from the CFA tracesink log, the number of remaining events is very small when compared with the IIS log entries (for example, in the previous case shown in Table 5, for a total of 73,680 events (excluding “Debug”) there were a total of 4,766,492 CGW IIS log entries. Also, for a boot‐up sequence that is usually characterized by 32 distinct web service requests, as we will see later, the tracesink log only logs two entries corresponding to the “Bootstrap” web service.
In this type of logs, the events are registered with a timestamp precision of one second. Unfortunately, this allows for poor merging of the log files since many events can occur per second in all the servers, and can mix (obfuscate) the real time order of some of those events. This makes it harder for studying/finding event sequences as we will see later. Activity Logs
User activity logs contain all the actions that were performed by the IPTV service subscribers and logged in their STB on a local activity logging cache. When that cache accumulates 500 events, or reaches a certain time limit of 24‐hours since last upload, it uploads the content to the logging framework on the Microsoft Mediaroom servers.
As we can imagine this type of arrangement and the fact that, as previously described, the logging information is only available in periods of 4 hours introduces a great obstacle in attempting to correlate this type of information with other logs, namely the IIS logs.
Because of the huge volume of information included in these activity logs it was not feasible to download and accumulate 24 hours of data. Also, there was no guarantee that all the requests logged in a corresponding IIS log would have been included in those 24 hours of accumulated activity logs, for all the STBs, which would makes us have to process subsequent 24‐hour periods.
Nevertheless, the available activity information was briefly analyzed and it was confirmed that it appears to be of great use for user profiling, TV audience measurements, user menu navigation skills analysis, etc.
16
We tried to correlate boot‐up sequences, observed in CGW IIS logs, with the STB activity logs but did not found any visible pattern of events immediately before or after the IIS log’s reported timestamps of each STB sequence first boot event. For other types of events, the use of the STB activity logs might be more valuable to identify the relevant sequences.
Boot logs
Boot logs are created in the IPTV provider’s external login server (ELS) and contain every STB authorization request to login to the IPTV platform.
This type of log can be easily correlated with the boot‐up sequences logged in the CGW IIS logs and a match could be seen for practically all the sequences identified, as we will see later.
This correlation can be very useful in providing additional information about why some unsuccessful boot‐up attempts occurred, since, in the current architecture, the external service will always answer with an OK (status code 200) to the Mediaroom platform requests even if some required authorization is not granted. Since CGW IIS logs do not include this kind of semantic information, their relevance in describing the login results becomes somewhat reduced.
4.3 Summary
From the analysis of all the types of log files available, we conclude that:
There is no practical advantage in trying to correlate tracesink logs with IIS log files. The process consumes too much time of manual analysis, with little probability of success due to the fact that only on rare occasions the tracesink log adds relevant information to what is already available in the IIS log, regarding the assembly of a sequence of events that might correspond to a unique “user request”.
Even correlation between different tracesink files from different types of servers does not add up much information since most of them have no visible common information that allows for their match.
The activity log seems to be very interesting in order to correlate with CGW IIS logs since it includes the user activities recorded in the user side (STB). But, the activity logs include no information regarding the STB boot‐up process although user activity can be seen in the activity logs while the STB was still booting. Only power‐on and power‐off, from/to standby mode, actions are logged in the activity log file.
The boot log is very useful in correlating with the CGW II logs, in order to determine boot‐up sequences and contains additional information why most of the unsuccessful boot‐up sequences occur, not visible in those IIS logs.
Based on these conclusions we decided to focus our analysis efforts on the CGW IIS logs and try to identify event sequences that constituted “visible” STB actions. That is shown in the next chapters.
17
5 Data preparation
In this chapter, we explain how the initial analysis of the IIS log of a CGW server is done and how the log entries are parsed in order to help us define usable sequence of events that might be assigned to “actions”. Then, we see how the “boot‐up” sequence is chosen and what others sequences might be visible in the data. We should bear in mind that the available documentation about the workings and events generated by the platform provides little or no specific information about the characteristics of periodic STB/platform behaviors. The log files used in this analysis are the IIS log files collected from one Service Group’s CGW servers, in July 2010. These combined logs total 5,510,355 events in a 24‐hour period, requested by 59,293 distinct STB clients.5.1 First analyses
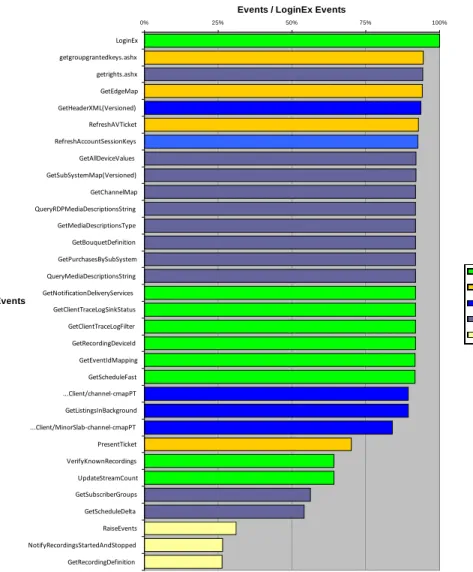
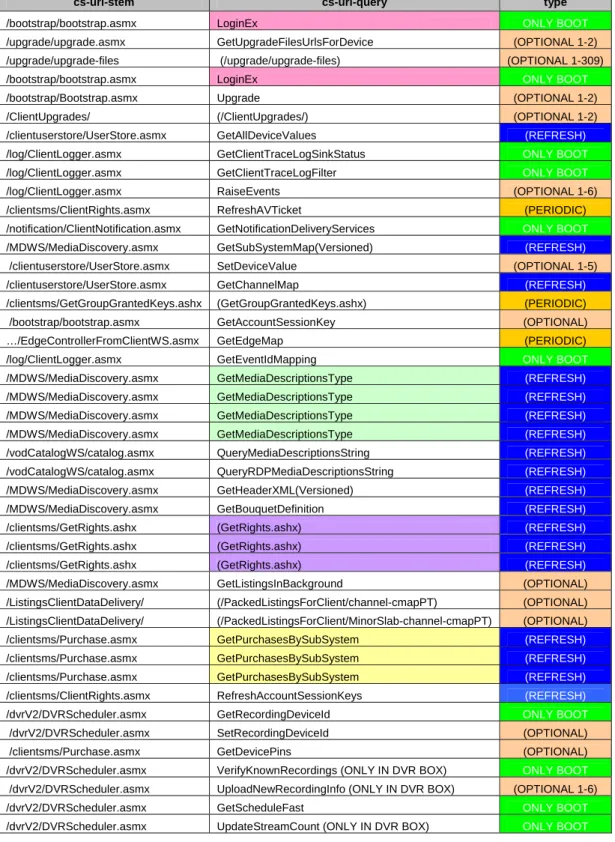
After concatenating and ordering by date/time the log files, we start by looking at the different types of events that are present in the CGW logs. We can identify 728 distinct pairs of URI Stem + URI Query (distinct events), shown on Figure 2. Most of those 728 distinct events can be grouped in 3 groups of (partial upgrade related) events intended to upgrade the STB client’s software ‐ the differences between the 3 are related with the different software versions that the STBs had already in their flash memories once the upgrade was requested. Since we are not interested in differentiating the different part requests of the upgrade process, we group these types of events together. Figure 2 ‐ Major groups of distinct URI Stem + URI QueryAnother 2 groups of pairs are possible because of the daily upload of Channel Maps (PackedListingsForClient) to the STB caches having different versions, which we also do not want to differentiate. In the end, it results in 104 (99 + 5 groups) distinct events grouped in 24 distinct URI Stems: 306 306 6 6 5 99 /upgrade/upgrade-files/1.6.25310.38 /upgrade/upgrade-files /ClientUpgrades/ /PackedListingsForClient/channel-cmapPT /PackedListingsForClient/MinorSlab-channel-cmapPT All others
18
URI Stem Method Distinct URI
Queries Total events /bootstrap/bootstrap.asmx POST 4 21.961 /certificateproxyws/certificateproxyws.asmx POST 2 56 /clientsms/clientrights.asmx POST 11 445.788 /clientsms/getgroupgrantedkeys.ashx POST 1 1.836.211 /clientsms/getrights.ashx POST 1 325.001 /clientsms/purchase.asmx POST 8 280.322 /clienttsmonitor/monitor.asmx POST 2 1.071 /clientuserstore/userstore.asmx POST 4 150.973 /dvrv2/dvrscheduler.asmx POST 22 300.616 /edgecontrollerfromclientws/edgecontrollerfromclientws.asmx POST 3 551.277 /log/clientlogger.asmx POST 7 79.073 /mdws/mediadiscovery.asmx POST 8 740.522 /notification/clientnotification.asmx POST 3 184.839 /searchws/search.asmx POST 5 9.118 /upgrade/upgrade.asmx POST 1 18 /vodcatalogws/catalog.asmx POST 12 341.075 /vodmapserverws/vodmapserver.asmx POST 3 7.739 / GET 1 6 /itassistant/ui/omabaseframe.htm GET 1 5 /ClientUpgrades/ GET 1 325 /PackedListingsForClient/channel‐cmapPT GET 1 114.878 /PackedListingsForClient/MinorSlab‐channel‐cmapPT GET 1 114.306 /upgrade/upgrade‐files GET 1 307 /upgrade/upgrade‐files/1.6.25310.38 GET 1 4.868 Table 6 ‐ All the distinct URI Stems in the IIS log
In Table 6, we can see that just the URI Stem getgroupgrantedkeys.ashx alone is responsible for 33.3% of all CGW log events. And, dividing this number of events per the number of distinct STBs, that made requests in this log, results in a getgroupgrantedkeys.ashx event per STB every 46.5 minutes approximately.
Another first processing was to try to characterize for each STB/event pair which was the next event in the log. If this yielded valid results it could be a good starting point in establishing event sequences. But, this had very poor results. After many processing runs we could not find any event that had a noticeable next‐event pair. This was strange given the amount of events that were present in our data.
The fact that there are no evident next‐event pairs, and that some event types have a huge number of occurrences, leads us to believe that there must be some automatic events that all STBs perform in a predetermined way, and that those requests may even follow a periodic pattern. If this is the case, that would explain why no discernable event/next‐event pairs were promptly discovered because the periodic events would obfuscate any possible pairing. So, the next step logical will be to search for the periodicity of the logged events.
19
5.2 Periodic events
To analyze the periodicity of the events, we execute a query that lists, for each distinct event, how many occurrences happened per minute of the day. A second query shows the times when each STB had the first occurrence of each type of events. Graphical examples of those results are shown in Figures 3 and 4 for the four major periodic events (responsible for 50% of all events in the log file): GetGroupGrantedKeys.ashx GetEdgeMap RefreshAVTicket PresentTicket 0 200 400 600 800 1.000 1.200 1.400 1.600 0:00 2:00 4:00 6:00 8:00 10:00 12:00 14:00 16:00 18:00 20:00 22:00Hour of the day
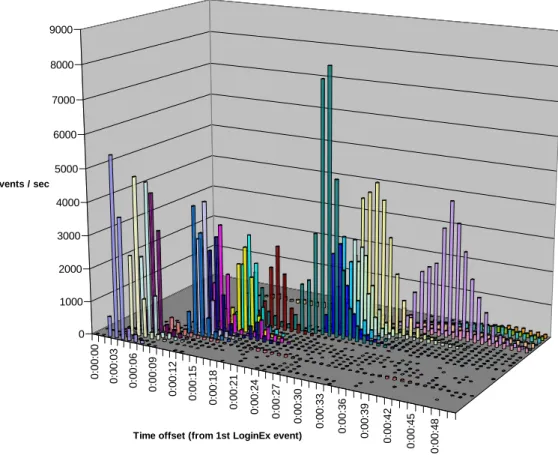
Ev e n ts / mi n /clientsms/GetGroupGrantedKeys.ashx http://tempuri.org/GetEdgeMap http://www.microsoft.com/tv2/server/sms/RefreshAVTicket Microsoft.IPTV.ClientNotification/PresentTicket Figure 3 ‐ Periodic events As we can see, the four events show a constant behavior (distribution) throughout the day that has no apparent relation with the clients’ activity.
Assuming that those events could be periodic, we will try to obtain the approximate periods between each event request by looking at the following graph which shows the first occurrence of each STB’s request for these web services:
20 0 200 400 600 800 1.000 1.200 1.400 1.600 0:00 2:00 4:00 6:00 8:00 10:00 12:00 14:00 16:00 18:00 20:00 22:00
Hour of the day
F ir s t d a ily e v e n ts / mi n /clientsms/GetGroupGrantedKeys.ashx http://tempuri.org/GetEdgeMap http://www.microsoft.com/tv2/server/sms/RefreshAVTicket Microsoft.IPTV.ClientNotification/PresentTicket Figure 4 ‐ Periods where the first daily event occur In Figure 4 we can see the result of the uniform distributions that these events have and conclude that the events are indeed periodic. Their time periods between consecutive requests are roughly: Event Time period GetGroupGrantedKeys.ashx 45 minutes GetEdgeMap From 2 hours to 3 hours RefreshAVTicket From 7 hours to 8 hours PresentTicket From 7 hours to 8 hours Table 7 ‐ Period duration of the periodic events (graphics)
The interval variance of the last 3 events probably aims at randomly distributing the STB refresh requests, in order to decrease the processing loads on the platform servers, by assigning a period value which is not always the same (but is bounded between minimum and maximum values). Since this study pretends to profile the different sequence of events that constitute the response to the subscribers’ actions, periodic events have no interest for our analysis. So just by removing these four events from the log we can cut the size of the data in half. Later, after establishing the start and endpoints for our sequences, the events should be reinserted in order to check if they could also be part of those sequences (for example, GetGroupGrantedKeys.ashx must also be used in a sequence associated with other events because of its different behavior in the 14:00‐17:00 timeframe, as can be seen in Figure 3). Detailed analysis of the intervals between successive calls, per STB, to these web services confirms the results already displayed. The exact intervals found using this method are the following:
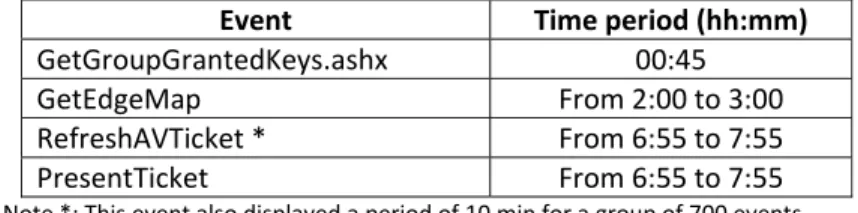
21 Event Time period (hh:mm) GetGroupGrantedKeys.ashx 00:45 GetEdgeMap From 2:00 to 3:00 RefreshAVTicket * From 6:55 to 7:55 PresentTicket From 6:55 to 7:55 Note *: This event also displayed a period of 10 min for a group of 700 events. Table 8 ‐ Period duration of the periodic events (analytical) These types of graphical representation, like the ones in Figure 3, show us interesting details about those events and, as such, we will use similar representations to show the workings of the STB’s cache refreshment events, in the next section.
5.3 Cache refreshment events
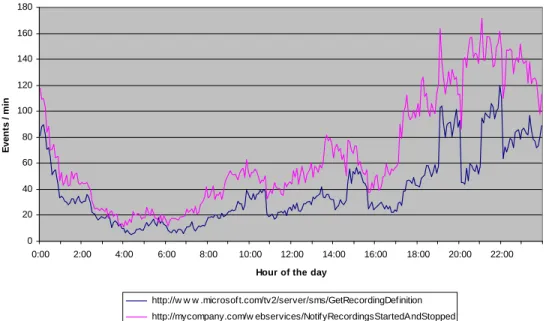
Looking at the event distribution charts reveals interesting details about the workings of the platform not clear in the documentation. It shows that there are some events which occur more often in “refresh windows” throughout the day (one during the night and another during the afternoon – periods that usually have less traffic load).
It seems that the platform updates the information present in the caches of the STBs during these time windows in order for it to be readily updated and available to the subscriber once he needs it.
Figure 5 shows a group of events that seems to update the map of channels or EPG available to each STB. And these updates are periodically made during the time windows of 0:00‐4:00, 13:00‐17:00 and/or 13:00‐19:00. The different steps visible in the charts seem to show that these events might be related with other refresh events shown in Figure 6 (which has a time window 14:00‐19:00) 0 50 100 150 200 250 300 350 400 450 500 0:00 2:00 4:00 6:00 8:00 10:00 12:00 14:00 16:00 18:00 20:00 22:00
Hour of the day
Ev e n ts / m in Microsoft.TV2.MD/GetHeaderXML(Versioned) http://www.microsoft.com/tv2/server/vod/QueryMediaDescriptionsStringUser Microsoft.TV2.MD/GetListingsInBackground /PackedListingsForClient/channel-cmapPT /PackedListingsForClient/MinorSlab-channel-cmapPT Figure 5 ‐ Some of daily cache refresh events The total number of these events in the 00:00‐04:00 window is 254,364. In the 13:00‐19:00, the total is 322,499.