Relevant parameters on the energy efficiency of
closed refrigerated multideck display cases
G.G. Heidinger
1, S.M. Nascimento
1, P.D. Gaspar
2& P.D. Silva
21
Eletrofrio Refrigeração Ltda, Brazil.
2
Department of Electromechanical Engineering, University of Beira
Interior, Portugal.
Abstract
The application of closed refrigerated multideck display cases (CRDC) and electronic fans is slowly increasing in Brazilians supermarkets, following the international trend. In order to obtain energy savings, this paper reports the results of experimental tests performed in a CRDC according to ISO 23953 to evaluate the influence of (1) environmental conditions, (2) gaps between doors and (3) fans type on the overall performance of a display case. Experimental laboratory tests were performed on two different conditions of temperature and relative humidity of the ambient air (Tamb=25°C; amb=60% and Tamb=27°C; amb=70%), with
electromagnetic and electronic fans, and with and without gaps between doors. The analysis and discussion of experimental results include the comparison of compressor energy consumption, total heat load, total condensed water collected on defrost periods and air and product temperatures. The experimental data analysis provides valuable information to set the operative parameters of the CRDC taking into account usual in-store conditions in Brazil.
Keywords: closed refrigerated display cases, energy efficiency, commercial refrigeration, supermarket, environmental condition, fans, doors
1 Introduction
Supermarkets have one of the highest electric usage intensities in commercial buildings. The entire refrigeration equipment accounts for approximately 50% of
the energy usage and the compressors accounts for more than half of this consumption [1]. The open refrigerated display cases (ORDC) have a highest energy consumption due the infiltration load which is between 67% to 81% of its total heat load [1, 2, 3]. Additionally, the ORDC latent heat load corresponds to 35% to 40% of its total heat load [4]. Thus, the energy consumption is strongly connected to the environmental conditions of the store in which they are placed. The higher the temperature and absolute humidity of the ambient air, the greater the sensible and latent heat loads which the cooling system must remove [5]. Nowadays, in order to reduce the energy consumption, the ORDC are being retrofitted, i.e., closed with glass doors. The closed refrigerated display cases (CRDC) may reduce the refrigeration load by 68% [2], improve the food safety, and eliminate the cold aisle effect [6]. CFD simulations have been performed to quantify the CRDC heat load components [7]. The lights, fans, door gaps and door opening represents 25%, 2%, 15%, 12% respectively during day periods and 0%, 3%, 23% and 0% respectively during night periods (lights off without door opening). However, the supermarket owners usually have the perception that doors may reduce the product sales, mainly the impulse sales. The study developed by [6] concluded that the installation of CRDC do not have effect on product sales. This paper describes the experimental tests which were conducted according ISO 23953 [8] to compare the CRDC efficiency on two different conditions of temperature and relative humidity of the ambient air (Tamb=25 °C; amb=60% and Tamb=27 °C; amb=70%), with electromagnetic and electronic fans, and with and
without gaps between doors.
2 Experimental procedure
Tests were conducted in an environmental test chamber constructed according to ISO 23953 [8]. The cooling equipment selected for the experiments is an CRDC with six doors and four shelves (0.92m×3.75m×2.10m) (Figure 1 and 2) used for displaying meat products, which temperature should be maintained between -1 °C and 5 °C (ISO 23953 class M1). Each test period lasted 24 hours and was repeated twice.
Temperature data acquisition was conducted at 1-minute interval in order to analyse its variation over time. To measure physical quantities on the air side, sensors were positioned at 3 equidistant points from the discharge air grille (DAG) and return air grille (RAG) along the length (y) of the display case. The product simulators temperatures were collected in order to find the critical product simulator temperature in all the shelves levels at the centre of the opening of each 2 doors (Figure 2). To measure physical parameters on the R22 refrigerant side, the temperature and pressure were collected on the suction and liquid lines according to the recommendations provided by ISO 23953 [8]. A Coriolis flowmeter was used to measure the outlet mass flow of the liquid coolant that passed through the evaporator during each operating period. In this way, it was
possible to measure the total heat load of the display case. The mass of water condensed during defrost was manually collected and measured in each test period.
Figure 2: Sensor positioning and components.
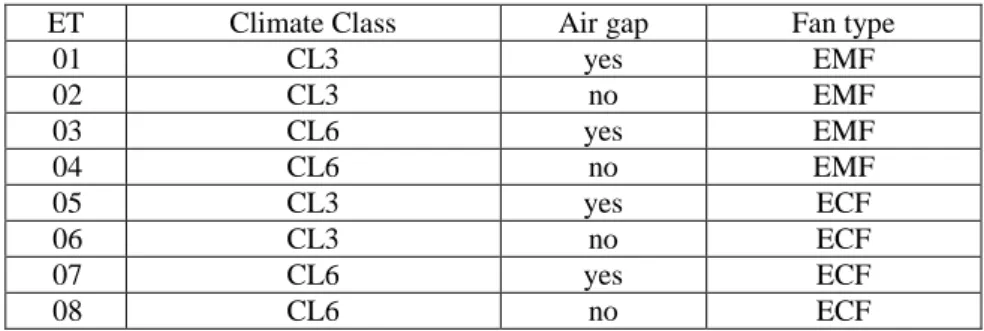
The doors must operate with 6 openings/hour during 12 hours/day. Each opening cycle lasts approximately 6-8 seconds. The CRDC lights were kept on during 24 hours/day. In order to quantify the environmental impact on the CRDC efficiency, the experimental tests (ET) were conducted on two different climate classes: Class 3 (CL3: Tamb=25 °C; amb=60%) and Class 6 (CL6: Tamb=27 °C; amb=70%). To
determine the influence of the gap between doors on the CRDC performance, the experiment was repeated with and without a gap of 6 mm between doors. The same evaluation was made with electromagnetic (EMF) and electronic fans (ECF) (Table 1).
Table 1: Experimental tests description.
ET Climate Class Air gap Fan type
01 CL3 yes EMF 02 CL3 no EMF 03 CL6 yes EMF 04 CL6 no EMF 05 CL3 yes ECF 06 CL3 no ECF 07 CL6 yes ECF 08 CL6 no ECF
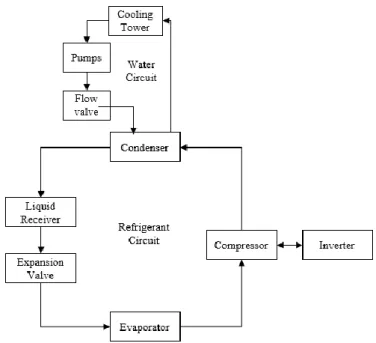
The manufacturer of the CRDC recommends for ideal operation, an evaporation temperature of -10 ± 1 °C with a useful superheating of 7 ± 1 °C, ensuring products temperature within the prescribed limited range between -1 ºC and 5 ºC. The refrigerated display case defrosts 2 times per day, and each defrost period lasts 25 minutes. The defrosting control system consists of stopping the cooling system while a heater on the evaporator starts to defrost the ice on the evaporator surface. The fans keep operating during the defrost period. The refrigeration system used on the tests is described by the flowchart shown in Figure 3.
For testing purposes that allow a fair comparison of the situations tested, the compressor pack was maintained in the same operating condition by an inverter and there is no controller to stop the compressor work, whether a thermostat that ceases its operation depending on temperature, or some other mechanism which turns off the compressor during the operating period. The compressor is only turned off when the defrosting process begins. The compressor energy consumption was taken by the inverter. The high pressure was controlled by a
manual water flow valve to keep the condensation temperature at 39 ± 1 °C with a natural subcooling of 10 ± 1 °C at the display case inlet.
Figure 3: Refrigeration system flowchart.
The total heat load of the cooling system on the refrigerant liquid side,
Q
, is determined by eqn (1). Calculating the difference in enthalpies between inlet, ii,and outlet, io, and the mass flow of the liquid refrigerant,
m
r:
o i
r
i
i
m
Q
(1)Knowing the total heat load it was possible to compare the influence of each factor on the efficiency of the display case.
The compressor running time, trun, for a 24-hour test period is defined by eqn (2): stop
def
run
t
t
t
24
(2)The average of the measured variables was calculated on 75% of the compressor running time between defrosts, trun75, excluding the defrost and pull down periods,
75
0.75
run runt
t
(3)The concept of Thermal Entrainment Factor, TEF, was developed to quantify the thermal entrainment of the air curtain with the ambient air, varying 0 < TEF < 1 [9] and it is calculated as shown in eqn (4):
TEF
RAG DAGAMB DAG
T
T
T
T
(4)3 Analysis and discussion of results
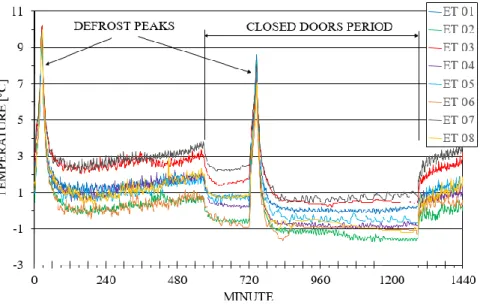
The variation of the operating temperature inside the display case during the test period of the eight experimental tests are shown by the return air grille temperature, TRAG, in Figure 4. The discharge air grille temperature, TDAG, has a
similar trend. The lighting was kept on at the whole test period. Thus, the simulation of a real night period (lights off + closed doors) was not analysed in order to determine the influence of the environmental condition, air gap and fan type. The CRDC performance is strongly affected by the opening doors period (ODP). During the ODP, the air temperatures inside the cabinet raise up 2 °C and the defrost peak temperature is higher than the defrost peak temperature during the closed doors period (CDP).
Therefore, the air temperature is more stable during the CDP. In other words, the opening doors movements increase the thermal entrainment of the air curtain. Table 2 shows the results of the experimental tests.
Q
is the total heat load [kW].
W
is the electrical power consumed by the CRDC [kW]. The product simulator temperature, TSIM, is relative to the warmest simulator temperature registered atthe test period. mW [kg] is the mass of water collected during the ET.
Table 2: Experimental tests results.
ET
Q
W
DAG
T
T
RAGTEF
T
SIMm
W[kW] [kW] [°C] [°C] [---] [°C] [kg] 01 1.55 15.50 -1.40 0.85 0.09 2.90 8.75 02 1.45 14.50 -2.00 -0.35 0.06 2.35 6.69 03 1.73 17.50 -1.20 1.65 0.10 3.80 12.71 04 1.58 16.50 -1.60 0.35 0.07 3.10 9.43 05 1.51 15.50 -2.10 0.50 0.10 2.35 9.40 06 1.40 14.50 -2.20 -0.20 0.07 2.20 7.50 07 1.65 17.00 -1.00 2.05 0.11 4.35 12.99 08 1.53 16.50 -1.85 0.40 0.08 3.05 10.39 3.1 Environmental conditions
When the environmental condition changes from CL3 to CL6, the overall performance of the CRDC decreases. The performance variation due to the environmental condition can be analysed comparing the results of {ET03,ET01}, {ET04,ET02} and {ET08,ET06} on Table 3.
Table 3: Influence of the environmental condition on the CRDC overall performance.
ET
Q
W
T
DAGT
RAGTEF
T
SIMm
W[Δ%] [Δ%] [Δ°C] [Δ°C] [Δ%] [Δ°C] [Δ%] {ET03,ET01} +11.40 +12.90 +0.20 +0.80 +21.05 +0.90 +45.27 {ET04,ET02} +8.77 +13.79 +0.40 +0.70 +12.00 +0.75 +41.09 {ET08,ET06} +9.39 +13.79 +0.35 +0.60 +8.28 +0.85 +38.56
The CRDC heat load is 9 to 11% higher and the collected water mass is 39 to 45% higher on the CL6. The impact of the environmental conditions on the TEF values is strongly related with the air gap. The ET with air gap shows an increase of 21% while the ET without air gap shows only 8 to 12%. Thus, the influence of the environmental conditions on the CRDC overall performance is improved if the air gap is eliminated. The same conclusion is obtained by the comparison of the difference between DAG and RAG temperatures.
3.2 Air gap
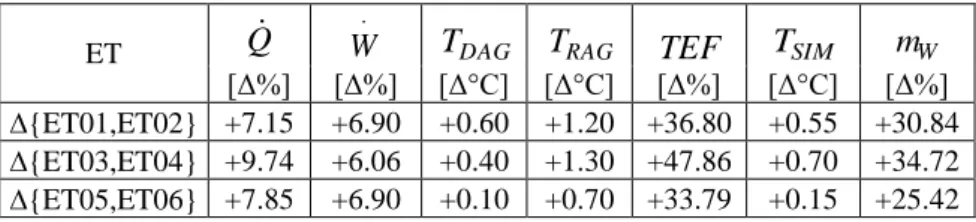
The influence of the 6 mm air gap between doors on the CRDC overall performance can be analysed comparing the results of {ET01,ET02}, {ET03,ET04} and {ET05,ET06} on Table 4.
Table 4: Influence of the air gap on the CRDC overall performance.
ET
Q
W
T
DAGT
RAGTEF
T
SIMm
W[Δ%] [Δ%] [Δ°C] [Δ°C] [Δ%] [Δ°C] [Δ%] {ET01,ET02} +7.15 +6.90 +0.60 +1.20 +36.80 +0.55 +30.84 {ET03,ET04} +9.74 +6.06 +0.40 +1.30 +47.86 +0.70 +34.72 {ET05,ET06} +7.85 +6.90 +0.10 +0.70 +33.79 +0.15 +25.42
The pressure difference inside and outside the CRDC increases the air entrainment by the gap. In consequence, the heat load increases 7-10% and the defrost water mass increases 25 to 35%.
The TEF is 34 to 37% higher with air gap between doors in CL3 and 48% higher with the air gap in CL6. The higher the difference between the external and internal temperatures, higher will be the pressure difference between the internal and external environment. Therefore, the air entrainment by the gap will be more representative on the overall performance of the CRDC.
3.3 Fan type
The display case has three fans. The nominal inlet power of each electromagnetic fan is 53W and of each electronic fan is 15W. The nominal output power of both fans are 10W, therefore, the EMF consumes 43W with friction and heating while the ECF consumes only 5W. The influence of the fan type on the overall performance of the CRDC can be analysed comparing the results of {ET01,ET05}, {ET02,ET06}, and {ET04,ET08} on Table 5.
Table 5: Influence of the fan type on the CRDC overall performance.
ET
Q
W
T
DAGT
RAGTEF
T
SIMm
W[Δ%] [Δ%] [Δ°C] [Δ°C] [Δ%] [Δ°C] [Δ%] {ET01,ET05} +2.99 0.00 +0.70 0.35 -11.86 +0.55 -6.94 {ET02,ET06} +3.66 0.00 +0.20 -0.15 -13.79 +0.15 -10.79 {ET04,ET08} +3.07 0.00 +0.25 -0.05 -10.83 +0.05 -9.17 The EMF dissipate significantly more heat through the evaporator. Thus, the heat load (3 to 4%) and DAG temperatures (0.20 to 0.70 °C) are higher and the defrost water mass is lower (7 to 11%) in relation to tests with ECF. It is inferred that the heat dissipated by the fans reduce water condensation and frost formation on the evaporator. On the ECF tests, the TEF is 12 to 16% higher because there is more water and ice on the evaporator and consequently, the pressure drop is higher and there is less air to make the air curtain protection. Nevertheless, the product temperatures are lower on the ECF tests because the impact of the reduction on the heat dissipation on the evaporator is more significant than the impact of the TEF increase. The air temperatures (DAG and RAG) are more affected on the ET with gap than on the ET without gap.
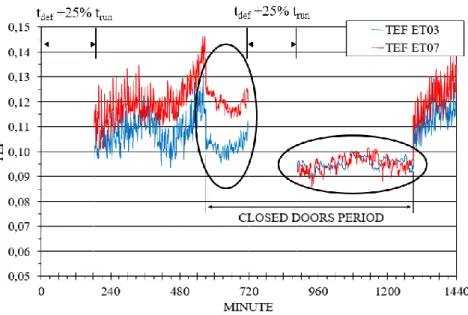
3.4 Experimental test 07
The ET07 (CL6, ECF, with air gap) could not be used on the comparison of the results because the frost formation rate on the evaporator affected the product simulator temperature on a different way than the other ET’s. In all other situations, the products and DAG temperatures are higher with EMF. However, on the comparison of ET07 (CL6, ECF, with air gap) with ET03 (CL6, EMF, with air gap), the worst temperatures have occurred on ET07. The ET07 RAG temperature is the highest at Figure 1 and the TEF values on ET03 and ET07 at
75 run
t
are shown on the Figure 5.Analysing the TEF values, it possible to conclude that the lower efficiency of the air curtain on the ET07 was caused by the blockage of the air flow during the ODP. After the defrost at the ODP (240 min), the TEFET07 is higher than the TEFET03.
Thus, the efficiency of the air curtain is lower on the ET07.
When the CDP starts (540 min), the TEF values of ET03 and ET07 goes down, but the TEFET07 keeps higher due to a high frost formation occurred during the
previously ODP. This condition is proved after the defrost at the CDP (960 min), when the airflow backs to the maximum value, the TEF value of ET03 and ET07 are approximately the same, thus, the air curtain efficiency is the same at this point. So, ET07 reaches the critical limit of air flow reduction, because the product temperature was affected on +0.55°C in comparison with ET03.
Therefore, even with the ECF, the ET07 is the critical test because the collected water mass, the TEF and the product temperatures are the highest.
Figure 5: TEF comparison (ET07 vs. ET03).
4 Conclusion
The CRDC overall performance is affected by the environmental conditions, air gaps and type of fans. The results have been analysed and the main conclusions are related to the increase of the refrigeration heat load, TEF and collected water mass.
The heat load increases 11% on the CRDC with air gap and 9% without the air gap respectively when the environmental condition changes from CL3 to CL6. At the same environmental condition, the air gap increases the heat load up to 10%. The heat load with EMF is up to 4% higher than the heat load with ECF. In average, each ECF reduces 16 W the heat load of the CRDC.
The TEF values are higher when the enthalpy of the ambient air is higher and is strongly affected by the air gap. The pressure difference between the CRDC internal volume and the external ambient is higher when the difference between the respective temperatures is higher. Thus, the air entrainment by the air gap is more intense on CL6. The ECF dissipates less heat on the evaporator surfaces, thereat occurs more water condensation and frosting on the evaporator reducing the total air flow and increasing the TEF up to 14%.
The collected water mass strongly rises with by changing the environmental conditions from CL3 to CL6. The increase of the collected water mass reaches up to 45% with the air gap. The EMF heat dissipation is responsible to reduce the water condensation and frost formation up to 11% in CL6 and 7% in CL3.
The food safety is analysed by the warmest product simulator. The product simulator is colder when the environmental condition is soft, and when there are not air gaps between doors and with ECF. However, the use of the ECF on critical environmental conditions (ET07) must be carefully analysed because there is a possibility of reducing the quality on the food preservation (+0.55 °C) by the air flow reduction on the air curtain.
References
[1] ASHRAE Inc, Retail food store refrigeration and equipment, ASHRAE
Handbook: Refrigeration, pp. 15.1-15.21,2010.
[2] Faramarzi, R., Efficient display case refrigeration, ASHRAE Journal, pp. 46– 51,1999.
[3] Gaspar, P., Gonçalves, L., Pitarma, R., Experimental analysis of the thermal entraiment factor of air curtains in vertical open display cabinets for different ambient air conditions, App. Therm Eng 31 (5), pp. 961-969, 2011.
[4] Heidinger, G.G., Nascimento, S.M., Gaspar, P.D., Impact of environmental conditions on the performance of open multideck display case evaporators, 2nd
IIR International Conference on Sustainability and the Cold Chain, Paris,
France, 2013.
[5] Nascimento, S.M., Heidinger, G.G., Gaspar, P.D., Silva, P.D., Experimental analysis to optimize the performance of air curtains and heat exchangers: application to refrigerated display cases, Handbook of Research on Advances
and Applications in Refrigeration Systems and Technologies, pp 560-640,
2015.
[6] Frickie, B., Becker, B., Doored display cases, ASHRAE Journal 52(9), pp. 18-26, 2010.
[7] Orlandi, M., Visconti, F., Zampini, S., CFD assisted design of closed display cabinets, 2nd IIR International Sustainability and the Cold Chain Conference,
Paris, France, 2013.
[8] ISO 23953-2 2005, "Refrigerated display cabinets - Part 2: Classification,
requirements and test conditions", International Organization for
Standardization (ISO), 2005.
[9] Navaz, H.K., Henderson, B.S., Faramarzi, R., Pourmovahed, A., Taugwalder F., Jet entrainment rate in air curtain of open refrigerated display cases,
![Table 2 shows the results of the experimental tests. Q is the total heat load [kW]](https://thumb-eu.123doks.com/thumbv2/123dok_br/18929703.938422/7.892.201.693.413.612/table-shows-results-experimental-tests-total-heat-load.webp)