Performance Evaluation and Packet Scheduling in
HeNB Deployments
Rui R. Paulo and Fernando J. Velez
Instituto de Telecomunicações Universidade da Beira InteriorCovilhã, Portugal [email protected], [email protected]
Giuseppe Piro
Dep. of Electrical and Information Engineering Politecnico di Bari
Bari, Italy [email protected]
Abstract—The unsupervised and chaotic deployment of Home eNBs (HeNBs) is leading to high levels of interference. To under-stand the behaviour of the interference of these uncoordinated deployments is vital to reach significant capacity improvement and also to explore opportunities to save energy. This paper considers high and middle interference level scenarios, with a maximum of four users per cell. HeNBs indoor deployed is considered within building. We theoretically analyse the traffic performance of this scenario through the study of the Signal-to-Interference-plus-Noise-Ratio (SINR). Through the use of the LTE-Sim simulator one obtains the quality indicators for two flows that are being utilised by the users. Video and best effort are studied, while varying the transmitter power and the areas of the apartments. The achieved SINR is higher (around 10 dBm) when the area of the cells is smaller. The variation of the transmitter power of the HeNBs does not present any significant impact. Noticeable throughout the simulations is observed that is possible to operate the system without setting the transmitter power of HeNBs to the maximum value at both interference levels. Simulation results also show that with the considered flows is possible to serve the maximum number of four users per HeNB with high quality. This statement is confirmed by the maximum achieved Packet Loss Ratio for video with a value of value of 1.6 %, which is lower than the maximum of 2 % indicated by the 3GPP. Taking into account the obtained results it is possible to promote a reduction in energy consumption of the HeNBs without penalizing the service quality.
Index Terms—HeNBs, Performance Evaluation, SINR, Power Management, LTE-Sim
I. INTRODUCTION
In 4G and beyond shrinking cells is one of the best ways to improve capacity and service quality, because short range improves signal to interference ratio [1]. This shrinking of cells leads to a cellular network composed by an amalgam of different types of cells, such as, macro base stations (eNB), pico cells and Home eNBs (HeNBs) are being deployed in an uncoordinated way, which can lead to the emergence of agglomerates of small cells. This kind of deployment originates new and more complex interference problems in both down and uplink [2].
To solve this problem, power control [3], [4], [5] and new scheduling algorithms [6], [7] have been the main approach to
This work was supported by National Funding from the FCT - Fundação para a Ciência e a Tecnologia, through the UID/EEA/50008/2013, COST CA 15104 IRACON, ORCIP and CONQUEST (CMU/ECE/0030/2017).
mitigate the underlying interference problems while improving the functioning of HeNBs.
In some way, this work goes further than previous works and also beyond the assumptions from 3GPP [8] since a scenario closer the worst achievable one and predictable assumptions are assumed. A scenario where all the possible locations of the HeNBs has one HeNB (and that HeNB is online). Each one of the HeNBs have four users connected, and is continuously receiving data from the HeNB. The range of HeNBs is defined by the radii [4] [9], and HeNB users are deployed in this omnidirectional area. In this work, users have been deployed inside a square area of an apartment, as defined in [8]. The power of the HeNB varies independently of the apartment area [8], which also varies. It is also considered that the deployment of the building (the building is composed by 25 apartments) is influenced by an eNB from a macro cell. It is assumed that this deployment occurs randomly along the eNB area, in order to acquire a general behaviour that integrates the contribution of the effect of having the HeNBs and the served users at different cell distances [10].
The independent variation of the transmitter power of the HeNBs and the areas of the apartments increase the complexity of the study of the degradation caused by the interference in the system performance. This fact motivates the theoretical study of the average Signal-to-Interference-plus-Noise-Ratio (SINR).
The performance evaluation was made applying the LTE-Sim simulator [11]. LTE-LTE-Sim is an open source framework to simulate LTE networks, which has a high degree of re-producibility of the results. To perform our simulations some improvements have been made to LTE-Sim, and they are presented along the paper.
Frequency reuse is also considered in many works as a way to deal qith co-channel interference and to extend the system performance. Apart from frequency reuse, this work firstly considers simulations in a scenario where the HeNBs and an eNB operate with the same bandwidth. Secondly, results have been obtained from simulations where the HeNBs operate with frequency reuse two. Results present the behaviour of the system in terms of average goodput, average packet loss ratio and delay.
novel techniques for power control nor new scheduling algo-rithms. The main contribution is to present a theoretical study and performance evaluation taken from simulations, which present a different view for performance evaluation of HeNBs, in scenarios where the transmitter power of HeNBs and the deployment area of the users vary independently.
II. AVERAGEHENB SINR A. Scenario
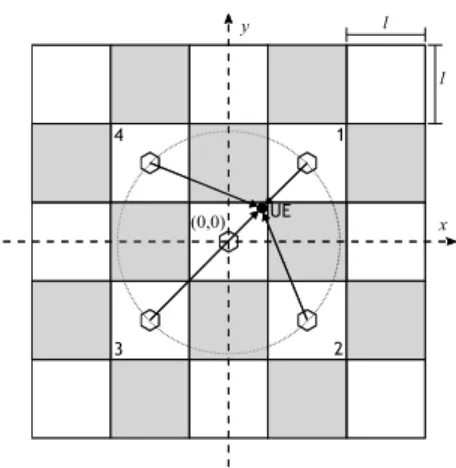
A user which is receiving data from a node, e.g., eNB or HeNB, is not only receiving a signal from the node to which it is connected to but also receiving interfering signals from the co-channel nodes. The studied scenario along this work is an indoor scenario, defined in [8], that consist in a building with one floor with a geometry of 5x5 apartment grid in a total of 25 apartments, as presented in Fig. 1.
y x UE 1 2 3 4 (0,0) l l
Fig. 1. Simulation scenario with 25 apartments.
A HeNB is deployed in the center of every apartment [12], [13]. This study considers frequency reuse two. Frequency reuse is the design process of selecting and allocating different channel groups for all cellular base system within a cellular system [14], [15]. In the study of the average HeNB SINR, a distribution of the whole available bandwidth is considered among clusters, so that all cells belonging to the same cluster have not overlapping channels.
B. SINR at a Given Position
Let’s consider an user equipment/terminal (in our case a User Equipment (UE)) inside and confined to the central apartment of the considered geometry, as shown in Fig. 2. The center of the apartment is also the origin of our coordinate system (0,0). To obtain the average SINR, an approach similar to the one described in [16], [17], [18] is applied. In general, the SINR of our considered UE, in a position with coordinates (x,y), served by a cell receiving a transmit power PT x, can be
expressed as SINR(PT x, x, y) = Pow(PT x, x, y) Pow(PT x, x, y) + Pnh(PT x, x, y) + Pnoise , (1) y x UE 1 (0,0) l l (x0,y0) (x,y)
Fig. 2. Interference received from one of the neighbouring HeNBs and signal from the own HeNB.
the received power from the own cell is defined by Pow and
can be expressed as
Pow(PT x, x, y) = PT xGT xGRx10−
P L
10, (2)
where antenna gains for the transmitter and receiver are respectively GT x and GRx, P L is the Path Loss. Pnoise, in
dBW, is the thermal noise power, and is defined as follows Pnoise= −174 + 10 ∗ log10BW − 30 + N F, (3)
where N F is 8 dB for HeNB [8]. In this work, one connsiders BW =10 MHz. The total amount of interfering power coming from the N neighbour cells is Pnh, and is given by
Pnh(PT x, x, y) = N
X
i=1
Ii(PT x, x, y), (4)
where Iiis the ithcell interference, and is expressed as follows
Ii(PT x, x, y) = PT xGT xGRx10−
P L(x,y)i
10 (5)
where i represents the cell from which the interference comes from. The path loss model, adapted for the HeNB at 2 GHz, is the WINNER II [19] for an indoor office, and stand as
P LHeN B(x, y) = A ∗ log10(d) + B + C ∗ log10(
fc
5) + X, (6) where fc is the system frequency, in GHz (in our case it is 2
GHz), the fitting parameter A includes the path loss exponent, parameter B is the intercept, parameter C describes the path loss frequency dependence, and X is environment-specific term (e.g., wall attenuation in the Non Line-of-Sight (NLoS) scenario) [19]. The distance between the transmitter and the receiver, d, is determined by the Euclidean distance
d =p(x − x0)2+ (y − y0)2, (7)
where x0and y0are the coordinates of the interfering cell and
x and y are the coordinates of the UE, Fig. 2. For a Line of Sight (LoS) path A=18.7, B=46.8, and C=20. In the case of NLoS, A=20, B = 46.4 and C=20. The environment specific term X is the sum of the attenuation of the walls between the UE and the HeNB, in the case of a internal walls the attenuation is equal to 5 dB.
Considering the HeNB located in the area number one from Fig. 1, the path loss is given by the following equation
P L(x, y)1=20 ∗ log10( p (x − l)2+ (y − l)2) + 46.4 + 20 ∗ log10(2 5) + 2 ∗ 5, (8)
where l is the apartment side. For the remaining three HeNBs from the four closest HeNBs, only the coordinates (x0, y0)
change. For the remaining HeNBs along with the coordinates of the HeNB also the number of walls change.
C. Average SINR
The average SINR within a cell is the SINR measured by an UE with uniform probability density function for its deployment over the apartment area. In this case, it is the area of the apartment. It depends on the apartment side l, and on the BS transmitter power, PT x, as follows
SIN R(l, PT x) =
Pow(l, PT x)
Pow(l, PT x) + Pnh(l, PT x) + Pnoise
. (9) The average interference power Pnh can be defined as
Pnh(l, PT x) = nT
X ¯I(l, PT x), (10) which is the total surrounding power received from interfering neighbours at different distances. The average interference generated by the interfering HeNBs can be calculated by integrating each fraction of the interfering power over the affected area. Since UEs are confined to the apartment area, the average level of received interference from a neighbour cell ¯I is integrated over the apartment area
¯ Ii(l, PT x) = nT X i=1 Z Γi x Z Γi y fIi(PT x, x, y)dydx = nT X i=1 Z Γi x Z Γi y PT xGT xGRx AApt P L(x, y)dxdy, (11)
where AApt is the total affected cell area.
The integration regions for an interferer HeNB are as follows
Γix= {[−l/2, l/2]} (12) and
Γiy= {[−l/2, l/2]} . (13)
For HeNBs the following parameters are considered accord-ing to [20], GT x=5 dBi and GRx=0 dBi.
The average received power from the own cell, Pow(PT x,x,y), is constant no matter the value of reuse
pattern. It may be obtained following a similar approach of the Pnh(l, PT x), with a different integrand function
Pow(l, PT x) = Z y Z x PT xGT xGRx Aow 10−18.7∗log10 ( √ (x2 +y2 )+46.8+20∗log10(25) 10 dxdy. (14) Where Aowis the total area integration of the own apartment.
Fig. 3. Average SINR for the first interfering tier of HeNBs.
Fig. 3 presents results for the average SINR. The average SINR is obtained as a function of the apartment side, l, and the transmitter power PT x. The apartment side varies from 5
to 20 m, while the transmitter power varies from -10 to 20 dBm.
Results from the study of the average SINR show that the smaller the apartment areas are the higher values for the average SINR are. It is verified that the variation of the transmitter power of the HeNB does not have any impact in the average SINR results as a function of apartment side.
III. PERFORMANCEEVALUATION
The LTE-Sim, in its stable release R5 [11], is considered to analyse the overall of the system. The system performance has been studied for the downlink (DL), considering the Proportional Fair (PF) [15]. The PF was considered because is the most commonly used scheduling algorithm.
A. Proportional Fair
PF schedules a user when its instantaneous channel quality is high relative to its own average channel condition over time [15]. PF scheduler is used as a typical way to find a trade-off between requirements on fairness and spectral efficiency scheme [21]. It is effective in reducing variations in user bit rates with little average bit rate degradation, as long as user average values of SINR are fairly uniform [22].
B. Simulation Scenarios and Updates in the Simulator In order to address the behaviour from a real deployment scenario through event-based simulation whilst simultaneously saving computational resources, the simulation scenario is composed by a macro cell with 1 km radius (represented by a solid line in Fig. 4). A building with one floor is created in such area with a radius of 80 % of the macro cell radius (represented by a dashed line in Fig. 4). This constraint in the creation of the buildings exists to ensure that buildings do not cross the cell edge. The LTE-Sim has been written in C++, using the object-oriented paradigm, as an event-driven simulator [11]. In its stable release R5, it is compiled with a ISO/IEC 14882:1998 compiler. With this compiler the
underlying random number generator, the simulator tends to generate the position of buildings more often near the cell center. Also the position of the users was generated near the HeNB/eNB center. The solution to this problem has to start to use the Mersenne Twister pseudo-random generator [23]. This pseudo-random generator started to be available in the ISO/IEC 9899:2011 [24]. The Mersenne Twister is the most widely used general-purpose pseudo-random number generator [25]. To correctly start the Mersenne Twister pseudo-random number generator a seed using the time library Chrono is considered. This library also start to be present in the ISO/IEC 9899:2011 [24]. The results presented above already benefit from this improvement in the simulator.
Fig. 4. The fifty different positions of the building are randomly chosen.
The geometry is a building with a 5x5 grid, with a total of 25 apartments. Inside and in the center of each apartment, there is one HeNB. This geometry represents actual deployment scenarios, such as offices and shopping centres. We consider the power of the HeNBs varies from -10 dBm to 20 dBm, in steps of 5 dBm, and all cells simultaneously operate at the same power. The side of the apartments (identified as Side in Figures) varies from 5 to 20 m, in steps of 5 m. For each combination of the value of HeNB transmitter power and the length of the sides of the apartments, fifty simulations have been performed. In Fig. 4, 50 different positions are simultaneously shown for the buildings. The position of the users is also determinate by using the Mersenne Twister pseudo-random generator but along the apartment square area. The goal of accounting for different positions is to acquire the general behaviour that integrates the contribution of the effect of having the building and consequently the HeNBs and the served users at different cell distances from the HeNBs topology. Additional details are presented in Tab. I.
As stated in Section II-A, the frequency reuse is also considered for the performance evaluation. Although the core of the presented study consider the frequency reuse, results are also presented when exactly a 10 MHz bandwidth is used by the HeNBs and the eNB. In this work when the HeNBs and the eNB are sharing the same bandwidth is considered a high interference level scenario. For the middle interference level scenario, a 20 MHz bandwidth is considered for the eNB, the
TABLE I
CONSIDERED SIMULATION PARAMETERS.
Parameter Range of values
Simulation duration 30 s
Flow duration 20 s
Frame structure FDD
Deployment density Dense
Access policy Open
Mobility model Constant position
Maximum delay 0.1 s
Path loss model WINNER II
Channel quality indicator Periodic
HeNBs operate with a frequency reuse two, i.e., the 20 MHz bandwidth from the eNB are divided into two equal portions of 10 MHz each one, and are shared by the neighbour HeNBs. We consider an heterogeneous scenario where two different applications are simultaneously used by the users. One is the video application, a video trace that is compressed using the H.264 standard compression at the average coding rate of 440 kb/s, the other application is best effort (BE). More details on the video application are given in [13]. The adoption of this video application accounts for the trend of users to watch high quality videos. The BE flows are modelled through infinite buffer sources which model an ideal source where there are always packets to be sent. We evaluate the network performance by considering these video and BE flows.
The simulation tool used in this work implements network environments, communication protocols, and radio interface from the system level perspective. Thus, it reaches good levels of scalability even in complex scenarios. Specifically, the sce-nario considered herein embraces one macro cell, one building with 25 apartments, and four users for each apartment. In line with the study already presented in [13], simulations did not register a high computational complexity. In fact, in a typical Linux-based machine with a 2.6 GHz CPU, each run completed in less than 2.5 minutes and consumed less than 250 MBytes of RAM memory.
C. Results for the High Interference Scenario
This section introduces performance results for PF scheduler operating in the high interference scenario, where the eNB and HeNBs operate in the same 10 MHz bandwidth. Fig. 5 presents the average goodput with the use of the PF scheduler for video application.
The maximum values for the average goodput have been obtained when the apartment side is 20 m and the transmitter power is between 0 and 10 dBm. The lowest values have been obtained when the apartment side is also 20 m but the transmitter power is -10 dBm. For BE flows, in Fig. 6 the maximum values for the goodput have been obtained for a transmitted power of 20 dBm and for an apartment side of 20 m, as shown in Fig. 6.
Power [dBm] −10 −5 0 5 10 15 20 Side [m] 5 10 15 20 Goodput [Mb/s] 28.90 28.95 29.00 29.05 29.10 ● ● ● ● ● ● ● ● ● ● ● ● ● ● ● ● ● ● ● ● ● ● ● ● ● ● ● ●
Fig. 5. Variation of the average goodput for video flows and high interference level, with PF scheduler and different values of the transmitter power and room side. The fitting considers a polynomial surface with 95 % confidence interval. Power [dBm] −10 −5 0 5 10 15 20 Side [m] 5 10 15 20 Goodput [Mb/s] 105 110 115 120 ● ● ● ● ● ● ● ● ● ● ● ● ● ● ● ● ● ● ● ● ● ● ● ● ● ● ● ●
Fig. 6. Variation of the average goodput for BE flows and high interference level, with PF scheduler and different values of transmitter power and room side. The fitting considers a polynomial surface with 95 % confidence interval.
Although other obtained results are not presented here, the maximum packet loss ratio (PLR), for all simulations (and both interference levels) was obtained for the high interference scenario, as shown in Fig. 7. The maximum value of PLR of the simulated scenarios was obtained for the video flows with a maximum value of 1.6 %, which is lower than the maximum of 2 % indicated by the 3GPP. In some cases, values near or of 0 % for the PLR was obtained. Also, in none of the interference levels, the 3GPP limit of 150 ms for the maximum delay has been overcome.
D. Results for the Middle Interference Scenario
As introduced in Sec. II-A, frequency reuse intends to improve the system capacity. The eNB operates with 20 MHz bandwidth. The 20 MHz bandwidth used by the eNB is split into two equal parts to be available to the HeNBS, each portion with 10 MHz of bandwidth. Performance results are as follows. With adoption of frequency reuse, by comparing
5 10 15 20 −10 0 10 20 Power [dBm] Side [m] 0.50 0.75 1.00 1.25 PLR [%]
Fig. 7. Variation of the average packet loss ratio for video flows and high interference level, with PF scheduler and different values of transmitter power and room side. The fitting considers a polynomial surface with 95 % confidence interval.
Fig. 5 and Fig. 8, the average goodput for video application slightly increases. Power [dBm] −10 −5 0 5 10 15 20 Side [m] 5 10 15 20 Goodput [Mb/s] 29.10 29.15 29.20 ● ● ● ● ● ● ● ● ● ● ● ● ● ● ● ● ● ● ● ● ● ● ● ● ● ● ● ●
Fig. 8. Variation of the average goodput for video flows and middle interference level, with PF scheduler and different values of transmitter power and room side. The fitting considers a polynomial surface with 95 % confidence interval.
Mainly for lower values of apartment side. The lowest value for the average goodput was also obtained when the apartment side is also 20 m and the transmitter power is -10 dBm. In this scenario, the behaviour of the obtained values for the average goodput for video flows with the PF scheduler in this scenario are in line with the values obtained for the average SINR presented in Fig. 3.
Since the video flows did not take a significant advantage from the frequency reuse, the maximum average goodput for BE flows increase 3.6 times, Fig. 9. The highest gain was obtained when the apartment side is 5 m.
The variation of the transmitter power has little impact in the average goodput, for a given side of the apartment. Only for values of the transmitter power lower than 0 dBm, the average goodput starts do decay. Also the average goodput of
Power [dBm] −10 −5 0 5 10 15 20 Side [m] 5 10 15 20 Goodput [Mb/s] 360 380 400 420 440 ● ● ● ● ● ● ● ● ● ● ● ● ● ● ● ● ● ● ● ● ● ● ● ● ● ● ● ●
Fig. 9. Variation of the average goodput for BE flows and middle interference level, with PF scheduler and different values of transmitter power and room side. The fitting considers a polynomial surface with 95 % confidence interval.
BE flows are in line with the values obtained for the average SINR, as presented in Fig. 3.
IV. CONCLUSIONS
For the video application the performance results for the PF scheduler operating in the high interference level show us that the maximum average goodput was never obtained when the maximum transmitter power is 20 dBm. Generally, the maximum average goodput was obtained for values of transmitter power lower than 10 dBm. The maximum average goodput was obtained when the side of the apartment is the longest one, 20 m. Also taking in account the low values for the PLR, it can be stated that each HeNB can simultaneously serve four users with a video application of 440 kb/s.
With a middle interference level, for video flows, PF presents higher values for the average goodput, for values of transmitter power between 10 and 15 dBm. By comparing the obtained results in the presence and absence of frequency reuse, it is possible to sustain the maximum average goodput in more combinations of power and side. Besides, for BE flows, a noticeable increase of the average goodput is observed.
It is also important to note that for video flows in the high interference level, is it possible to take advantage of the transmitter power of HeNBs wich is not set to its maximum value. A similar behaviour occurs for the middle interference level. For BE flows, it is possible to set the transmitter power of the HeNBs to values lower than the possible maximum ones. This leads to a decrease of the energy consumption in HeNB scenarios.
REFERENCES
[1] W. Webb, Wireless communications: The future. Wiley, 2007. [2] H. Zhang, C. Jiang, N. C. Beaulieu, X. Chu, X. Wen, and M. Tao,
“Re-source Allocation in Spectrum-Sharing OFDMA Femtocells With Het-erogeneous Services,” IEEE Transactions on Communications, vol. 62, no. 7, pp. 2366–2377, July 2014.
[3] H. Yuliana and A. Kurniawan, “Uplink Power Control for LTE femtocell based on Overload Indicator,” in 2016 International Symposium on Electronics and Smart Devices (ISESD), Nov 2016, pp. 68–72.
[4] Y. Chen, J. Cheng, X. Wen, Z. Lu, and H. Shao, “An interference shaping based approach for energy saving of video applications,” in 2014 Inter-national Symposium on Wireless Personal Multimedia Communications (WPMC), Sept 2014, pp. 91–96.
[5] H. B. Jung and D. K. Kim, “Power Control of Femtocells Based on Max-Min Fairness in Heterogeneous Networks,” IEEE Communications Letters, vol. 17, no. 7, pp. 1372–1375, July 2013.
[6] R. D. Ainul, H. Mahmudah, and A. Wijayanti, “Scheduling schemes of time and frequency resource allocation for interference coordination method based on user priority in LTE-femtocell,” in 2015 International Electronics Symposium (IES), Sept 2015, pp. 178–182.
[7] K. Inage and T. Fujii, “Interference-adapted scheduling weight for small-cell in heterogeneous network,” in 2013 IEEE 24th International Symposium on Personal, Indoor and Mobile Radio Communications (PIMRC Workshops), Sept 2013, pp. 184–188.
[8] “3GPP, R4-092042, Simulation assumptions and parameters for FDD HeNB RF requirements, 3GPP TSG RAN WG4 Meeting 51,” 2009. [9] E. Madhwal and R. Mahapatra, “Performance analysis of femtocell
network in macrocell environment,” in International Conference on Electronics, Communication and Instrumentation (ICECI), Jan 2014. [10] H.-S. Jo, P. Xia, and J. G. Andrews, “Open, closed, and shared
access femtocells in the downlink,” EURASIP Journal on Wireless Communications and Networking, vol. 2012, no. 1, p. 363, Dec 2012. [Online]. Available: https://doi.org/10.1186/1687-1499-2012-363 [11] G. Piro, L. Grieco, G. Boggia, F. Capozzi, and P. Camarda, “Simulating
LTE Cellular Systems: An Open-Source Framework,” Vehicular Tech-nology, IEEE Transactions on, vol. 60, no. 2, pp. 498–513, Feb 2011. [12] G. TSG-RAN4#51, Alcatel-Lucent, picoChip Designs, and Vodafone,
“R4-092042, simulation assumptions and parameters for fdd henb rf requirements,” May 2009.
[13] F. Capozzi, G. Piro, L. Grieco, G. Boggia, and P. Camarda, “On accurate simulations of LTE femtocells using an open source simulator,” EURASIP Journal on Wireless Communications and Networking, vol. 2012, no. 1, p. 328, 2012. [Online]. Available: http://jwcn.eurasipjournals.com/content/2012/1/328
[14] T. S. Rappaport, Wireless Communications: Principles and Practice, 2nd ed. Upper Saddle River, NJ: Prentice Hall PTR, 2002.
[15] S. Sesia, I. Toufik, and M. Baker, LTE, The UMTS Long Term Evolution: From Theory to Practice, 2nd Edition. Wiley Publishing, 2011. [16] J. Habetha and J. Wiegert, “Network capacity optimisation, part 1:
Cellular radio networks,” Sep 2001, pp. 125–132.
[17] ——, “Network capacity optimisation, part 2: Multihop ad hoc radio networks,” Sep 2001, pp. 133–140.
[18] R. R. Paulo, F. J. Velez, and G. Piro, “Design of Coordinated HeNB Deployments,” in 2018 IEEE 87th Vehicular Technology Conference (VTC2018-Spring), June 2018.
[19] L. H. X. Z. T. J. C. S. M. N. M. M. A. H. J. Y. V.-M. H. M. A. s. R. B. Y. d. J. T. R. Pekka Kyösti, Juha Meinilä, “IST-4-027756 WINNER II D1.1.2 V1.2 WINNER II Channel Models,” Tech. Rep., February 2008. [Online]. Available: http://www.cept.org/files/1050/documents/winner2 - final report.pdf
[20] X. Xu, G. Kutrolli, and R. Mathar, “Energy efficient power management for 4G heterogeneous cellular networks,” in 2013 IEEE 9th International Conference on Wireless and Mobile Computing, Networking and Com-munications (WiMob), Oct 2013, pp. 231–238.
[21] R. Basukala, H. Mohd Ramli, and K. Sandrasegaran, “Performance analysis of EXP/PF and M-LWDF in downlink 3GPP LTE system,” in Internet, 2009. AH-ICI 2009. First Asian Himalayas International Conference on, Nov 2009, pp. 1–5.
[22] R. Kwan, C. Leung, and J. Zhang, “Proportional Fair Multiuser Schedul-ing in LTE,” Signal ProcessSchedul-ing Letters, IEEE, vol. 16, no. 6, pp. 461– 464, June 2009.
[23] M. Matsumoto and T. Nishimura, “Mersenne Twister: A 623-dimensionally Equidistributed Uniform Pseudo-random Number Gener-ator,” ACM Trans. Model. Comput. Simul., vol. 8, no. 1, pp. 3–30, Jan. 1998. [Online]. Available: http://doi.acm.org/10.1145/272991.272995 [24] International Standards Organization and International Electrotechnical
Commission, ISO/IEC 9899:2011, Programming Languages - C, 1st ed. 11 West 42nd Street, New York, New York 1O036: American National Standards Institute (ANSI), Dec. 2011. [Online]. Available: http://www.open-std.org/jtc1/sc22/wg14/
[25] S. Marsland, Machine Learning: An Algorithmic Perspective, Second Edition, 2nd ed. Chapman & Hall/CRC, 2014.


![Fig. 5 and Fig. 8, the average goodput for video application slightly increases. Pow er [dBm] −10−505101520 Side [m] 5101520Goodput [Mb/s]29.1029.1529.20 ●●●●●●●●●●●●●●●●●●●●●●●●●●●●](https://thumb-eu.123doks.com/thumbv2/123dok_br/18876216.931922/5.918.495.807.487.729/fig-average-goodput-video-application-slightly-increases-goodput.webp)

