i
Ciências da Saúde
Prevalence and risk factors for food allergy
in elderly individuals:
A Systematic Review
Inês Laia Dias
Dissertação para obtenção do Grau de Mestre em
Medicina
(Ciclo de estudos integrado)
Orientador: Professor Doutor Luís Taborda Barata
Coorientador: Professor Doutor Jorge Gama
ii
Acknowledgements
I would like to thank everyone involved, in any way, in this project, with special regard to:
Professor Luís Taborda Barata (University of Beira Interior, Portugal), who believed in me and in our work from the beginning and provided me with the guidance, counsel and reassurance that I needed to complete it.
Professor Jorge Gama (University of Beira Interior, Portugal), for his precious help with the statistical analysis.
Doctor Carlos Lozoya Ibañez (Hospital Amato Lusitano, Portugal), for his help throughout the selection and data extraction process.
Doctor Isabel Skypala (Royal Brompton & Harefield NHS Trust, UK), Doctor Ulugbek Nurmatov (Cardiff University, UK), Doctor Bright Nwaru (University of Gothenburg, Sweden) and Professor Olga Lourenço (University of Beira Interior, Portugal), for their vital advice and help in this project.
GRUPI, for their teachings and guidance regarding all things about systematic reviews.
Doctor Rosa Saraiva, main librarian at the Cova da Beira University Hospital Centre, and Head of the Research & Innovation Department of this institution, for invaluable input in terms of discussion of this manuscript.
Marta Duarte, for being available to help me in anything I needed, as well for her patience and kindness.
My family, for supporting me through everything in my life.
iii
Abstract
Background: Various studies suggest that the prevalence of food allergy may be increasing
worldwide. Results regarding the prevalence and features of adverse food reactions in the elderly have, however, scarcely been analysed in the literature. Thus, the objective of the present systematic review is to describe the prevalence of food allergy, as well as its risk factors, clinical features and most frequently involved foods.
Methods: This systematic review protocol was registered at the PROSPERO online platform
(https://www.crd.york.ac.uk/prospero/) number CRD42018102140. We conducted a systematic review and meta-analysis on the prevalence and risk factors for food allergy in elderly individuals. We searched international electronic databases including MEDLINE, EMBASE, Cochrane Library, CINAHL, AMED and ISI Web of Science, as well as clinical trials databases for published, unpublished and on-going studies from 1980 to 2019. There were no restrictions on the language or geography of publication. The Critical Appraisal Skills Programme (CASP) quality assessment tool was used to appraise the methodological quality of the included studies. A descriptive summary with data tables was elaborated, and when clinically relevant and statistically adequate, a meta-analysis using random-effects modelling was carried out, given the expected clinical, methodological and statistical heterogeneity of the selected studies. The PRISMA checklist guided the reporting of the systematic review.
Results: The prevalence of food allergy in the elderly was 11.2% for self-report, lower than
that of SR + food-specific IgE levels (25.4%) and SPT (24.3%), and higher than that in children (when data were available) for all methods of outcome assessment, and that in adults only with self-report. No results were obtained regarding the time and geographical tendencies, predominant foods, risk and prognostic factors, and clinical manifestations of food allergy in the elderly. There was great heterogeneity both in the systematic review and the meta-analysis, which was highest for milk and derivatives (I2=97.142%), moderate for peanuts
(I2=44.342%) and lowest for others (I2=0.000%).
Conclusions: This systematic review allowed us to draw up-to-date estimates of the prevalence
of adverse food reactions in elderly individuals, worldwide. The data reported in all selected studies did not allow an analysis regarding time and geographical trends, predominant foods, risk and prognostic factors, and clinical manifestations of food allergy in the elderly. Our review only involved studies that fully met the inclusion criteria and included analysis of study biases that might affect exposure and outcomes.
iv
Keywords
v
Resumo
Introdução: Vários estudos sugerem que a prevalência de alergias alimentares tem tido vindo
a aumentar a nível mundial. Os resultados acerca da prevalência e características de reações adversas a alimentos em idosos têm, no entanto, sido escassamente analisados na literatura. Posto isto, o objetivo da presente revisão sistemática foi o de descrever a prevalência de alergias alimentares em idosos, assim como os seus fatores de risco, manifestações clínicas e os alimentos mais frequentemente envolvidos.
Métodos: O protocolo desta revisão sistemática foi registado com o registo PROSPERO
(https://www.crd.york.ac.uk/prospero/) número CRD42018102140. Conduzimos uma revisão sistemática e meta-análise acerca da prevalência e fatores de risco para alergias alimentares em idosos. Foi feita pesquisa em bases de dados eletrónicas internacionais, incluindo MEDLINE, EMBASE, Biblioteca Cochrane, CINAHL, AMED, ISI Web of Science, e bases de dados de ensaios clínicos, por estudos publicados, não publicados e em desenvolvimento, desde 1980 até 2019. Não foram impostas restrições a linguísticas ou geográficas. Usamos a ferramenta de avaliação de qualidade Critical Appraisal Skills Programme (CASP) para aferir a qualidade dos estudos incluídos. Um sumário descritivo com tabelas de dados foi elaborado e, quando considerado clinicamente relevante e estatisticamente adequado, realizada uma meta-análise, utilizando modelos com efeitos aleatórios, consoante a heterogeneidade estatística, metodológica e clínica expectável dos estudos selecionados. A checklist PRISMA guiou o registo da revisão sistemática.
Resultados: A prevalência de alergia alimentar em idosos foi 11.2% para o auto-reporte, inferior
à obtida através de níveis de IgE específicas (25.4%) e SPT (24.3%), e superior à prevalência em crianças (quando apresentada) para todos os métodos de diagnóstico de alergia alimentar, e também superior à apresentada por adultos, no auto-reporte. Não foram obtidos resultados relativamente a tendências temporais e geográficas, alimentos predominantes, fatores de risco e prognóstico e manifestações clínicas nas alergias alimentares em idosos. Foi encontrada uma elevada heterogeneidade entre estudos, quer na revisão sistemática, quer na meta-análise, sendo está máxima para o leite e derivados (I2=97.142%), moderada para o amendoim
(I2=44.342%) e mínima para outros alimentos (I2=0.000%).
Conclusões: Esta revisão sistemática permitiu fazer estimativas atualizadas da prevalência de
reações adversas a alimentos em idosos, a nível mundial. Os dados encontrados não permitiram a análise de tendências temporais e geográficas, alimentos predominantes, fatores de risco e prognóstico e manifestações clínicas de alergia alimentar em idosos. A nossa revisão envolveu
vi
apenas estudos que cumpram completamente os critérios de inclusão e incluiu a análise de vieses de estudos que possam afetar a exposição e resultados.
vii
Palavras-chave
viii
Resumo Alargado
Introdução: Vários estudos sugerem que a prevalência de alergias alimentares tem tido vindo
a aumentar, não só em países ocidentais, como também noutros países nos quais tem sido adotado um estilo de vida semelhante. Os resultados acerca da prevalência e características de reações adversas a alimentos em idosos têm, no entanto, sido escassamente analisados na literatura. A maioria dos estudos epidemiológicos acerca de alergias alimentares foca-se predominantemente em crianças e jovens adultos e a maioria dos estudos que envolvem idosos incluem-nos na população global de adultos. Assim, o objetivo da presente revisão sistemática foi descrever a prevalência de alergias alimentares em idosos, assim como os seus fatores de risco, manifestações clínicas e os alimentos mais frequentemente envolvidos.
Métodos: O protocolo desta revisão sistemática foi registado com o registo PROSPERO
(https://www.crd.york.ac.uk/prospero/) número CRD42018102140. Alergia alimentar foi definida como reação alérgica ou de hipersensibilidade a qualquer alimento. Idoso definido como indivíduo com 60 ou mais anos, para incorporar dados de países subdesenvolvidos e em desenvolvimento. Conduzimos uma revisão sistemática e meta-análise acerca da prevalência e fatores de risco para alergias alimentares em indivíduos idosos. Foi desenvolvida uma estratégia de pesquisa compreensiva para a seleção de estudos publicados e por publicar. Foi feita pesquisa em bases de dados eletrónicas internacionais, incluindo MEDLINE, EMBASE, Biblioteca Cochrane, CINAHL, AMED e ISI Web of Science, bem como bases de dados de ensaios clínicos, por estudos publicados, não publicados e em desenvolvimento, desde 1980 até 2019, de acordo com critérios previamente estabelecidos. Não foram impostas restrições a respeito da linguagem ou localização geográfica da publicação. A seleção e análise dos títulos, resumos e artigos completos de todos os estudos elegíveis foi feita por dois investigadores. A extração de todos os dados individualmente por dois investigadores para tabela específica em Excel. A resolução de discrepâncias foi efetuada por um terceiro revisor. Usamos a ferramenta de avaliação de qualidade Critical Appraisal Skills Programme (CASP) para aferir a qualidade dos estudos incluídos. Um sumário descritivo com tabelas de dados foi elaborado e, se considerado clinicamente relevante e estatisticamente adequado, realizada uma meta-análise, utilizando modelos com efeitos aleatórios, consoante a heterogeneidade estatística, metodológica e clínica expectável dos estudos selecionados. A checklist PRISMA guiou o registo da revisão sistemática.
Resultados: A prevalência de alergia alimentar em idosos foi 11.2% para o auto-reporte, inferior
à obtida através de níveis de IgE específicas (25.4%) e SPT (24.3%), e superior à prevalência em crianças (quando apresentada) para todos os métodos de diagnóstico de alergia alimentar, e também superior à apresentada por adultos, no auto-reporte. Relativamente à prevalência de
ix
alergia a alimentos específicos em idosos, comparativamente a adultos, os idosos apresentaram uma prevalência de alergia superior para o leite (AR e IgE), amendoim (AR), outros frutos secos (AR), marisco (AR e SPT), peixe (AR) e outros alimentos (IgE). Quando comparados com as crianças, os idosos apresentavam prevalência superior para as alergias ao amendoim (AR), outros frutos secos (AR), marisco (AR), peixe (AR) e outros frutos do mar (AR). Não foram obtidos resultados relativamente a tendências temporais e geográficas, alimentos predominantes, fatores de risco e prognóstico e manifestações clínicas nas alergias alimentares em idosos. Foi encontrada uma elevada heterogeneidade entre estudos, quer na revisão sistemática, quer na meta-análise, sendo está máxima para o leite e derivados (I2=97.142%),
moderada para o amendoim (I2=44.342%) e mínima para outros alimentos (I2=0.000%).
Conclusão: Esta revisão sistemática permitiu fazer estimativas atualizadas da prevalência de
reações adversas a alimentos em idosos, a nível mundial. Os dados encontrados não permitiram a análise de tendências temporais e geográficas, alimentos predominantes, fatores de risco e prognóstico e manifestações clínicas de alergia alimentar em idosos. Esta informação poderá ser crucial na análise das semelhanças e diferenças nas alergias alimentares entre idosos e não-idosos e, eventualmente, definir abordagens preventivas e diagnósticas adaptadas especificamente para esta faixa etária. A nossa revisão envolveu apenas estudos que cumpriram completamente os critérios de inclusão e incluiu a análise de vieses de estudos que possam afetar a exposição e resultados.
x
Index
Acknowledgements ... ii Abstract... iii Keywords ... iv Resumo ... v Palavras-chave ... viiResumo Alargado ... viii
Index ... x
List of Figures ... xii
List of Tables ... xiii
List of Acronyms ...xiv
1. Introduction ... 15
2. Materials and Methods ... 17
2.1. Protocol and registration ... 17
2.2. Search strategy ... 17
2.3. Inclusion criteria for study designs ... 17
2.4. Study selection ... 18
2.5. Data extraction ... 18
2.6. Data items ... 19
2.7. Outcome assessment ... 19
2.8. Risk of bias assessment strategy ... 19
2.9. Analysis, data synthesis and reporting ... 20
2.10. Ethics, dissemination and data protection ... 20
3. Results ... 21
3.1. Protocol ... 21
3.2. Systematic review ... 21
3.2.1. Study selection and characteristics ... 21
3.2.2. Risk of bias assessment ... 24
3.2.3. Frequency of food allergy ... 24
xi
3.2.5. Predominant foods associated with food allergy ... 28
3.2.5. Time trends in the frequency of food allergy ... 29
3.2.6. Geographical trends ... 29
3.2.7. Risk and prognostic factors for food allergy ... 29
3.3. Meta-analysis ... 29
4. Discussion ... 32
4.1. Statement of principal findings ... 32
4.2. Comparison of our findings with previous studies ... 32
4.3. Strengths and limitations ... 33
4.4. Conclusions ... 35
5. Future Prospects ... 36
References ... 37
Appendix ... 42
Appendix I – Search Strategies ... 42
Appendix II - Database: Embase Classic+Embase - Search Strategy: ... 43
Appendix III – Database: CINAHL - Search strategy: ... 44
Appendix IV - Database: ISI Web of Science: Science Citation Index, Conference Proceedings Citation - Search strategy: ... 45
Appendix VI – Supplementary material: ... 47
Appendix VII – BMJ Open submission: ... 49
xii
List of Figures
Figure 1. PRISMA - Preferred Reporting Items for Systematic Reviews and Meta-Analyses flow diagram for studies on the epidemiology of food allergy in elderly individuals. 22
Figure 2. Forest plot for the pooled prevalence of self-reported food allergy for each food type. 31
xiii
List of Tables
Table 1. Summary of the characteristics of studies included for qualitative analysis: studies published worldwide until February 2019. 23
Table 2. Summary of the characteristics of studies included for qualitative analysis: studies published worldwide until February 2019. 24
Table 3. Summary of the overall pooled point prevalence of food allergy in the elderly. 24
Table 4. Self-reported food allergy prevalence: Random-effects meta-analysis. 30
Table 5. Number of selected studies according to food groups and method of assessment for food allergy. 47
Table 6. Prevalence of FA (95% CI) for each method of outcome assessment, in each age subgroup. 47
Table 7. Prevalence of allergy to milk and milk derivatives (95% CI) for each method of outcome assessment, in each age subgroup. 47
Table 8. Prevalence of fruit allergy (95% CI) for each method of outcome assessment, in each
age subgroup. 47
Table 9. Prevalence of allergy to other foods (95% CI) for each method of outcome assessment, in each age subgroup. 48
xiv
List of Acronyms
AR – auto-reporte SR – self-report FA – food allergy
OFC – oral food challenge SPT – skin prick test
IgE – food-specific IgE levels
DBPCFC – double-blind placebo-controlled food challenge CASP - Critical Appraisal Skills Programme
U.S. – United Sates
W.H.O. – World Health Organisation ILD – Inês Laia Dias
CLI – Carlos Lozoya Ibañez LTB – Luís Taborda Barata JG – Jorge Gama
15
1. Introduction
The prevalence of food allergies in the general adult population is less well known than in children, since there are fewer studies in the former. Nevertheless, meta-analyses have estimated the prevalence of food allergy in adults to vary between 3.5% and 35% when only based on self-report, and between 2% and 4% when studies include more stringent additional criteria such as positive skin prick tests (SPT) and/or food-specific IgE levels or the gold standard of double-blind placebo-controlled food challenge (DBPCFC) (1-3). In addition, the prevalence of food allergy may be increasing worldwide, not only in western countries but also in other countries which have adopted a westernised living style (1,4).
However, it should be borne in mind that epidemiological studies of food allergies most frequently focus on children and young adults, and reports that specifically include elderly individuals are scarce (1-3,5). In fact, most epidemiological results of food allergy involving elderly individuals are embedded in studies that addressed this issue in global populations of adults. Overall, it is not clear whether the prevalence of food allergy is similar, lower or higher in elderly individuals than in young adults or in children. In this context, a previous meta-analysis has shown that it may be higher in elderly Europeans (1), although another meta-analysis, which screened studies from European and non-European countries showed that the prevalence of food allergy was lower in adults than in children (2); however, the latter study only used aggregated data, and did not specifically analyse elderly adults. Thus, further studies are necessary to clarify this issue. Nevertheless, the prevalence of food allergy may also be increasing in elderly individuals. For example, the analysis of the U.S. Food and Drug Administration Food Safety Surveys (FSS) study, which is a cross-sectional, telephone survey of adult American consumers conducted every 3–5 years since 1988 showed that the prevalence of self-reported food allergy increased between 2001 and 2010 in elderly individuals, although this was only significant in the 60-69 year-old group, but not in the > 70 year-old group (6).
It should also be taken into account that the numbers and relative percentage of elderly people are increasing worldwide. According to the United Nations (7), in 2017, 13% of the world population was aged 60 or over and 2% was aged 80 or over. In Europe, 25% of the population was already aged 60 or over and it was projected to reach an estimate of 35% in 2050. In Latin America and the Caribbean, the rise will be from 12% to 25%, in Asia from 12% to 24%, in Northern America from 22% to 28%, in Oceania from 17% to 23% and in Africa from 5% to 9%. In comparison with 2017, by 2050, populations aged 60 and over as well as 80 and over are expected to more than double (962 million to 2.1 billion), and triple (137 million to 425 million), respectively.
16
The ageing process is accompanied by immunophysiological and biochemical changes that may make the human body more susceptible to the same stimuli, namely diseases, drugs or foods. As such, food allergies may manifest differently in the elderly, a situation which may be further compounded by concurrent medications and co-morbidities, as well as lack of awareness of the problem (5,8,9). These factors may lead to underdiagnosis and undertreatment of food allergies in elderly individuals (5,8). Furthermore, these changes might be reflected not only upon clinical manifestations of food allergy but also upon positivity of skin test results or levels of food-specific IgE antibodies, which may result in differences in detectable prevalence and risk factors, as well as in predominant foods associated with food allergy in the elderly. As such, a different approach might be necessary regarding the diagnosis and management of food allergy in elderly adults in comparison with non-elderly adults (5). However, to the best of our knowledge, no previous systematic review has been published on epidemiological aspects of food allergies specifically in elderly individuals.
Thus, the objectives of this systematic review will be: 1) To describe the worldwide prevalence, and time trends of food allergy in elderly individuals, 2) To describe clinical manifestations and predominant foods associated with food allergy in the elderly; 3) To analyse risk and prognostic factors associated with food allergy in the elderly.
17
2. Materials and Methods
2.1. Protocol and registration
The protocol of this systematic review has been registered in the International Prospective Register of Systematic Reviews (PROSPERO) (10), with the following registration number: CRD42018102140.
2.2. Search strategy
We have developed a comprehensive and highly sensitive search strategy for screening published and unpublished studies. As sources of published studies, the following electronic databases were used: Cochrane Library (Cochrane Database of Systematic Reviews, Cochrane Central Register of Controlled Trials (CENTRAL), Cochrane Methodology Register), OVID MEDLINE, EMBASE, CINAHL, AMED, ISI Web of Science (Science and Social Science Index).
The bibliographies of all eligible studies were also scrutinised to identify additional possible studies. Unpublished studies and research in progress were searched in key Internet-based relevant databases – www.clinicaltrials.gov; www.isrctn.com/ (ISRCTN Registry); www.controlledtrials.com; www.anzctr.org.au. In addition, to extend our search for published, unpublished and ongoing studies, we contacted an international panel of experts in this field.
Studies from all over the world were included if they met the inclusion/exclusion criteria. No language restrictions were imposed; translations were undertaken where necessary. Search dates were from inception to February 2019. Search terms are detailed in Appendix I-IV. One change was made to the protocol, and this was registered by submission of an updated version to PROSPERO and was also documented on the final manuscript with the results of the systematic review.
2.3. Inclusion criteria for study designs
We included all observational, including cohort, case-control and cross-sectional studies. In addition, systematic reviews and meta-analyses with the same focus were also scrutinised. These study designs were selected to ensure the selection and pooling of the highest possible level of evidence based on the aims of this review.
18
In terms of population, we selected studies that included (not only exclusively) participants aged 60 years or older, reporting or having a diagnosis of food allergy. This cut-off age was used as criterion for considering an individual as “elderly” since our systematic review included studies from all over the world, and the World Health Organisation (W.H.O.) proposed 60 years as a working definition of an “older person” in African countries (11). In addition, although 65 years is recommended by W.H.O. as a cut-off level in western countries (12), and this is the threshold used in most studies in elderly individuals in those countries, there are some epidemiological studies also performed in such countries which use the 60 year cut-off age for identifying elderly people (6). This will ensure that our study is fully inclusive.
The following study designs were excluded: narrative literature reviews, discussion papers, non-research letters and editorials, case studies and case series, animal studies.
2.4. Study selection
Titles and abstracts of included papers were independently checked by two investigators (ILD and CLI) as “include”, “exclude” or “unclear”. The full text of all potentially eligible studies, as well as those that had been marked as “unclear” were retrieved and independently assessed against the inclusion criteria (see above) by two reviewers. The reviewers decided which of the studies fitted the inclusion criteria: any disagreements were resolved by discussion, with a third researcher (LTB) used to arbitrate the process.
To ensure transparency, the process of selection was summarised using a PRISMA flow diagram.
2.5. Data extraction
Data from selected articles were extracted independently by two reviewers (ILD and JG) who transferred data from their original presentation to a proper form made in Microsoft Excel© software, adapted for each food subgroup, with each study receiving a reference code (see Appendix V for details). Any discrepancy was resolved by discussion with the third reviewer (LTB). When an article presented results from N different studies, then, N different forms were created to collect data. Before using the form, we tested it in a pilot extraction step with a selected sample of studies. This allowed us to check the capacity of the constructed to capture the relevant information that was to be used for analysis.
Indirect data were also collected from figures and charts, adapting their interpretation from two different authors by consensus, and authors of some of the original articles were also contacted for further information and retrieval of additional data. In articles in which data from elderly patients were analysed together with those from non-elderly patients, authors
19
were also contacted in order to clarify or make available data pertaining to the former group, for subgroup analyses.
2.6. Data items
The following information was collected from selected studies involving elderly individuals, using the same approach that was previously used in a systematic review protocol which involved all epidemiological parameters of food allergies in European individuals of various ages but which did not focus on elderly individuals (13): a) Frequency of food allergy (i) by self-report; ii) by clinical symptoms plus positive SPT or IgE to food allergens; iii) by clinical symptoms, positive SPT or IgE to food allergens and also food challenge confirmed; b) Most frequently involved food allergens; c) Most frequently observed symptoms and symptom clusters; d) Time trends in frequency of food allergy; e) Geographical differences in the prevalence of food allergy and related food allergens, f) Risk factors for food allergy.
2.7. Outcome assessment
Diverse methods of assessment have been used to define food allergy in different studies. Thus, for estimation of the prevalence (point, period and lifetime prevalence) and incidence (incidence rate, cumulative incidence) of food allergies, we included all methods that were used in previous primary studies, including self-reported assessment, clinician diagnosis, allergic sensitisation (based upon skin prick test results, food allergen-specific IgE levels, skin atopy patch tests) and food challenges (open, single-blinded, double-blinded). However, our analysis took into account each such type of operational definition of food allergy in epidemiological studies.
Regarding the analysis of risk factors and clinical manifestations of adverse food reactions, we only included reports that have studied objectively confirmed food allergic reactions (using food challenges), since this ensured the most robust approach to assessing a potential causal relationship between the studied risk factors and the studied outcome (food allergy as expressed by food-induced symptoms in a food challenge). This approach was also followed by the previously mentioned systematic review by Nwaru et al (1), which studied the epidemiology of food allergy for all ages, in Europe (1).
2.8. Risk of bias assessment strategy
Risk of bias assessment was independently verified by two different reviewers (ILD and JG), for each individual study that was selected, using the respective Critical Appraisal Skills Programme (CASP) quality assessment tool for the types of included studies, including assessment of internal and external validity (14-16). We assessed heterogeneity, consistency and risk of bias. For each possible answer 0, 1 or 2 points were given to each
20
question/parameter, for the following options “No”, “Can’t tell” and “Yes”, respectively. All studies and their individual elements were graded in terms of adequacy of the study regarding the research question, risk of selection bias, measurement of exposure, and assessment of outcomes. Disagreements were resolved by a third reviewer (LTB).
2.9. Analysis, data synthesis and reporting
A narrative synthesis of the data was performed. In addition, a descriptive summary with data tables was elaborated, in order to summarise literature findings (17), and when deemed clinically relevant and statistically adequate, meta-analysis using random-effects modelling was carried out (18-20).
A random-effects meta-analysis was performed for the self-reported food allergy to estimate the prevalence of each specific food group (seafood, nuts, peanuts, fruits, milk (included cheese) and others). Also, a pooled prevalence of the self-reported food allergy was estimated using the inverse variance method. The confidence intervals (CI) for each prevalence was taken at 95%. Statistical heterogeneity between studies was assessed by Cochran’s Q test and by I2 index (p<0.05 considered statistically significant). Statistical
analysis was undertaken using Comprehensive Meta-Analysis, version 3.3.
Forest plot and funnel plot charts were made, when necessary, to compare results or to identify publication bias, since publication bias leads to funnel plot asymmetry, if 10 or more relevant studies are detected (21). Begs and Egger’s methods were used for testing such funnel plot asymmetry (22, 23). Heterogeneity between studies was analysed using the I2 statistical index (24). Statistical analysis was carried out using Software Package for Social
Sciences (SPSS) version 25.0®. Finally, the PRISMA-P statement and checklist were followed for reporting of the systematic review (25, 26).
2.10. Ethics, dissemination and data protection
Ethical approval was not obtained since the data to be collected and analysed cannot be linked to specific individuals. A data management plan was implemented in cases in which data from specific studies could be accessed directly or obtained from article authors. Retrieved data were kept in a database that will have protected access and was only used by the involved authors.
21
3. Results
3.1. Protocol
The protocol of this systematic review was submitted for publication in BMJ Open and is awaiting reviewer reply, and was presented at “Primeiras Jornadas de Investigação Clínica do Centro Académico Clínico das Beiras” as a selected poster (see Appendix VII, VIII).
3.2. Systematic review
3.2.1. Study selection and characteristics
Our initial database searches identified 31,059 articles and an additional set of 2 studies through hand searches and expert suggestions, which yielded a total of 31,061 articles for screening (Figure 1).
After removal of duplicates, we were left with 12,869 articles for further screening. On the basis of title and abstract reading, and based upon pre-defined exclusion criteria, 12,651 articles were excluded. Most of these papers were excluded because they focused on various aspects of gastrointestinal problems, but not food allergy; the remainder were excluded because they only focused on children or young adults. Thus, the full texts of 219 articles were examined in greater detail. Of these articles, 140 were excluded for not being population-based, for clearly not including elderly individuals, or for various other reasons, leaving 79 papers. Of these, 67 papers were excluded for various reasons (described in Figure 1 flowchart), and 14 papers were included in the narrative synthesis, corresponding to 12 primary studies, out of which 7 studies were included in at least one meta-analysis.
Of the studies reviewed, there were 2 systematic reviews, 11 were cross-sectional studies. The 12 primary studies were conducted in six European countries - Finland, Portugal, Poland, Sweden, Germany and Italy - and one North American country - United States of America.
22
Figure 1. PRISMA - Preferred Reporting Items for Systematic Reviews and Meta-Analyses flow diagram for studies on the epidemiology of food allergy in elderly individuals
A summary of the analysis of each study included in qualitative synthesis is shown in Table 1. For more details, see Appendix VI (table 5).
23
Table 1. Summary of the characteristics of studies included for qualitative analysis: studies published worldwide until February 2019.
Study name Country/ Region Design Method of outcome
assessment Food groups included Treatment Sample size (60+)
Soost, 2009 Germany sectional
Cross-IgE SPT FA in total (no specific foods mentioned) Non-randomized 868
Isolauri, 2004 Finland sectional Cross- IgE SR Milk/Milk derivatives randomized Non- 100
Rentzos, 2019 Sweden sectional
Cross-SR IgE Milk/Milk derivatives Fruit Nuts Seafood Other/Any foods Non-randomized 332
Lozoya, 2016 Portugal sectional
Cross-SR SPT Milk/Milk derivatives Fruit Nuts Seafood Other/Any foods Non-randomized 230
Ventura, 2010 Italy sectional
Cross-SR SPT FA in total (no specific foods mentioned) Non-randomized 137
Emmett, 1999 U.S. sectional Cross- SR
Milk/Milk derivatives Fruit Nuts Seafood Other/Any foods Non-randomized 2880
Gupta, 2019 U.S. sectional Cross- SR
Milk/Milk derivatives Nuts Seafood Other/Any foods Non-randomized 10218 Mossakowska,
2008 Poland sectional Cross- SR
Fruit Other/Any foods
Non-randomized 301
Sicherer, 2004 U.S. sectional Cross- SR Seafood randomized Non- 1876
Sicherer, 2003 U.S. sectional Cross- SR Nuts randomized Non- 1700
Sicherer, 2010 U.S. sectional Cross- SR Nuts randomized Non- 3091
Vierk, 2007 U.S. sectional Cross- SR
FA in total (no specific foods mentioned) Non-randomized 991
24
3.2.2. Risk of bias assessment
The details of the risk of bias grading can be seen in Table 2.
Table 2. Summary of the characteristics of studies included for qualitative analysis: studies published worldwide until February 2019.
Study name CASP Checklist used Bias grading
Soost, 2009 Cohort study Moderate Isolauri, 2004 Cohort study Weak Rentzos, 2019 Cohort study Weak
Lozoya, 2016 Cohort study Weak
Ventura, 2010 Cohort study Weak Emmett, 1999 Cohort study Strong
Gupta, 2019 Cohort study Moderate
Mossakowska, 2008 Cohort study Strong Sicherer, 2004 Cohort study Moderate Sicherer, 2003 Cohort study Moderate Sicherer, 2010 Cohort study Moderate
Vierk, 2007 Cohort study Strong
Out of the twelve primary studies selected for this systematic review, four were graded as weak, five as moderate and three as strong risk of bias.
3.2.3. Frequency of food allergy
Table 3. Summary of the overall pooled point prevalence of food allergy in the elderly.
Study name Sample size SR (95% CI) (95% CI) SR + IgE SR + SPT (95% CI) Isolated IgE (95% CI) Soost, 2009 868 reported Not 27.53 32.95 reported Not Isolauri, 2004 100 13 7.00 reported Not reported NotRentzos, 2019 332 18.98 Not reported Not reported 10.84 Lozoya, 2016 230 4.35 reported Not 1.30 reported Not
Ventura, 2010 137 32.12 Not reported 8.03 Not reported Emmett,
1999 2880 4.20 reported Not reported Not reported Not Gupta, 2019 10218 18.77 reported Not reported Not reported Not Mossakowska, 2008 301 3.32 Not reported Not reported Not reported
25 Sicherer, 2004 1876 5.76 Not reported Not reported Not reported Sicherer,
2003 1700 1.71 reported Not reported Not reported Not Sicherer,
2010 3091 1.33 reported Not reported Not reported Not Vierk, 2007 991 9.59 reported Not reported Not reported Not
For more details on the prevalence of food allergy, see Appendix VI (table 6).
Prevalence of food allergy: self-report
All but one study (29) evaluated self-reported prevalence of food allergy. The overall pooled point prevalence of self-reported food allergy in people over 60 years old was 11.2% (95% CI 1.3-32.1%), which was higher than that in children - 2.5% (95% CI 1.3-14.0%) - and adults – 5.8% (95% CI 2.5-38.6%).
However, there was significant heterogeneity between the studies.
Prevalence of food allergy: self-report + food-specific IgE levels
Three studies (27-29) evaluated food-specific IgE levels of food allergy. Only one study (27) used the measurement of food-specific IgE levels to further the evaluation of the prevalence of food allergy in children and only did so for cow’s milk/dairy products.
The overall pooled point prevalence positive SR + food-specific IgE levels in people over 60 years old was 25.41% (95% CI 7.00-27.53%), lower than that in adults – 232.71% (95% CI 2.50-35.27%), and higher than that in children – 9%.
Prevalence of food allergy: self-report + skin prick test
Three studies (29-31) analysed the prevalence of food allergy by SPT, and Ventura et al (31) did so only in the over 60 years old sub-group.
The overall pooled point prevalence of positive SR + SPT in people over 60 years old was 24.29% (95% CI 1.30-32.95%), lower than that in adults – 39.17% (95% CI 3.93-48.28%). No results were obtained in any of these studies regarding children.
Prevalence of food allergy: oral food challenge
None of the selected studies carried out oral food challenges to measure the prevalence of food allergy in the over 60 years old sub-group, nor in children. Lozoya et al (30) did so in two adult subjects, with 1 positive OFC for fish allergy.
Prevalence of food allergy: double-blind placebo-controlled food-challenge
26
Prevalence of food allergy: isolated food-specific IgE levels
One study (28) reported the prevalence of isolated food-specific IgE levels.
The prevalence of food allergy using this method of outcome assessment was, therefore, 10.84% in the elderly, lower than that in adults (18.45%). The study did not account for the prevalence of food allergy in children.
Prevalence of food allergy according to food group
Milk and milk derivatives
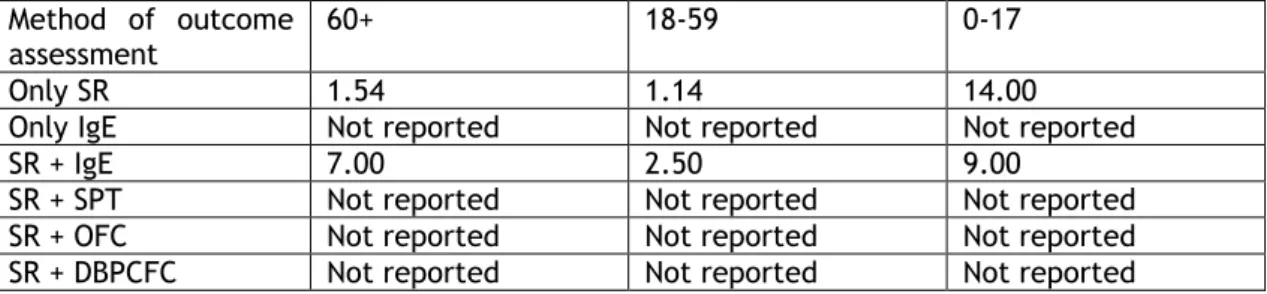
The prevalence of allergy to milk/milk derivatives was presented in 5 studies (27, 28, 30, 32, 33) with two different methods of outcome assessment: milk-specific IgE levels (27) and self-report. The prevalence of milk allergy in children was only measured by 1 study (27). The point prevalence of milk/milk derivatives allergy as by SR + milk-specific IgE levels was 7.00% in the elderly, comparable to that in children (9.00%) and higher than that in adults (2.50%).
The point prevalence of milk/milk derivatives allergy as by self-report was 1.54% (95% CI 0.43-13.00%) in the elderly, higher than that in adults – 1.14% (95% CI 0.93-12.00%) – and lower than that in children - 14.00%.
For more details on the prevalence of allergy to milk/milk derivatives, see Appendix VI (table 7).
Fruits
Four studies (28, 30, 32, 34) presented the prevalence of self-reported fruit allergy. One study (30) presents the results of the SPT performed after self-reported allergy to fruits. Two studies specified the reported fruits – strawberries, bananas and oranges (34) and apple, apricot, banana, cherry, dried fruit, kiwi, lingonberry, melon, nectarine, orange, peach, pear, plum, strawberry and avocado (28).
The overall pooled point prevalence of self-reported fruit allergy was 2.00% (95% CI 0.42-17.17%) in the elderly. Three studies (28, 30, 32) provided data for the comparison with the general adult population, which had an overall pooled self-reported fruit allergy prevalence of 3.08% (95% CI 0.55-52.96%), higher than that in the elderly. No studies presented the prevalence of allergy to fruit in children.
The prevalence of fruit allergy as by SR + SPT (30) was 0.43% in the elderly, lower than that in adults (0.98%).
For more details on the prevalence of fruit allergy, see Appendix VI (table 8).
Nuts
The self-reported prevalence of allergy to isolated peanuts or other nuts was presented in 6 studies (28, 30, 32, 33, 35, 36) while allergy to both peanuts and other nuts, simultaneously, was presented in 2 studies (35, 36). Four studies referred the specific other
27
nuts analysed as by self-report - tree nut, walnut, almond, hazelnut, pecan, cashew, pistachio, other tree nuts (33); almond, Brazilian nut, chestnut, hazelnut and walnut (28); tree nut (35, 36). Only 2 studies (35, 36) presented the relevant data in the children sub-group.
The overall pooled point prevalence of allergy to peanuts in the elderly, as by self-report, was 0.82% (95% CI 0.00-2.11%), higher than that in both adults – 0.23% (95% CI 0.00-4.08%) – and children – 0.70% (95% CI 0.47-0.94%). The prevalence of isolated peanut-specific IgE (28) in the elderly was 2.71%, lower than that in adults (5.77%).
The overall pooled point prevalence of self-reported allergy to other nuts in the elderly was 2.15% (95% CI 0.00-9.94%), higher than that in adults – 0.59% (95% CI 0.33-27.46%) – and children – 0.46% (95% CI 0.24-0.70%). The prevalence of isolated specific-IgE levels to nuts was reported only in 1 study (28) as 8.73% in the elderly, lower than that in adults (21.13%). The prevalence of allergy to other nuts by SR + SPT (30) in the elderly was 0.00%, lower than that in adults (0.33%).
The overall pooled point prevalence of self-reported allergy to both peanuts and other nuts in the elderly was 0.06% (95% CI 0.12%), lower than that in adults – 0.22% (95% CI 0.00-0.27%) – and children – 0.34% (95% CI 0.24-0.45%). The prevalence of allergy to both peanuts and other nuts by SPT (30) in the elderly was 0.00%, lower than that in adults (0.16%).
Seafood
Four studies (28, 30, 33, 37) presented the prevalence of self-reported shellfish allergy, and one that of SPT (30). Five studies (28, 30, 32, 33, 37) presented the prevalence of self-reported allergy to fish. Two studies (30, 37) presented the prevalence of self-self-reported allergy to both fish and shellfish, simultaneously, as well as allergy to any/other seafood, as by self-report. One study (30) also reported the prevalence of allergy to fish and shellfish by SR + SPT. The prevalence of seafood in children was only reported in one study (37). The overall pooled point prevalence of shellfish allergy in the elderly was 9.16% (95% CI 0.90-10.73%), higher than that in adults – 0.62% (95% CI 2.30-3.52%) – and children – 0.50%. The prevalence of allergy to shellfish by SPT in the elderly was 0.00%, lower than in adults (1.64%).
The overall pooled point prevalence of self-reported fish allergy in the elderly was 0.64% (95% CI 0.00-0.87%), higher than that in adults – 0.56% (95% CI 0.42-1.15%) – and children – 0.17%. The prevalence of fish allergy by SR + SPT in the elderly was 0.43%. The prevalence of fish allergy by SR + OFC in the elderly was 0.00%, lower than that in adults (0.16%). The prevalence of self-reported allergy to both fish and shellfish in the elderly was 0.05% (95% CI 0.00-0.005%), lower than that in adults - 0.21% (95% CI 0.16-0.21%) - and children (0.08%) -, and the prevalence of fish and shellfish allergy by SR + SPT in the elderly was 0.43%, higher than in adults (0.33%).
28
The prevalence of any/other seafood allergy by self-report in the elderly was 2.52% (95% CI 0.00-2.83%), lower than that in adults - 2.70% (95% CI 0.16-2.90%) - and higher than in children (0.58%).
Other foods
Five studies (28, 30, 32-34) analysed the prevalence of self-reported food allergy to other foods. One study (30) also reported the prevalence of food allergy by SR + SPT and one study (28) the one of isolated food-specific IgE levels. The specific foods reported in each study were: eggs, sesame, soy, wheat/flour/gluten, chocolate, pulses and others (32); wheat, soy, sesame and eggs (33); rye, rabbit meat, pig meat, snails, sausages, honey, chocolate, biscuits, eggs and others (30); eggs, pepper, garlic, chamomile and ice cream (34); anise/caraway, bean, beef, chamomile, carrot, cayenne/red pepper, chicken, celery, chilli/tabasco, chocolate, coriander, curry, eggs, flour (non-wheat), flour (wheat), fried/fat food, parsley, pea, poppy seed, pork/pig, potato, red meat, salami, sour milk/yogurt, soy, sunflower seed, sweet pepper, tomato, wine/beer and others (28).
The overall pooled point prevalence of self-reported allergy to other foods in the elderly was 0.92 % (95% CI 1.66-15.96%), lower than that in adults – 4.74% (95% CI 1.48-45.35%). The prevalence of allergy to other foods by SR + SPT in the elderly was 0.00%, lower than that in adults (1.49%) and the prevalence of allergy to other foods by isolated food-specific IgE levels in the elderly was 3.61%, higher than that in adults (2.96%).
For more details on the prevalence of allergy to other foods, see Appendix VI (table 9).
3.2.4. Clinical characteristics
Only one study (30) presented the clinical characteristics in the over 60 years of age sub-group. The referred clinical characteristics had the following prevalence in the elderly: acute urticaria/angioedema – 2.17% as by self-report (3.93% in adults) and 0.87% after SPT (2.95% in adults); abdominal symptoms – 0.43% as by self-report (0.66% in adults) and 0.43% after SPT (0.33% in adults); respiratory – 0.43% as by self-report (1.31% in adults) and 0.00% after SPT (0.16% in adults); OAS – 1.30% as by self-report (1.15% in adults) and 0.43% after SPT (0.33% in adults); ocular – 0.43% as by self-report (0.49% in adults) and 0.00% after SPT (0.00% in adults); anaphylaxis – 0.00% as by self-report (0.00% in adults) and 0.00% after SPT (0.16% in adults); other – 0.00% as by self-report (0.82% in adults) and 0.00% after SPT (0.16% in adults).
3.2.5. Predominant foods associated with food allergy
Due to the heterogeneity of study methods across reports, we were unable to calculate whether there were specific foods predominantly associated with allergic reactions in the elderly.
29
3.2.5. Time trends in the frequency of food allergy
Of all included studies, only two (35, 36) allowed inferring time trends in the frequency of food allergy in elderly patients, but only for specific foods (nuts). In this context, the overall prevalence of peanut and tree nut allergy remained relatively the same in both elderly (above 61 years of age) and non-elderly adult (18-60 years old) populations over the course of 13 years (1997-2010).
No other time trends were found in our analysis.
3.2.6. Geographical trends
The 12 studies included in the systematic review were conducted in 6 European countries - Finland, Portugal, Poland, Sweden, Germany and Italy - and 1 North American country - United States of America.
However, due to the heterogeneity of study methods across reports, we were unable to calculate whether there were significant differences in the geographical distribution of food allergy in the elderly, either in general terms or in terms of specific foods.
3.2.7. Risk and prognostic factors for food allergy
Of the 12 studies included in the systematic review, the data were embedded in the adult sample, and none focused on risk or prognostic factors for food allergy in the elderly, and therefore we were unable to calculate whether such an association can be made for any specific disease, condition or lifestyle.
3.3. Meta-analysis
Seven studies were used in this meta-analysis (27, 30, 32, 34-37) with a total of six food groups analysed – fruits, milk and derivatives (milk), nuts, peanuts, seafood and others.
Two articles (28, 33) were only used in the systematic review, and not in the meta-analysis, since the available data suggested that there was a high probability of allergy to more than one food in the same individual, which would erroneously raise the prevalence of food allergy for each of the food groups studied.
30
Table 4. Self-reported food allergy prevalence. Random-effects meta-analysis
Fruits Number of studies 3 Number of participants 3411 Prevalence (%) (95% CI) 0.7 (0.2 – 2.0) Milk Number of studies 3 Number of participants 3210 Prevalence (%) (95% CI) 1.8 (0.2 – 17.0) Nuts Number of studies 3 Number of participants 7671 Prevalence (%) (95% CI) 0.6 (0.3 – 1.3) Peanuts Number of studies 3 Number of participants 7671 Prevalence (%) (95% CI) 0.5 (0.3 – 0.7) Seafood Number of studies 3 Number of participants 4986 Prevalence (%) (95% CI) 1.2 (0.3 – 5.2) Others Number of studies 3 Number of participants 3411 Prevalence (%) (95% CI) 2.2 (1.8 – 2.8)
There was great heterogeneity between studies for each food group, with heterogeneity being lowest for others (I2=00.000%) and highest for milk (I2=97.142%).
31
Figure 2. Forest plot for the pooled prevalence of self-reported food allergy for each food type. Fruits: τ2=0.580, χ 2=6.909, df=2, p=0.032, I2=71.052% Milk: τ2=4.276, χ 2=69.975, df=2, p<0.001, I2=97.142% Nuts: τ2=0.448, χ 2=14.369, df=2, p=0.001, I2=86.081% Others: τ2=0.000, χ 2=0.740, df=2, p=0.691, I2=0.000% Peanuts: τ2=0.075, χ 2=3.593, df=2, p=0.166, I2=44.342% Seafood: τ2=1.651, χ 2=38.008, df=2, p<0.001, I2=94.738% Group by Food
Study name Event rate and 95% CI
Event Lower Upper Relative
rate limit limit Total weight
Fruits Mossakowska 2008-II 0,017 0,007 0,039 5 / 301 37,39
Fruits Emmett 1999-V 0,004 0,002 0,007 12 / 2880 44,13
Fruits Lozoya 2016-III 0,004 0,001 0,030 1 / 230 18,49
Fruits 0,007 0,002 0,020
Milk Emmett 1999-VI 0,007 0,004 0,011 20 / 2880 35,58
Milk Lozoya 2016-IV 0,004 0,001 0,030 1 / 230 29,15
Milk Isolauri 2004 0,130 0,077 0,211 13 / 100 35,27
Milk 0,018 0,002 0,170
Nuts Sicherer 2003-I 0,012 0,008 0,018 20 / 1700 35,57
Nuts Sicherer 2010-I 0,006 0,004 0,010 20 / 3091 35,59
Nuts Emmett 1999-II 0,002 0,001 0,005 6 / 2880 28,84
Nuts 0,006 0,003 0,013
Others Mossakowska 2008-I 0,017 0,007 0,039 5 / 301 6,70
Others Emmett 1999-IV 0,023 0,018 0,029 66 / 2880 87,94
Others Lozoya 2016-II 0,017 0,007 0,045 4 / 230 5,36
Others 0,022 0,018 0,028
Peanuts Sicherer 2003-II 0,004 0,002 0,009 7 / 1700 25,56
Peanuts Sicherer 2010-II 0,006 0,004 0,010 20 / 3091 44,51
Peanuts Emmett 1999-III 0,003 0,002 0,006 9 / 2880 29,93
Peanuts 0,005 0,003 0,007
Seafood Sicherer 2004 0,028 0,022 0,037 53 / 1876 35,20
Seafood Emmett 1999-I 0,003 0,001 0,006 8 / 2880 33,10
Seafood Lozoya 2016-I 0,022 0,009 0,051 5 / 230 31,69
Seafood 0,012 0,003 0,052
Overall 0,015 0,012 0,018
-0,22 -0,11 0,00 0,11 0,22 Prevalence
32
4. Discussion
4.1. Statement of principal findings
To the best of our knowledge, this is the first systematic review specifically focusing on food allergy in elderly individuals. Overall, very few studies addressing this issue were detected and, in most cases, results were embedded in general results for adults, which forced us to contact the authors, in order to retrieve data from the elderly subgroup.
The definition of food allergy varied greatly across studies, with a relative predominance of self-report in comparison with double-blind placebo-controlled food-challenge, the gold-standard for the diagnosis of food allergy. The sole use of self-report is, in itself a confounding factor and adds to over and/or underestimation of the prevalence of food allergy. Even when the self-reported food allergies were followed-up with testing for food-specific IgE levels or SPT, this only allows the diagnosis of a probable food allergy, not a definitive food allergy. One study (28) only used the measurement of food-specific IgE levels to evaluate the prevalence of food allergy in a random population, which could overestimate the prevalence of food allergy, as isolated positive food-specific IgE levels only account for hypersensitivity to that food, and not a true food allergy. This poor methodological quality was reflected in the overall strong bias rating of included studies.
Although the clinical manifestations and risk and prognostic factors associated with food allergy were reported in six studies (27, 28, 30-33), five (27, 28, 31-33) did not provide the relevant data for the elderly population, only doing so for the total sample of participants (adults with elderly embedded in the sample), which kept us from being able to use this data in our analysis. Only one author (30) responded with the necessary data, and thus the clinical manifestations reported in said study were then used in ours.
4.2. Comparison of our findings with previous studies
This is the first systematic review that focused on the prevalence of food allergy specifically in the population over 60 years old.
Three other systematic reviews (1-3) proposed to analyse the epidemiology of food allergy but failed to characterise its prevalence in the elderly, thus including all people over 60 years old in the adult sub-group. In fact, in all three, the only comparison was made between the children sub-group and that of the adults. This means we could not compare our data regarding the prevalence of food allergy in the elderly directly with theirs. As it is in our systematic review, the overall pooled point prevalence of self-reported food allergy in the
33
elderly was higher than that in both children and adults, and that by food-specific IgE levels in both the elderly and adults were higher than in children, while in the systematic review by Nwaru et al (1) such prevalence was higher in children than in adults.
One fact mentioned in all three systematic reviews was the great heterogeneity of results and studies analysed. We, too, found great heterogeneity in our results and selected studies, whether it be in the systematic review or the meta-analysis.
Another point of concordance between ours and the other three systematic reviews was the fact that most published studies on food allergy and its prevalence, resorted only to self-report as a method of outcome assessment, few used SR + food-specific IgE levels or SPT and fewer used the oral food challenge, or the gold-standard double-blind placebo-controlled food challenge, to confirm the diagnosis of a food allergy. However, when it comes to the prevalence of food allergy based upon self-report and its comparison with the data from studies using SR + food-specific IgE levels or SPT, some discrepancies arise. Whereas in our study the prevalence of food allergy was higher when it was based on SR + food-specific IgE levels or SR + food-specific SPT results, in Nwaru et al (1), the prevalence of food allergy was higher in studies using self-report than in those using SR + SPT, although it was lower than that seen in studies based on SR + food-specific IgE levels. In Rona et al (2) and Chafen et al (3) however, self-reported food allergy had a higher prevalence than that with any other method of outcome assessment. The latter observation is more in line with most cross-sectional studies since patients tend to over-report food allergy (30, 38-40), and therefore in most studies at a global scale, the prevalence of food allergy as by self-report tends to be higher than that from SR + IgE, SR + SPT or the gold-standard SR + DBPCFC.
4.3. Strengths and limitations
This systematic review provides the first and, to our knowledge, only analysis of the prevalence and characteristics of food allergy in the elderly populations. More specifically, one strength of the review is that it is novel in that it provided various estimates of the worldwide prevalence of food allergy in this subgroup of adults. However, due to the low number of studies involving elderly individuals, as well as the difficulty in obtaining results from certain authors and the nature of the selected studies, we were unable to calculate other aspects that we had initially proposed ourselves to: a) Time trends in prevalence of food allergy and related food allergens; b) Predominant foods associated with food allergy; c) Most frequent food-induced symptoms; d) Geographical variations; e) Food-specific induction of symptoms or risk factors for food allergy; f) Risk and prognostic factors associated with food allergy in the elderly. Most studies either did not have the necessary data in their scope of results or, if present, the data did not permit its analysis with regards to the elderly, even after contacting the authors.
34
Several measures and steps were undertaken regarding the comprehensive search strategy, selection of electronic databases, absence of language restrictions and the overall abstract and full-text selection process, in order to ensure that no relevant studies went unseen and also to minimise selection bias. Unlike that of Nwaru et al (1), our systematic review did not have any limitations regarding the geographical origin of the selected articles, nor their language or date of publication. Additionally, while two previous systematic reviews only searched four (1, 2) or three (3) electronic databases, we extended our research to a total of twelve electronic databases and added a manual search of any relevant studies within the references of all articles found.
This strategy, however, culminated in a too large a sample to analyse in the time frame in place, which made the selection process more difficult than anticipated.
Adding to this, there was also a significant level of difficulty in accessing all relevant data within the final selected studies, either because of the way data were presented in the articles (with or without confidence intervals and p-values, randomised or not), incomplete reports and missing results or because of the ambiguity with which data regarding people over 60 years of age were reported (age range not mentioned or absence of sample size). Most studies focused solely on the general adult population with the inclusion of people over 60 in the total sample of adults. Where this happened, the authors were contacted, but very few replied or were able to provide the necessary data, which kept us from using possibly relevant studies in our systematic review and, with it, reaching more significant conclusions with regard to food allergy in the elderly. When contacted authors did reply, a back and forth chain of communication were kept in order to maximise the shared data.
With regards to the heterogeneity found, it is possible that various factors may have contributed to this, namely differences in the selection of the subject samples, the operational definition of food allergy, specific foods that were analysed and the methods of outcome assessment. Even in studies in which the same foods were analysed, or the same method of outcome assessment was used, such as self-report, for instance, not all questionnaires were validated by a group of specialists in the diagnosis of food allergies (34), and therefore not all questionnaires asked the same questions or focused on the same aspects. Additionally, some studies went beyond questionnaires and underwent sequential steps for the confirmation of probable food allergy (27, 28, 30, 31) such as the measurement of food-specific IgE levels or SPT, although none used DBPCFC, the gold-standard for definitive diagnosis.
In addition, criteria for the classification of a food allergy varied greatly between studies, independently of being by self-report, SR + food-specific IgE levels or SR + SPT, combinations thereof or even only isolated measurement of food-specific IgE levels (28), which could
35
overestimate the prevalence of food allergy, as isolated positive food-specific IgE levels only account for hypersensitivity to that food, and not a true food allergy.
Furthermore, specific foods studied also varied greatly, thus making it harder to assess their actual predominance in food allergy in the elderly. Some studies (35-37) limited their assessed foods to specific food groups (seafood or nuts, for instance) and therefore may have missed subjects with food allergies other than those they were looking for.
4.4. Conclusions
In terms of prevalence of food allergy in the elderly, that of self-report (11.22%) was lower than that of SR + food-specific IgE levels (25.41%) and SR + SPT (24.29%). The prevalence of food allergy in the elderly was higher than that in children (when data were available) for all methods of outcome assessment, and higher than that in adults only with self-report.
Regarding the prevalence of allergy to specific foods in the elderly, in comparison with the adults, the elderly had a higher prevalence of allergy to milk (both SR and IgE), peanuts (SR), other nuts (SR), shellfish (both SR and SPT), fish (SR) and other foods (IgE). When compared with children, the elderly had a higher prevalence of allergy to peanuts (SR), other nuts (SR), shellfish (SR), fish (SR) and any seafood (SR).
No results were obtained regarding the time and geographical tendencies, predominant foods, risk and prognostic factors, and clinical manifestations of food allergy in the elderly.
There was great heterogeneity both in the systematic review and the meta-analysis, with it being the highest for milk and derivatives (I2=97.142%), moderate for peanuts (I2=44.342%)
and lowest for others (I2=0.000%).
Given the large amount of studies that focus on food allergy in general, and especially in the paediatric age range, the lack of investment regarding analysis of food allergy in people over 60 years of age has made it clear to us that there is a need for its investigation in the future, in order to better understand its true impact in society.This information may be crucial to the analysis of the similarities and differences regarding food allergies between elderly and non-elderly individuals and eventually defining preventive or diagnostic approaches specifically tailored to this age range.
We highly recommend that future studies use the double-blind placebo-controlled food-challenge as their definition of food allergy or, if not feasible, food-specific IgE levels and skin prick tests, instead of simply using self-report.
36
5. Future Prospects
As the first systematic review focusing on the prevalence of food allergy in the elderly, our work shed light on the lack of studies regarding this topic, in contrast with studies on the epidemiology of food allergy in children and even in the general adult population. It is of the utmost importance that studies regarding this issue become more prominent in the scientific community, and that clinicians become versed in the diagnosis, care and management of the elderly with food allergy. As such, there is a need for further future investigations regarding the prevalence of food allergy in people over 60, with the scope of establishing time and geographical trends, predominant foods involved, clinical manifestations, risk and prognostic factors and quality of life, in order to significantly contribute towards understanding the clinical and epidemiological significance of food allergy in this age range, at a global scale.
It is worthy of mention, however, that there should be an effort in all future studies to homogenise the method of outcome assessment, by privileging the gold-standard double-blind placebo-controlled food-challenge whenever possible, but also by establishing fixed diagnostic criteria in terms of all other methods, whether it be self-report, measurement of food-specific IgE levels or SPT. This would entail having a well-defined operational definition of “possible food allergy”, “probable food allergy” and “confirmed food allergy”, as suggested by the European Academy of Allergology and Clinical Immunology.
As for our systematic review, there has clearly been an interest from several contacted authors in the possibility of a collaboration with us, due to the contemporary relevance of the topic, in order to further its results and reach, globally, and we anticipate a continuation of the work we have done so far.
This systematic review also opens the possibility of a global epidemiological study, regarding the prevalence of food allergy in the elderly, with the collaboration of the best specialists and, so, the largest possible sample and most significant results. In fact, such a study is currently being planned, at a European level, with the involvement of our team.
37
References
1. Nwaru BI, Hickstein L, Panesar SS, Muraro A, Werfel T, Cardona V et al. The epidemiology of food allergy in Europe: a systematic review and meta-analysis. Allergy 2014; 69: 62-75. Doi: 10.1111/all.12305.
2. Rona RJ, Keil T, Summers C, Gislason D, Zuidmeer L, Sodergren E et al. The prevalence of food allergy: a meta-analysis. J Allergy Clin Immunol 2007; 120: 638-46. Doi: 10.1016/jaci.2007.05.026.
3. Chafen JJ, Newberry SJ, Riedl MA, Bravata D, Maglione M, Suttorp M et al. Diagnosing and managing common food allergies: a systematic review.
JAMA 2010; 303: 1848-56. Doi: 10.1001/jama.2010.582.
4. Tang MLK, Mullins RJ. Food allergy: is prevalence increasing? Intern Med J. 2017; 47: 256-261. Doi: 10.1111/imj.13362.
5. Jensem-Jarolim E, Jensen SAF. Food allergies in the elderly. Collecting the evidence. Ann Allergy Asthma Immunol. 2016; 117: 472-475. Doi: 10.1016/j.anai.2016.08.036.
6. Verrill L, Bruns R, Luccioli S. Prevalence of self-reported food allergy in U.S. adults: 2001, 2006, and 2010. Allergy Asthma Proc. 2015; 36: 458-467. Doi: 10.2500/aap.2015.36.3895.
7. United Nations, Department of Economic and Social Affairs, Population Division (2017). World Population Prospects: The 2017 Revision, Key Findings and Advance Tables. Working Paper No. ESA/P/WP/248
8. Diesner SC, Untersmayr E, Pietschmann P, Jensen-Jarolim E. Food allergy: only a pediatric disease? Gerontology. 2011; 57: 28-32. Doi: 10.1159/000279756.
9. Montanaro A. Allergic disease management in the elderly: a wakeup call for the allergy community. Ann Allergy Asthma Immunol. 2000; 85: 85e86. Doi: 10.1016/S1081-1206(10)62442-8.
10. Laia-Dias I, Lozoya-Ibáñez C, Gama J, Skypala I, Nurmatov U. Prevalence and risk factors for food allergy in elderly individuals: protocol for a systematic review. PROSPERO 2018: CRD42018102140 [Internet]. 2018 [updated 2019 Jan 31; cited May 2019].
Available from:
38
11. W.H.O. Health Statistics and Information Systems. Proposed working definition of an older person in Africa for the MDS Project. [Internet]. 2002 [cited 2019 Jan 7].
Available from:
https://www.who.int/healthinfo/survey/ageingdefnolder/en/
12. Orimo H, Ito H, Suzuki T, Araki A, Hosoi T, Sawabe M. Reviewing the definition of “elderly” Geriatr Gerontol Int. 2006; 6: 149-158. Doi: 10.1111/j.1447-0594.2006.00341.x.
13. Nwaru BI, Panesar SS, Hickstein L, Rader T, Werfel T, Muraro A et al. The epidemiology of food allergy in Europe: protocol for a systematic review. Clin Transl Allergy 2013; 3: 13. Doi: 10.1186/2045-7022-3-13.
14. CASP checklist for systematic reviews. [Internet]. 2018 [cited 2018 Dec 22]. Available from:
https://www.casp-uk.net/wp-content/uploads/2018/03/CASP-Systematic-Review-Checklist-2018_fillable-form.pdf
15. CASP checklist for cohort studies. [Internet]. 2018 [cited 2018 Dec 22]. Available from:
https://www.casp-uk.net/wp-content/uploads/2018/03/CASP-Cohort-Checklist-2018_fillable_form.pdf
16. CASP checklist for case–control studies. [Internet]. 2018 [cited 2018 Dec 22]. Available from:
https://www.casp-uk.net/wp-content/uploads/2018/03/CASP-Case-Control-Checklist-2018_fillable_form.pdf
17. Guyatt G, Oxman AS, Akl EA, et al. GRADE guidelines: 1. Introduction – GRADE evidence profiles and summary of findings tables. J Clin Epidemiol. 2011: 64: 383-394. Doi: 10.1016/j.clinepi.2010.04.026.
18. Agresti A, Coull BA. Approximate is better than “exact” for interval estimation of binomial proportions. Am Statis 1998; 52: 119-126. Doi: 10.2307/2685469.
19. Borenstein M, Hedges LV, Higgins JPT, Rothstein H. A basic introduction to fixed-effect and random-effects models for meta-analysis. Res Sunth Methods 2010: 1: 97-111. Doi: 10.1002/jrsm.12.