UNIVERSIDADE DA BEIRA INTERIOR
Engenharia
Towards an Integrated Solution to Physical
Assessment of Students
Jason Philip Sardo Costa
Dissertação para obtenção do Grau de Mestre em
Engenharia Informática
(2º ciclo de estudos)
Orientador: Prof. Doutor Paulo Fazendeiro
Acknowledgements
I would like to thank my thesis advisor and teacher Prof. Paulo Fazendeiro, for the guidance and help he provided during the course of this work. I would also like to thank Prof. Filipe Ferreira, which planned and made possible the school accelerometry dataset collection. His help and availability were really essential to the development of this work. I am also in debt to his students, class 8ºA and 8ºB, who gladly accepted to participate in this study. I also want to thank my girlfriend Sofia, for helping me develop a business model of the solution presented in this work, and for keeping me motivated when it was most needed. Lastly but not least, thank you to all my family, friends and colleagues that helped me to complete this journey.
Resumo
No presente trabalho é proposta uma solução de suporte ao sistema de avaliação de alunos no âmbito das aulas de educação física. Foram recolhidos dados de acelerometria de alunos durante a execução de diversas atividades, através da utilização de um smartphone e de uma aplicação móvel desenvolvida para o mesmo. Os dados de acelerometria recolhidos são usados para extração de informações relacionadas com atividade física, tais como gastos energéticos, número de passos e intensidade da atividade. Estes dados encontram-se disponíveis numa aplicação web desenvolvida, que apresenta os gráficos de atividade e informações relativas ao aluno. O objetivo principal deste estudo é o desenvolvimento de uma solução para complementar o processo de avaliação no contexto de aula de educação física, fornecendo informações relativas à atividade física do aluno. Esta informação estará sumariada e prontamente disponível de forma a ajudar e complementar o processo de avaliação do professor. Ao envolver também os alunos neste processo, espera-se que estes apresentem uma maior motivação para a prática de um estilo de vida mais ativo, fornecendo-lhes informações visuais sobre a sua atividade, o que lhes permitirá comparar resultados entre eles e, possivelmente mais importante, avaliarem a sua própria evolução.
Os dados de acelerometria são disponibilizados de forma gratuita à comunidade, assim como a aplicação móvel para recolha de dados de acelerometria, juntamente com o seu código fonte. As experiências efetuadas forneceram a prova de conceito necessária para promover esta solução como um valioso aliado no processo de avaliação em aula. Além disso, estas experiências foram essenciais para verificar o valor prático da métrica de avaliação proposta num ambiente de aula de educação física tecnologicamente heterogéneo.
Como efeito deste trabalho, um grande conjunto de informação relativa à atividade física do aluno do foi produzido. Este conjunto de dados apresenta algum desafio relativamente à identificação de atividades e é disponibilizada de forma gratuita à comunidade de aprendizagem automática.
Palavras Chave
Métrica de avaliação física, acelerometria, estimativa de gastos energéticos, sistema de suporte à avaliação, reconhecimento de atividade, motivação do estudante, biblioteca de dados de acelerometria.
Abstract
In this work, we propose a solution to support the student’s assessment process in physical education classes. Student’s accelerometry data performing several activities was collected using a smartphone and a developed mobile client. The collected accelerometry data is used for activity information extraction such as energy expenditure, number of steps and activity intensity. This information is displayed in a developed web application along with charts and student information.
The main goal of this work is to develop a solution to complement the physical education class assessment process, by providing student’s activity information extracted from accelerometry data. This information is summarized and made readily available as a mean to aid and complement the teacher’s assessment process and grading system. By involving the students in the new class assessment system we also hope to motivate them to practice a more active lifestyle, providing them with visual information about their activity and allowing them to compare statistics between each other and, perhaps more important, evaluate their own evolution.
The collected accelerometry dataset is made public to the community, as well as a free and open source mobile client for data collection.
The performed experiments provided the necessary proof of concept to promote this solution as a valuable ally in the student assessment process in class. Moreover, these were essential to verify the actual practical value of the proposed assessment metric in a technologically heterogeneous physical education class environment.
As a side effect a great set of information regarding student’s activity was produced. This dataset poses some hard challenges regarding activity identification and is made freely available to the machine learning community.
Keywords
Physical assessment metric, accelerometry, energy expenditure estimation, grading support system, activity recognition, student motivation, accelerometry dataset.
Contents
1.Introduction ... 19
1.1. Motivation ... 19
1.2. Objectives and synthesis of the state of the art ... 20
1.3. Main contributions ... 22
1.4. Organization of this document ... 22
2.State of the Art ... 25
2.1. Introduction ... 25
2.2. Accelerometry... 25
2.3. Energy expenditure estimation ... 26
2.4. Human Activity Recognition Using Accelerometer ... 28
2.5. Related works and applications ... 31
2.6. Remarks ... 32
3.Proposal of a Metric for Physical Education Class Assessment ... 33
3.1. Introduction ... 33
3.2. Comparison between students ... 33
3.3. Accelerometry data reduction ... 34
3.4. Illustrative example ... 35
3.5. Remarks ... 37
4. Physical Education Class Assessment Tool ... 39
4.1. Introduction and features ... 39
4.2. Component diagram ... 39
4.3. Deployment diagram ... 40
4.4. Data model ... 41
4.5. Mobile Client ... 42
4.6. Backend and Frontend ... 46
4.7. Analysis tools ... 49
4.7.1. Intensity graph ... 50
4.7.2. Subject’s path graph ... 51
4.7.3. Magnitude graphs ... 53
4.7.4. Weight, REA and EE graphs ... 54
4.8. Remarks ... 55
5.Physical Education Class Dataset ... 57
5.1. Introduction ... 57
5.2. Protocol ... 58
5.3. Equipment ... 60
5.4. Population characterization ... 61
6.Illustrative Experiments and Results ... 63
6.1. Introduction ... 63
6.2. Energy expenditure estimation ... 63
6.3. Activity recognition ... 68
6.4. Remarks ... 73
7. Conclusion and Future Work ... 75
7.1. Major Conclusions ... 75
7.2. Future Work ... 76
8.Concluding Remarks ... 79
References ... 81
Appendices ... 87
Appendix A - Physical Education Class Accelerometry Dataset Description ... 87
Appendix B – Proposal for an entrepreneurship contest ... 89
List of Figures
FIGURE 1–EXAMPLE OF THE MICROMECHANICAL STRUCTURE OF A 3-AXIS MEMS ACCELEROMETER [20]. ... 25
FIGURE 2-CHART OF THE REA VALUES CALCULATED FROM THE COLLECTED SCHOOL ACCELEROMETRY DATASETS. 36 FIGURE 3–COMPONENT DIAGRAM... 40
FIGURE 4–DEPLOYMENT DIAGRAM. ... 41
FIGURE 5–DATABASE RELATIONAL MODEL LOCATED IN THE SERVER. ... 41
FIGURE 6–MOBILE CLIENT’S MAIN SCREEN WITH THE DRAWER ACTIVATED. ... 42
FIGURE 7–MOBILE CLIENT’S MAIN SCREEN DURING ACCELEROMETRY DATA COLLECTION. ... 43
FIGURE 8–CALIBRATION PROCESS OF THE MOBILE CLIENT. ... 45
FIGURE 9–NOTIFICATION DURING ACCELEROMETRY DATA COLLECTION ON THE SMARTPHONE. ... 45
FIGURE 10–FRONTEND APPLICATION WITH A USER SELECTED. ... 48
FIGURE 11–SEARCH BY DATE AVAILABLE IN THE WEB APPLICATION. ... 49
FIGURE 12–GENERATED INTENSITY GRAPH FOR DATASET 1. ... 51
FIGURE 13–CURRENT DIRECTION IDENTIFICATION ... 52
FIGURE 14–SUBJECT’S PATH GRAPH FOR DATASET 1. ... 52
FIGURE 15–MAGNITUDE CHART FOR THE VERTICAL AXIS X, WITH GRAVITY REMOVED. ... 53
FIGURE 16–MAGNITUDE CHART FOR THE LATERAL HORIZONTAL AXIS Y. ... 53
FIGURE 17–MAGNITUDE CHART FOR THE FRONTAL HORIZONTAL AXIS Z. ... 54
FIGURE 18–MAGNITUDE CHART FOR ALL AXES COMBINED. ... 54
FIGURE 19–WEIGHT AND EE HISTORY CHART. ... 54
FIGURE 20–CHART OF THE MEAN OF THE MAGNITUDE FOR EACH DAY. ... 55
FIGURE 22–SMARTPHONE POSITION DURING DATA COLLECTION. ... 59
FIGURE 23-CHART COMPARISON OF ALL EE ESTIMATIONS. ... 67
FIGURE 24–BUSINESS VALUE PROPOSITION. ... 89
FIGURE 25–PROTOTYPE IMPLEMENTATION. ... 89
FIGURE 26–TEAM BEHIND THE BUSINESS MODEL AND PROJECT. ... 90
FIGURE 27–BUSINESS MODEL OVERVIEW. ... 90
FIGURE 28–SALES CHANNELS. ... 91
FIGURE 29–COMPETITIVE ADVANTAGE. ... 91
FIGURE 30–BUSINESS OPERATIONS. ... 92
FIGURE 31–DEVELOPED WORK STRATEGY. ... 92
FIGURE 32–REVENUE RESULTS. ... 93
FIGURE 33–REVENUE RESULTS SUMMARY. ... 93
FIGURE 34–INVESTMENT METRICS. ... 93
List of Tables
TABLE 1.STANDARD MET GUIDELINES FOR SOME ACTIVITIES [50] ... 34
TABLE 2.REA VALUES CALCULATED FROM THE COLLECTED SCHOOL ACCELEROMETRY DATASETS ... 36
TABLE 3.ACCELEROMETER VALUES FOR DIFFERENT DEVICES PLACED FLAT ON A SURFACE ... 44
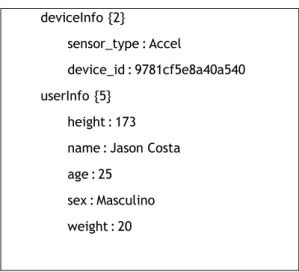
TABLE 4.JSON EXAMPLE OF THE UPLOADED USER INFORMATION IN PLAIN TEXT ... 46
TABLE 5.SERVER’S PUBLIC KEY ... 46
TABLE 6.SERVER FOLDER STRUCTURE ... 47
TABLE 7.DATASET AND DEVICE USED FOR TESTING ... 50
TABLE 8.ACTIVITY PERIODS FOR DATASET 1 ... 50
TABLE 9.REPORTED STEPS FOR THE INTENSITY ALGORITHM AGAINST REFERENCE VALUES ... 51
TABLE 10.INTENSITY DETECTION VALUES USED IN THE INTENSITY ALGORITHM ... 51
TABLE 11.ALGORITHM PARAMETERS FOR OPTIMAL DIRECTION CHANGE DETECTION ... 52
TABLE 12.ACTIVITY LIST ... 59
TABLE 13.SMARTPHONES USED FOR ACCELEROMETRY DATA COLLECTION ... 60
TABLE 14.SAMPLE CHARACTERIZATION ... 61
TABLE 15.MAIN SUBJECT USED FOR ALGORITHM DEVELOPMENT ... 65
TABLE 16.PROPOSED RAW ACCELEROMETER VALUES TO ACCELEROMETER COUNTS ADAPTATION ... 66
TABLE 17.ALGORITHM RESULTS AGAINST REFERENCE VALUES FOR DATASET 1 AND 2. ... 66
TABLE 18.EE ESTIMATION AGAINST STUDENT’S REFERENCE VALUES ... 67
TABLE 19.CLASSIFIERS USED ... 68
TABLE 20.FEATURES EXTRACTED ... 69
TABLE 21.OVERALL ACCURACY FOR 1 SECOND WINDOW SIZE ... 70
TABLE 22.F-MEASURE FOR A 1 SECOND WINDOW SIZE ... 70
TABLE 23.OVERALL ACCURACY FOR A 5 SECONDS WINDOW SIZE ... 70
TABLE 24.F-MEASURE FOR A 5 SECONDS WINDOW SIZE ... 71
TABLE 25.OVERALL ACCURACY FOR A 10 SECOND WINDOW SIZE ... 71
TABLE 26.F-MEASURE FOR A 10 SECONDS WINDOW SIZE ... 71
TABLE 27.OVERALL ACCURACY FOR WITH A 5 SECOND WINDOW SIZE AND 50% OVERLAP ... 71
TABLE 28.F-MEASURE FOR A 5 SECONDS WINDOW SIZE AND 50% OVERLAP... 71
TABLE 29.BEST CLASSIFICATION ACHIEVED FOR EACH ACTIVITY ... 72
TABLE 30.FEATURES USED IN CLASSIFICATION OF THE SCHOOL ACCELEROMETRY DATASET ... 72
Acronyms
API Application programming interface
BMI Body mass index
BRM Base metabolic rate DL W Doubly labeled water
EE Energy expenditure
EEact Energy expenditure in activity GPS Global positioning system
Kcal Kilocalorie
KNN K-nearest neighbor
MET Metabolic equivalent of task MLP Multilayer perceptron REE Resting energy expenditure
SD Secure digital
SDK Software development kit SVM Support vector machine TEE Total energy expenditure VO2 Maximal oxygen consumption
1.
Introduction
1.1. Motivation
Over the last few years, excess weight has increased at alarming rates worldwide. Recent studies show that between 1980 and 2013, the proportion of adults worldwide with excess weight has increased from 28.8% to 36.9% for men, and from 29.8% to 38.0% for women [1]. Obesity is a cause of millions of deaths worldwide, also reducing life expectancy and causing other kinds of disabilities [1].
Children are also being affected, as of 2013, 23.8% of boys and 22.6% of girls being overweight or obese [1], having a greater likelihood of cardio-metabolic risk factors and remaining obese as an adult [2], with a chance of being obese as an adult exceeding 50% after six years of age [2]. This alerts to the need of a proper close monitoring of children of young age, guiding them throughout the years, motivating healthy and active lifestyles. Recent studies also suggest that certain behaviours in children, like a low level of moderate to vigorous physical activity, short sleep duration and high level of sedentary activities like TV viewing are some of the most important correlators for child obesity [3] and major diseases prevalence [4].
New technology has been introduced in schools, with interactive whiteboards, computers and video projectors present in many classrooms. Although mobile phones in general are still prohibited by schools, smartphones brought new functionalities that may be useful in the classroom environment, such as note taking and calculations. With the development of new applications that take advantage of these devices, they might prove a useful and effective education tool.
Children are already being taught to some extent, the practice of physical activity in school through classes dedicated to it. The same methods of teaching and evaluation have been used for the last several years, making them somewhat outdated by not making use of some of the innovative technologies available today, ultimately making students lose interest in the lectures and disregard the importance of physical activity.
Smartphone usage has grown dramatically over the last few years, with over 2 Billion smartphones worldwide [5], [6]. Children nowadays are being raised surrounded by technology, with a big and increasing number owning a smartphone. These smartphones contain key features such as multiple sensors, providing external data information such as magnetic field (magnetometers), temperature, orientation (gyroscopes), atmospheric pressure (barometer), global positioning (GPS) and acceleration (accelerometers).
The student assessment in physical education classes presents several challenges mostly resulting from the heterogeneous environment with high variability on aspects such as availability of different sensors, different demographic groups, different physical backgrounds and different activities performed. This makes the results hard to compare, resulting in a
Towards an Solution to Physical Assessment of Students
student evaluation process permeated by some subjectivity, generating the need for a clear and unbiased way (at least to a greater extent) to perform the grading of the students. The quantification of Energy expenditure (EE) has gained interest over the last years, with several methods, devices and applications being developed such as the reliable measurements provided by doubly labeled water (DLW), indirect calorimeter, estimations based on accelerometry data and heart-rate values and applications that make use of these estimations like fitness trackers and other smartphone apps [7–12].
Building solutions targeting smartphones’ sensors and children is a viable idea, since this demographic group is enthusiastic about technology, specially about mobile applications.
1.2. Objectives and synthesis of the state of the art
Activity recognition is an area of extended research, with applications in health monitoring, sports, entertainment and other areas. With the advent of smartphones, several studies have been conducted regarding activity recognition using multiple sensor data collected from smartphones [13–16], whereas previous studies, e.g. the work presented in [9], relied on sensor data provided by dedicated devices like the actigraph gt3x+ and the TriTrac-R3D. By using a smartphone for sensor data collection, the cost of this type of system is greatly reduced, since we only require an application to record raw sensor data, and a means of transportation for the device.
In Akram Bayat et al.[15], a model was developed that is able to recognize multiple daily activities using machine learning, such as aerobic dancing, using a single Android smartphone with an accelerometer sensor, placed on the hand, or in the pocket. They concluded that combining classifiers and using the average of probabilities through the fusion method resulted in an overall accuracy of 91.15%.
In Armir Bujari et al. [17], other types of pattern recognition are studied such as day-by-day street behaviour, like crossing a street. This kind of behaviour detection can be used to automatically build a database of cross lights, by making use of the great number of smartphone users. By using an iPod Touch 2G with a tri-axial accelerometer. The accuracy of detecting the mentioned behaviour was of about 80%. Pedestrians need to follow strict rules such as accelerate their pace when crossing.
In Edmond Mitchell et al [13], different sports’ activities were recognized using machine learning, like hitting the ball, tackling and sprinting, from a collected dataset comprised of soccer and field-hockey activities. A total of 32 subjects participated in this study. The sports matches were also recorded in order to match accelerometer data with video data. Their maximum accuracy was 87% using a fusion of classifiers.
There are other studies combining multiple sensors in order to try to increase the accuracy of the activity classification. In A. Pande et al [10], a smartphone’s accelerometer and barometer sensor was used to estimate EE using machine learning. These trials obtained a superior EE
Towards an Solution to Physical Assessment of Students
Nike+ FuelBand. A smartphone’s barometer sensor was used to improve EE estimation accuracy,
by providing data about the environment’s atmospheric pressure and proving to significantly increase the accuracy of EE estimation, especially on altitude change activities such as climbing stairs.
In Wanmin et al [16], an accelerometer sensor was combined with a gyroscope sensor, both present in an iPod touch, in order to obtain the gyroscope sensor effectiveness in activity classification. Using machine learning and combining the orientation data with accelerometry data, they concluded that using gyroscope sensor readings proved to be beneficial.
Calorimetry equations provide a fast way of estimating EE from the subject’s physical information and accelerometer counts. Two popular equations were developed by K. Y. Chen et al [9], using a Tritrac-R3D for data collection. A linear relationship exists between accelerometer counts and EE and some physical activities, allowing the estimation of EE during physical activity (EEact).
Using a common device like a smartphone and making use of the acceleration sensor available in it, we aim to create a solution that aims to improve the current assessment system used in physical education classes, by providing information about the student’s daily physical activity, including energy expenditure, number of steps and several charts regarding physical activity. This solution will also provide support for multiple day analysis, as a way of comparing the student’s physical evolution, including body mass index (BMI) and weight.
The option for using solely accelerometry data is motivated by the current presence of accelerometers in almost every smartphone available. The usage of other sensors would also increase system storage requirement and reduce battery life on the mobile client [10].
In this work, the proposed solution requires a mobile client, in this case deployed as an Android mobile application, that collects accelerometry data and uploads it to a server through a wireless connection, where the data is processed, extracting several types of information. The server contains an analysis tool that extracts information, and generates various activity graphs. The server also hosts the frontend web application to access all the extracted information and generated graphs.
We aim to implement a data collection protocol in a school, with students collecting accelerometry data with their smartphones during physical education lectures, performing a list of pre-defined activities. The smartphone will be transported in a waist bag provided to them and the students will follow the teacher’s instructions. This data will then be processed and the synthesized information will be readily available to assist and complement the teacher’s evaluation process.
This prototype will help to estimate the effectiveness of accelerometry data in the context of a class assessment tool, computing the energy expenditure and other measures that may help to evaluate the student.
Towards an Solution to Physical Assessment of Students
The developed Android mobile client for data collection and its source code, as well as the collected accelerometry datasets will be made public, with the goal of helping to develop new application that promote active lifestyles thus improving the quality of life.
1.3. Main contributions
The main contributions in the developed work are as follows.
We propose and developed a solution to complement the assessment process in Physical educations classes, using the student’s smartphones to collect accelerometry data, and extracting activity information to complement the teacher’s assessment and grading system. We hope to motivate children to practice a more active lifestyle and improve children’s effort in class, by providing them their activity results and allowing them to compare those results between each other. With this we hope to fight obesity and other diseases by helping to create good habits in children in school age.
An accelerometry dataset library was collected, composed of a collection of activities performed in a physical education class environment and it is made available to the community. A mobile client for the Android OS was developed to collect accelerometry data, and automatically upload it to our server along with user information. This is made available in the play store [18] along with its source code [19].
A new metric using accelerometry values collected by different heterogeneous devices was proposed consisting in the accelerometry data reduction. The preliminary results are encouraging regarding the possibility to deliver a more accurate and reliable activity comparison between subjects.
A linear EE equation [9] was implemented and adapted to use raw accelerometry values, estimating EE with good accuracy for linear activities, providing a simple and easy to implement method of calorie estimation.
1.4. Organization of this document
This paper is organized as follows. In Section 2, a brief overview is made regarding related works in the area of accelerometry, activity recognition and energy expenditure. The literature studied will serve as the basis for this work, specifically in energy expenditure calculation and activity recognition. Section 3 proposes a new metric for accelerometry data reduction, allowing a more reliable comparison between student’s statistics, presenting results using this metric applied to the collected school accelerometry datasets. Section 4 describes in detail the work developed applying important knowledge extracted from the literature. Diagrams are presented to provide an overview of the work developed followed by a detailed description of the development process of the mobile client, frontend web application, the server configuration and the activity assessment tools. Section 5 discusses the methodology of the prototype implementation and the dataset collection process. We discuss how the data
Towards an Solution to Physical Assessment of Students
Section 6 includes the results of the energy expenditure estimation and activity recognition experiments, testing different datasets with multiple classifiers and data pre-processing techniques based on the studied literature. Section 7 provides a summary and main conclusion of all the developed work, as well as future functionalities and features to implement. Section 8 provides concluding remarks, discussing all the work and the biggest challenges.
2.
State of the Art
2.1. Introduction
In this chapter we discuss the current state of the art for different areas related to this work. First we will discuss accelerometry: what it is, how it works and areas of application. We will see how an accelerometer is such a simple and technologically advanced device, and how we can replace expensive tools and frustrating processes with it. This will allow us to move to the next topics, describing some of the accelerometry applications in detail, the state of the art for those application areas and how we combine them in this work.
2.2. Accelerometry
A modern accelerometer is a microelectromechanical systems (MEMS) device. In other words, it is a very small device with components between 1 to 100 micrometres that contain moving parts (Figure 1). Conceptually, the moving parts of an accelerometer are composed of a mass on a spring that reacts to acceleration. When this mass is displaced by acceleration, the spring is able to accelerate the mass at the same rate as the casing, and this displacement is measured as acceleration.
Modern MEMS accelerometers are integrated in smartphones, and are simple devices consisting of a rigid arm structure with a proof mass and a casing. This allows them to be of very small size and have a very low production price.
Figure 1 – Example of the micromechanical structure of a 3-axis MEMS accelerometer [20].
These MEMS devices enabled the integration of several sensors inside small and common devices, like smartphones, thanks to their small size and very low price. This enabled a whole new generation of applications for different areas, like medical and health [21-22], sports [23], [24], entertainment [25–28], engineering [29], biology [30–32], industry [33], building and structures [34], navigation [35] and others.
Towards an Solution to Physical Assessment of Students
With the advent of the smartphone, several accelerometry uses have been studied and applied on different areas. One of the most common uses is the is the pervasive task of detecting device positioning for screen rotation. There are other kinds of innovative applications like fall detection for elderly , image stabilization [36], orientation sensing, device integrity [37], and motion input [38].
A 3-axial accelerometer returns linear acceleration values providing simultaneous measurements in three orthogonal directions (axes X, Y and Z). These values of acceleration contain the element of gravity, which always returns 9.81 m/s2. So an accelerometer that lays
flat on a surface will report the acceleration of gravity on the vertical axis. This value can be omitted so that only the acceleration of the body is accounted for.
2.3. Energy expenditure estimation
The determination of the energy expenditure for a human body provides important information regarding its level of physical activity and helps to prevent chronic diseases such as obesity and diabetes (by controlling calorie intake).
Energy expenditure (EE) can be accurately measured using technics such as doubly labeled water (DLW) for activities of long duration, direct calorimetry which requires observations in a confined metabolic chamber, and indirect calorimeter such as the portable Cosmed K4b, suitable for short to medium periods of activity due to its size and required face mask. These devices and techniques are expensive and are currently the state of the art for EE measurement. There are some other alternative methods for EE prediction that are currently being researched. These don’t guarantee as much accuracy, but offer other benefits such as lower price and portability, either by using accelerometer reading devices such as the actigraph
gt3x+, the TriTrac-R3D [9] or more recently by using a smartphone’s built-in sensors [10]. Other
devices include heart-rate monitors or pedometers [39].
This kind of data has limitations, as it cannot detect subtle changes in EE or the thermic effect of food, making it better suited for short to medium duration specific activities.
In K. Y. Chen et al [9], two popular equations for energy expenditure estimation in activity (EEact) were proposed. A number of 125 subjects (53 men and 72 women) were studied for 2 days. On the first day, the subjects performed a normal daily routine, and in the second day a set of defined exercises to measure minute-by-minute acceleration. All activities were recorded using the TriTrac-R3D placed on the right hip and for accurate values a whole-room indirect calorimeter was used.
Two models were developed, a linear and non-linear model. The EEact calculated by the linear model was lower than the measurement by the calorimeter, specifically on light-intensity activities, contributing to an underestimation of total energy expenditure (TEE). The non-linear model improved EEact calculation on both light-intensity daily activities and on exercise day activities, improving the standard errors of estimation.
Towards an Solution to Physical Assessment of Students
In their models, the X and Y axes are combined as the horizontal value H (1),while the Z axis was isolated as the vertical value V, as it differs from the other two vectors because of the gravity applied.
𝐻 = √(𝑋2+ 𝑌2) (1)
The linear model obtained (2), estimates EEact with the input 𝑎𝐿(3) and 𝑏𝐿 (4) representing the
regression parameters. 𝐸𝐸𝑎𝑐𝑡(𝑘) = 𝑎𝐿∗ 𝐻(𝑘) + 𝑏𝐿∗ 𝑉(𝑘) (2) 𝑎𝐿= [5.78 ∗ 𝑚𝑎𝑠𝑠(𝑘𝑔) + 11.95 ∗ ℎ𝑒𝑖𝑔ℎ𝑡(𝑐𝑚) + 6.89 ∗ 𝑎𝑔𝑒(𝑦𝑟) − 2,001] 1,000 (3) 𝑏𝐿= [5.69 ∗ 𝑚𝑎𝑠𝑠(𝑘𝑔) + 349.5] 1,000 (4)
In the non-linear model (5), V and H were applied with two power parameters for the modelling of the nonlinear relationship between EEact and body acceleration. The input 𝑎𝑁 and 𝑏𝑁 (6(7),
represent the regression parameters. Both equations represent EEact for the kth minute in kJ/min. 𝐸𝐸𝑎𝑐𝑡(𝑘) = 𝑎𝑁∗ 𝐻(𝑘)𝑃 1 + 𝑏𝑁∗ 𝑉(𝑘)𝑃 2 (5) 𝑎𝑁= [12.81 ∗ 𝑚𝑎𝑠𝑠(𝑘𝑔) + 843.22] 1,000 (6) 𝑏𝑁= [38.90 ∗ 𝑚𝑎𝑠𝑠(𝑘𝑔) − 682.44 ∗ 𝑔𝑒𝑛𝑑𝑒𝑟 + 692.50] 1,000 (7)
The regression parameters were derived from the subjects, and generalized to a given body mass, height and age using linear regression analysis. These parameters contribute to the estimation of EEact, as different people with different age, height and weight will generate different resulting values. The power parameters p1 and p2, are given respectively by Equation 8 and 9. 𝑝1 = [2.66 ∗ 𝑚𝑎𝑠𝑠(𝑘𝑔) + 146.72] 1,000 (8) 𝑝2 = [−3.85 ∗ 𝑚𝑎𝑠𝑠(𝑘𝑔) + 968.28] 1,000 (9)
Towards an Solution to Physical Assessment of Students
After all accelerometry data was collected, EEact predicted by the linear and non-linear equations were added to the resting energy expenditure (REE) to derive total EE. The values were then compared to those measured by the indirect calorimeter, obtaining the difference and measuring the obtained accuracy.
In A. Pande et al [10], a smartphone’s accelerometer and barometer data was used to estimate EE in a group of 12 subjects. The data was collected using different smartphones, in a variety of exercises such as walking, climbing stairs and standing still. Their focus was to define a single robust EE algorithm that can be applied to all activities. The selection of features is very important in machine learning, as we need to identify features with high correlation to EE. The use of accelerometer raw values against feature vectors was compared, observing a clear advantage of using extracted features. A low sample rate of 2Hz (2 samples per second) was used based on Bouten et al [11], which shows that a sampling rate of 0.1-20Hz is a sufficient range. The window size is also important to identify activities, and was defined at 4 seconds (8 samples) for this study. A total of 28000 samples were obtained. Using machine learning and a combination of feature vectors (gender, age, height, weight, BMI, mean of accelerometer vectors and barometer signal) they were able to estimate EE from smartphone sensor data, with an 96% correlation with actual EE. The linear calorimetry equation value (2) was also used as a feature vector, although after some tests it was removed, having no impact on EE prediction using machine-learning approaches. The collected EE values were calibrated against a COSMED K4b2, which uses pulmonary gas exchange to measure caloric expenditure with great accuracy. These trials obtained a superior EE estimate compared to expensive consumer state-of-the-art devices like Fitbit and the Nike+ FuelBand. A smartphone’s barometer sensor was used to improve EE estimation accuracy, by providing data about the smartphone’s elevation and proving to significantly increase the accuracy of EE estimation, especially on altitude change activities such as climbing stairs. In this study, an interesting analysis of the battery consumption of the accelerometer, barometer and gyroscope sensor is made, with the gyroscope generating a very big power consumption compared to the other sensors. The sampling rate and power consumption was also compared, showing a much bigger draw using high sampling rates (100Hz) than low sampling rates (2-50Hz). These should all be taken into account before implementing such solutions, especially if performing data collections for long periods.
2.4. Human Activity Recognition Using Accelerometer
Activity recognition is one of the most studied areas of accelerometry use. Typically, by using machine learning (a combination of classifiers) and accelerometry data, we can identify with great accuracy a large set of activities. Nevertheless, this method of classification has some
Towards an Solution to Physical Assessment of Students
activities of low intensity, of changing altitude, or activities where the device is placed in a stationary position, like cycling or elliptical.
Activity recognition is useful in many areas, allowing for example a doctor to evaluate a rehabilitation patient by distance, reading and analyzing the movement’s execution with great precision. The same can be applied in sports, where a perfect technique can be evaluated, identified, and used in other player’s technique evaluation and correction. It can also be useful for EE estimation, as knowing the activity being executed can deliver a better estimate. In Akram Bayat et al.[15], a model was developed that is able to recognize multiple daily activities such as slow and fast walking, aerobic dancing and going up and down stairs, using a single Android smartphone placed on the hand or in the pocket. Their goal is to identify new activities using less sensory work than previous studies. These activities were executed in sequence, pausing a few seconds between activities in order to correctly identify them. Data was captured at 100Hz, and 180 to 280 seconds of data were captured, resulting in a total of 79,573 samples. They designed a low pass-filter in order remove gravity information from the datasets. Features were extracted using window overlapping, taking advantage of periodic behaviours with distinct patterns to calculate those features. Using a window of 128 samples (1.28 seconds of data) and 50% overlap, since this number of samples is enough to identify cycles in the executed activities, they extracted features such as mean for each window elapsed time between consecutive peaks, the difference between the minimum and maximum for each window and the correlation between different axes. In total, 24 features were extracted, but only the 18 best were used. Several classifiers were trained with the 4 subjects using a 10-fold cross validation method on the set of extracted features. For individual classifiers, Multilayer Perceptron offered the highest performance, with 89.48% accuracy for in-hand smartphone, and 89.72% for in-pocket, showing a negligible difference, although in-hand smartphone is not practical, since the subjects can’t rotate the smartphone or change its position. Combining the best single instance classifiers and using the average of probabilities through the fusion method resulted in an overall accuracy of 91.15% for in-pocket and 90.34% for in-hand. The best classifiers combined were Multilayer perceptron, SVM and Random Forest. Overall, maintaining the smartphone in a fixed position helps with classification.
Other types of activity recognition can be studied such as day-by-day street behaviour, like crossing a street. In Armir Bujari et al. [17], it is proposed the construction of a database of crossroads and traffic lights for use in google maps. This database would automatically be generated by a multitude of user’s smartphones sensors, automatically detecting when the user crosses the street and sending the GPS coordinate to a server. This study was done by using an iPod Touch 2G with a tri-axial accelerometer, the data was collected at a 30Hz rate and applied to a high-pass filter, in order to collect higher values. The only feature vector used was the magnitude of the three axes. The accuracy of detecting the mentioned behaviour was of about 80%, as the pedestrians need to follow strict rules, such as accelerating their pace when crossing, generating some false-positives.
Towards an Solution to Physical Assessment of Students
In Edmond Mitchell et al [13], using various extracted features, window lengths and multiple classifiers, different activities were recognized for two different sports. The data was collected at a rate of 16 to 22Hz. The activities identified include hitting the ball, tackling and sprinting. The smartphone was placed on the upper back, recording one hour of data for each sport. The two sports included in this study were soccer, with 15 players and field hockey with 17 players. The sports matches were also recorded in order to match accelerometer data with video data. For optimum results, the window size was adjusted between sports due to the difference in the activity duration. The classifiers used were SVM, KNN, Naive Bayes, J48 and Artificial Neural Networks. Four datasets with 210 activities were created, with two thirds used as training data, and the remaining as test data. In experiment 1, with a window size of 5 seconds and using an SVM classifier, achieving a 65.9% accuracy for hockey and 62.7% for soccer. This approach was the fastest to train and create, but obtained poor performance. In experiment 2, a full range of classifiers were tested. All performed similarly except SVM during soccer activities which performed badly (54%). Window length changes affect the output of the classifiers. If two or more activities occur in a window, then classification difficulty is increased. When selecting a time window it must be long enough to contain the entire activity being performed and short enough that it does not include any additional ones. The best classifiers in this experiment were Naive Bayes for the soccer activities and MLP for hockey. Experiment 3 used a fusion of classifiers by creating a separate model for each activity. This approach obtained a 6% better accuracy than the best single classifier, however with a significant increase in computation costs. Game activities like tackling and hitting the ball were harder to identify due to similar motions performed. Reference methods in Kwapisz et al [12] were tested, since they reported an accuracy over 90%, but only achieved an average accuracy of 73% for soccer, and 79% for hockey, demonstrating that it is difficult to develop a generalized approach for activity recognition, each dataset requiring its own window size, feature set extraction and testing with different classifiers.
In Wanmin et al [16], a gyroscope sensor present in an iPod touch was used, combined with accelerometer readings from the same device. A group of 16 subjects participated, executing a total of 13 activities, ranging from everyday activities and treadmill walking at different speeds. The device was carried in the pocket and data was collected at a sample rate of 30Hz. Different window sizes were tested (1, 2, 5 and 10 seconds), obtaining the best classification accuracy using a 2 second window size, containing about 60 samples. The feature set was composed of the mean for each axis, the standard deviation, the sum, and the fast Fourier transform magnitude. The classification process used several classifiers: J48, multilayer perceptron, naive Bayes, logistic regression, and KNN, always with default settings and 10-fold cross-validation. KNN obtained the overall best accuracy, with 90.1-94.1% for walking at different speeds, 100% for sittings and 91.7% for jogging. Stair walking proved to be a challenge for all classifiers with accuracies ranging from 52.4 to 79.4%. Removing the gyroscope sensor values resulted in a decrease in accuracy, with a decline from 3.1% to 13.4%, with KNN still
Towards an Solution to Physical Assessment of Students
producing the best results. Gyroscope is proven useful since most activities have an orientation change, complementing accelerometer values in activity recognition. These precision gains may be negligible in other studies, so gyroscope usage should be studied a priori, since it is a sensor with high power consumption [10].
2.5. Related works and applications
Accelerometers provide the means of converting an external input to digital information. In this case, acceleration over the accelerometer body is translated to a force value on the affected axis. This capacity of reading external acceleration forces is very useful, and has application in numerous areas.
In engineering, accelerometers can measure vibration of vehicles and buildings, including inclination and speed, allowing the development of new safety systems that can measure the viability of structures [34]. A laptop for example, can include an accelerometer to implement hard-drive protection on fall [37]. Earthquake detection is also possible using a network of devices equipped with vibration detection [40]. A common use of accelerometers in the automotive industry is airbag deployment, detecting rapid negative deceleration of the body to identify a collision [41].
In Biology, accelerometers allow the quantification of animal movement and energy expenditure in the wild, making use of accelerometry data and energy expenditure estimation [30].
An accelerometer can also be used to calculate the number of steps, leading to applications that stimulate the users to practice physical activity like Google Fit [42] or Pedometer & Weight Loss Coach [43]. Sleep monitor is also possible, with application such as Sleep as Android [44] detecting sleep patterns and waking the user at the best time. These features can be implemented in software, taking advantage of smartphone sensors, or through dedicated devices like fitness bands, such as the Fitbit [45], Mi-Band [46] or Jawbone [47]. These small devices have an integrated accelerometer, allowing the integration of the previously mentioned functionalities.
Measuring strike force is also possible in a variety of sports, as well as any type of collision between players and the player’s technique, demonstrating that sports is an excellent area to apply this technology [23][48].
In industry, condition monitoring is an important aspect, since it can lead to high expenses in equipment failure [33]. Accelerometers can detect equipment faults through vibration before failure, avoiding downtime and costly repairs. These systems are currently used in industries such as automotive, power generation and pharmaceutical [33].
In navigation, accelerometers can be used to help obtain the position, orientation and velocity without the need of an external reference [35]. Although in these kind of systems, a gyroscope is commonly used to assist navigation since accelerometer measures linear acceleration but only relative to the moving system, and are not aware of their own orientation.
Towards an Solution to Physical Assessment of Students
Another common area of accelerometer use is entertainment, with devices such as the Oculus Rift [26], HTC Vive [25], Samsung Gear [28] or Google cardboard [27] providing real-time head tracking for immersive experience. Oculus Rift and HTC Vive both have integrated accelerometers, while Samsung gear and Google cardboard rely on the smartphone’s sensors. Rotating a device’s screen automatically is made possible by the use of an accelerometer, by detecting the force of gravity in the correct axis.
Image stabilization can also be achieved through the use of accelerometers, canceling out unintended motion. This is commonly used in smartphones, taking advantage of the sensors available to overcome hardware size limitations of smartphone camera sensors [36].
2.6. Remarks
Accelerometers have been a powerful ally in developing new and innovative applications in many different areas. The miniaturization of this sensor allowed new kinds of interaction and movement reading as a result of the precision available these devices. Judging by the extensive research done on many areas, like medicine, industry, biology, engineering and navigation the possibilities are manyfold. This kind of research aims to improve quality of life and quality of service, by replacing old, occasionally time-consuming and expensive solutions.
The analyzed literature provided valuable insights regarding energy expenditure estimation. The equations developed in [9] provide a fast and reliable means of EEact estimation. Machine learning techniques provided a better EE estimation than calorimetry equations [10], although they require dataset building for all activities to estimate, as well as reference values collected through reliable methods like pulmonary gas exchange. These equations might underestimate or overestimate EEact for different people and different activities, but provide a good ab initio approach to work with, using only raw accelerometer data and the person’s body statistics like height, weight, age, and sex.
The literature review was also very useful for activity recognition, presenting several good methods for data pre-processing and feature extraction.
3.
Proposal of a Metric for Physical
Education Class Assessment
3.1. Introduction
Comparing the physical activity and the effort applied in class between different students is one of the objectives of the proposed solution. Due to heterogeneity in our subject group, like physical capacity, weight, height and gender, direct comparison between subjects using extracted information like the accelerometry magnitude, may not provide a reliable means of comparison. The heterogeneity of the devices used for accelerometry collection, also presented a challenge for direct student comparison, since these devices may have different sampling rates and accelerometers with different sensibility and precision. Without a means of removing the biases related to these factors, student comparison is not reliable, allowing only the evaluation of student activity evolution regarding their own collected data.
Developing a reliable means of student activity comparison, using different physical characteristics and different accelerometry values is important, and will allow the teacher to compare activity statistics between different students for a better assessment and student monitoring throughout the school year.
3.2. Comparison between students
In the assessment solution here proposed, student activity evaluation over-time can be performed by analyzing multiple extracted features such as the magnitude of each axis, the mean of the total magnitude, the number of steps and the energy expenditure estimation (EE). These measurements deliver information that can be used in student evolution assessment, but are not optimal for comparing statistics between students since they might have different physical characteristics, and their accelerometry data might have been collected by different kinds of devices.
To compare multiple subjects, it is necessary to develop a common measurement between students that is independent of the used device for accelerometry data collection and student’s physical characteristics. This measurement must previously perform a calibration between all students, in order to eliminate the differences between different devices.
A common mean of activity intensity measurement, that can be used to compare multiple subjects of different weight is the metabolic equivalent of task (MET). This measurement expresses the intensity of physical activity, with one MET being represented as the energy expenditure at rest (REE) or the quantity of oxygen consumed by the body (VO2) at rest [49]. The energy cost of a physical activity is calculated as the MET value multiplied by the REE value. This resting energy expenditure value can be obtained through accurate measurement tools
Towards an Solution to Physical Assessment of Students
like doubly labeled water (DLW), indirect calorimeter, or estimated by using the subject’s information like height, age, sex or weight. A value of 2 MET’s means the subject is expending 2 times his resting energy expenditure, a value of 3 MET’s requires three times the resting energy expenditure, and so on. MET can be thought of as an index of the intensity of activities (see Table 1), in a way comparable among people of different weight [49].
The MET value is commonly used as a measurement of activity intensity, since using energy expenditure alone doesn’t allow comparison between subjects of different weight being their relative energy expenditure different for the same activities. To estimate the base MET value for a subject, his REE must be estimated by a reliable method, or by doing an estimation using the subject’s body weight (see (15) in section 6.2).
Table 1. Standard MET guidelines for some activities [50]
3.3. Accelerometry data reduction
Student activity comparison is not reliable using directly extracted features such as the magnitude or number of steps, since the devices used for accelerometry capture are different, and subjects have different physical characteristics (see Table 14).
Departing from the previously analyzed MET measure, which aims to the direct activity comparison between subjects of different weight, we propose the following method of data reduction, arguably allowing student comparison in a more reliable way.
In MET estimation, a base REE or VO2 value for 1 MET is needed to estimate other activities. In this proposed metric, the mean of the magnitude for a short period and high intensity activity is extracted independently for each student, defining our base measurement. The activity used for this measurement is running, since it provides consistent accelerometry values. In the following we will refer to this metric as the running equivalent of activity (REA). This base measurement will allow to uniquely sample each student’s physical capacity in relation to the reported accelerometry magnitude values, allowing to perform a calibration and estimate other
Activity MET value
Resting 1
Personal Care, Household activities 2
Cooking, shopping, housework, casual games 3
Playing soccer 7
Towards an Solution to Physical Assessment of Students
Students collect accelerometry data while running for a short period of time at high intensity. After this data is collected, the average magnitude for that activity period is calculated, providing the base magnitude value for a normalized REA value of 1. Gravity is also removed using a low pass filter [51], in order to extract only the acceleration of the subject, otherwise a vertical acceleration force would be incorrectly reported when students are standing still. It is important that students perform the running activity at their maximum intensity without interruptions since all the subsequent activity estimations will depend on this ground truth data.
The computed REA value (10) will provide a base means of comparison to other types of activity, being defined as the ratio of the calculated average activity acceleration vector standard by the previously calculated average magnitude for the high intensity running.
𝑅𝐸𝐴𝑨𝒄𝒕=
𝑎𝑣𝑔𝑀𝑎𝑔𝑛(𝐴𝑐𝑡𝑖𝑣𝑖𝑡𝑦) 𝑎𝑣𝑔𝑀𝑎𝑔𝑛(𝑅𝑢𝑛𝐻𝑖𝑔ℎ)
(10)
This will allow student comparison, by reducing the accelerometry data to a single, easy to extract and reliable measurement, independent of physical characteristics and at least to a great extent immune to differences in the devices used for accelerometry capture.
3.4. Illustrative example
The proposed metric was implemented in an algorithm, reading accelerometry datasets, extracting the base REA and estimating the REA value for the activities present in the dataset. The collected school accelerometry datasets was used to assess the REA adequacy to student relative comparison.
Students performed at the beginning of the class the required running activity at high intensity, for a total duration of 8 minutes in order to obtain the magnitude for that activity and estimate a base REA. The teacher controlled student intensity assuring every student was performing the activity correctly. All students started and stopped the data collection simultaneously, and during the school accelerometry data gathering, the start and end times for all activities were annotated in order to correctly separate and extract activities from the dataset.
The REA base value was calculated by identifying the running activity by the timestamps saved in the dataset and calculating the mean of the magnitude for all axes in the defined time period. The rest of the activities were also identified by the saved timestamp and annotated time, and their REA was calculated by dividing the mean of their magnitudes by the previously calculated base value.
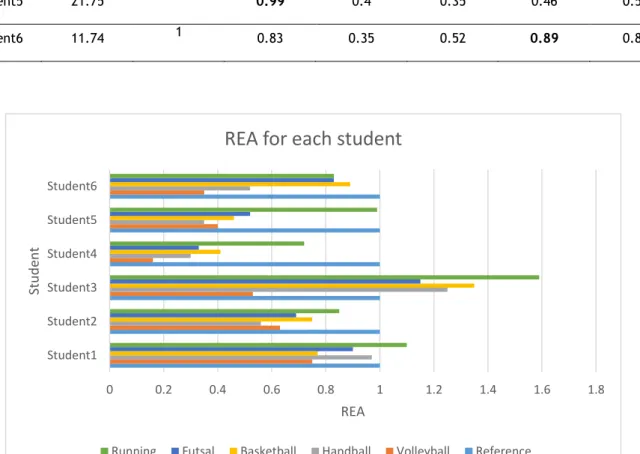
Different REA values were obtained for the different activities present in these datasets. For illustrative purposes Table 2 depicts the reported values from a small subset of subjects.
Towards an Solution to Physical Assessment of Students
The calculated REA’s base values and activity REA’s were compared to the corresponding student performance observed in class. The results demonstrate a strong correlation with the observed student behavior in class, with the majority of REA values estimating running, futsal and basketball as the higher intensity activities and volleyball and handball as the less intense activity related to the estimated base value.
Table 2. REA values calculated from the collected school accelerometry datasets
Subject id Average running magnitude REA (running high intensity) REA (normal running) REA (volleyball) REA (handball) REA
(basketball) REA (futsal)
Student1 1.86 1 1.1 0.75 0.97 0.77 0.9 Student2 3.13 1 0.85 0.63 0.56 0.75 0.69 Student3 19.49 1 1.59 0.53 1.25 1.35 1.15 Student4 24.27 1 0.72 0.16 0.3 0.41 0.33 Student5 21.75 1 0.99 0.4 0.35 0.46 0.52 Student6 11.74 1 0.83 0.35 0.52 0.89 0.83
Figure 2 - Chart of the REA values calculated from the collected school accelerometry datasets.
In Table 2 and Figure 2, the calculated REA’s for each activity can be compared to the REA value of 1, associating each obtained REA with the maximum intensity provided by the
0 0.2 0.4 0.6 0.8 1 1.2 1.4 1.6 1.8 Student1 Student2 Student3 Student4 Student5 Student6 REA Stu d en t
REA for each student
Towards an Solution to Physical Assessment of Students
As it can be observed, student 1 and student 3 performed activities of higher REA than the reference value, which means these students overcame their maximum calibrated intensity. At the time of the implementation of this metric, two data collections had already been completed, which required the students to perform the calibration activity at the end of the class in order to maintain the timings of the previously performed activities. This factor might have affected some student’s performance, decreasing their performance, and as a result some student perform better and obtain a higher calculated REA at the rest of activities.
3.5. Remarks
The calculation of REA for each student allows the estimation of an activity related measurement, eliminating the problem of the heterogeneity of devices, and allowing a reliable and detailed student comparison by the teacher. This value, if calculated for each activity, will allow the teacher to evaluate the student performance on each sport, identifying weaknesses and strong points related to the different activities analyzed.
This proposed metric gets some of its inspiration on the metabolic equivalent of task (MET), since it can also provide a measurement that can be used to compare different subjects regarding energy costs in physical activity. The proposed metric replaces the REE of a subject to estimate 1 REA, by the mean of the magnitude of a short duration and high intensity running activity to estimate 1 REA. Posterior activity intensity estimations will ensure that results obtained are related to the student’s maximum physical capacity.
To estimate the base REA value, it is required to calculate the mean of the magnitude for a running activity. This activity should be of short duration to ensure a high intensity rate, in order to obtain a precise representation of the student’s maximum physical capacity. It is important to ensure the correct execution of this activity by all students. An incorrectly performed running activity for calibration, such as a student running significantly below his maximum capacity, will not accurately represent his activity level and other activity measurements will report a high magnitude and subsequently a good performance by the student with low effort.
This calibration process can be performed at the beginning of the school year, reusing this base value as gold standard of maximum physical capacity throughout the year.
This obtained standard can also be used in activities outside of school, allowing students to compare various performed activities of their choice with their maximum running intensity, or be used as a goal to surpass.
4.
Physical Education Class
Assessment Tool
4.1. Introduction and features
Physical education classes have been integrated in the Portuguese school systems since the beginning of the 20th century [52]. The same methods of assessment have been used over the last several years, with the teacher evaluating the performance and effort of each student based solely on his observations. This assessment process is hard, as teachers lack tools and information for decision support, which can lead to an unfair grade and student demotivation. Technology advancements allowed the creation of MEMS devices. These devices allow the miniaturization of sensors like accelerometers, allowing the integration in smartphones and other small devices. These lightweight and cheap sensors allow new applications that make use of accelerometry data, to provide feedback on a variety of activities in different areas, like sports, medicine and engineering.
With these applications in mind, we developed a complete assessment tool, making use of student collected accelerometry data during physical education classes, in order to analyze and quantify student effort by extracting several types of information from these datasets.
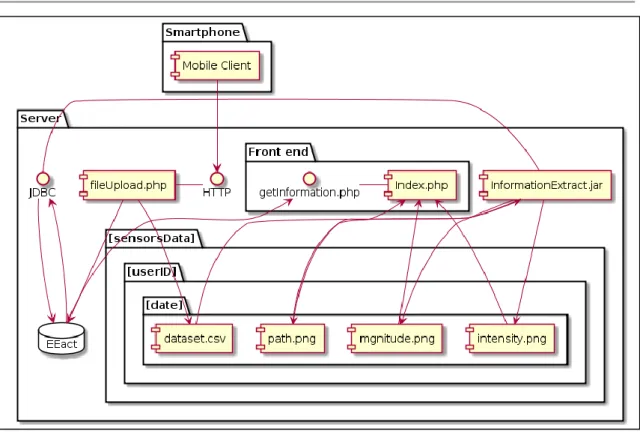
4.2. Component diagram
This assessment tool is complemented with an analysis module, displaying in the form of charts the student’s energy expenditure estimations, the number of steps, student’s path, accelerometry axes magnitudes and REA. These charts provide an history of measurements in order to provide an easy way to visualize student activity evolution.
Towards an Solution to Physical Assessment of Students
Figure 3 – Component diagram.
This solution will make use of the smartphone application for accelerometry data collection and data upload. The data upload is performed by communicating through REST web services (implementing a client-server architecture), with a PHP script that organizes the received datasets and inserts the user information in the database. The server contains an analysis tool developed in Java that extracts information from the collected datasets, generates various graphs and makes use of the Java Database Connectivity (JDBC) API to insert the extracted information in the database, making all this information available to the frontend web application to display.
4.3. Deployment diagram
We hope this assessment tool may improve not only the evaluation process, but also the children’s motivation towards a greater effort in class and an overall more active lifestyle. This solution will make use of each student’s smartphone, providing a case for transport and a smartphone application available for free in Google’s play store. Students will use the smartphone application for data collection, requiring only a first interaction in order to complete their user information and to perform the calibration process. Future uses only require them to start and stop the accelerometry collection process. After this process is complete, the application automatically uploads all the available information when a wireless connection is stablished, removing all datasets after they are successfully uploaded and keeping the used space by the application at a minimum.
Towards an Solution to Physical Assessment of Students
Figure 4 – Deployment diagram.
4.4. Data model
A relation MySQL database is used to store the uploaded student’s information, as well as some of the extracted activity information from the datasets. This is used to keep a history of various features and is used by the frontend web application as well as some of the developed algorithms, like EE.
Towards an Solution to Physical Assessment of Students
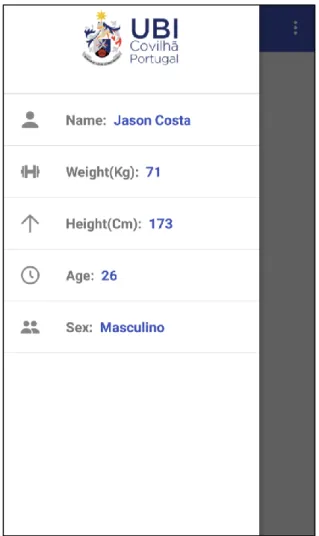
4.5. Mobile Client
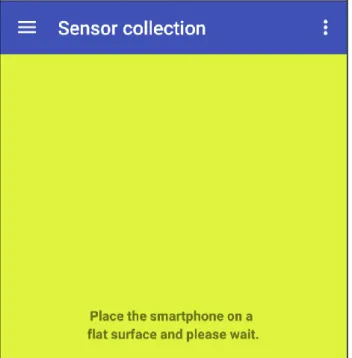
To run the application, it is required to complete the subject’s information, which is located in the app drawer and is automatically activated on start when the user info is incomplete (see Figure 6). A calibration is required before starting the data collection, since most accelerometer sensors report slightly wrong values (see Table 3). The device’s free space is also verified, requiring 75MB, which is an upper estimation for about 90 minutes of sensor data collection.
Figure 6 – Mobile client’s main screen with the drawer activated.
After these processes have been completed, the user can press start to begin capturing accelerometry values to a CSV file. After stopping, the collected sensor values are immediately uploaded to our server if a wireless connection is available, or kept offline until a wireless connection is stablished which automatically uploads all collected accelerometry.
The mobile client was built for the Android operating system using Android Studio 2.0 and compiled against SDK version 23 (Android 6). It runs on any Android version superior to 2.2 and
Towards an Solution to Physical Assessment of Students
was developed with simplicity and usability in mind, to avoid compatibility problems with certain devices and usage problems by the students.
The main smartphone used for testing was a Jiayu S3, running Android 5.1 with a triaxial accelerometer sensor.
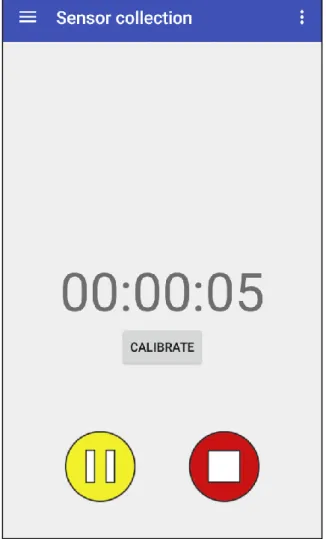
The mobile client is used for accelerometry data collection, and to send the collected information to a server. It is composed of a very simple interface, containing a start button, a stop button and a timer (see Figure 7).
Figure 7 – Mobile client’s main screen during accelerometry data collection.
Accelerometer sensor data recording was implemented as an Android service. An Android service can run in the background indefinitely, even if the user starts another application. This allows the developed mobile client to collect data indefinitely until the user presses stop. This service is also efficiently managed, keeping an internal service state and recycling its resources when the activity is stopped and the data collection is not running.
Towards an Solution to Physical Assessment of Students
Sensors become inaccessible after the CPU enters the sleep state [53], being necessary to keep the device’s CPU awake for the data collection by keeping a wake-lock until the user presses stop.
The accelerometer sensor availability is checked prior to data capture. If the device has an accelerometer, the device will register the sensor with priority SENSOR_DELAY_FASTEST. The priority defines the number of samples to retrieve from the sensor, which in this case will retrieve as many as possible. In the main device used for testing, a sample rate of 90Hz to 150Hz was observed, resulting in 90 to 150 accelerometry samples per second. This sample rate was chosen since a high sample rate is needed for testing and for algorithm development. Artifacts were removed from the sensors’ values, since large value spikes were observed in some devices. These were eliminated by removing all values bigger than the provided sensor maximum range, which is a method available in the Android API. Sensor values are also low-pass filtered in order to smooth the data. Different devices were tested for their accelerometry values, since different smartphone devices have different sensors, and even the same sensor can be factory calibrated differently. The calibration process is necessary since in our tests, most devices reported different values when placed with the screen up in a flat surface. A calibrated accelerometer placed flat on a surface should only report the value of gravity of 9.81m/s2 on the vertical axis and no acceleration on the other axes [51].
The different values of the tested devices are reported on Table 3.
Table 3. Accelerometer values for different devices placed flat on a surface
Device Accelerometer values
Jiayu S3 𝐱: − 𝟎. 𝟏𝐦/𝐬𝟐, 𝐲: − 𝟎. 𝟏𝐦/𝐬𝟐, 𝐳: 𝟗. 𝟖𝟏𝐦/𝐬𝟐
Samsung galaxy S3 𝐱: 𝟎. 𝟏𝐦/𝐬𝟐, 𝐲: − 𝟎. 𝟕𝐦/𝐬𝟐, 𝐳: 𝟗. 𝟑𝐦/𝐬𝟐
Wiko Fab 4G 𝐱: − 𝟎. 𝟐𝐦/𝐬𝟐, 𝐲: − 𝟎. 𝟐𝐦/𝐬𝟐, 𝐳: 𝟗. 𝟕𝐦/𝐬𝟐
Samsung galaxy fresh 𝐱: − 𝟎. 𝟐𝐦/𝐬𝟐, 𝐲: −𝟎. 𝟑𝐦/𝐬𝟐, 𝐳: 𝟖. 𝟐𝐦/𝐬𝟐
Tablet Rockchip 𝐱: 𝟎. 𝟏𝟓𝐦/𝐬𝟐, 𝐲: 𝟎. 𝟏𝟓𝐦/𝐬𝟐, 𝐳: 𝟒. 𝟗𝐦/𝐬𝟐
The calibration process asks the user to place the device in a flat surface, automatically detecting this position in order to assure a correct calibration. To detect this position even on smartphones that report slightly incorrect values, a threshold was defined for the vertical and horizontal axis, defining a range of accelerometry values in which this position can be detected. This calibration is performed by calculating the difference between the reported values for all the three axes and the expected gravity value on the vertical axis. The calculated offset is saved in the Android settings manager and is used for all future accelerometry data collections. A similar calibration process is implemented in R. Guidoux et al. [7]
The calibration process takes 5 seconds, with a visual feedback of colour change, from orange to green, indicating the calibration progress (Figure 8).
![Figure 1 – Example of the micromechanical structure of a 3-axis MEMS accelerometer [20]](https://thumb-eu.123doks.com/thumbv2/123dok_br/19174549.942612/25.892.304.635.734.957/figure-example-micromechanical-structure-axis-mems-accelerometer.webp)
![Table 1. Standard MET guidelines for some activities [50]](https://thumb-eu.123doks.com/thumbv2/123dok_br/19174549.942612/34.892.204.638.434.715/table-standard-met-guidelines-for-some-activities.webp)