Page 1 of 37
Characterization of the peripheral thyroid system of gilthead seabream
1
acclimated to different ambient salinities
2 3
I. Ruiz-Jaraboac*, P.H.M. Klarenb, B. Louroc, J.A. Martos-Sitchaad+, P.I.S. Pintoc, L. 4
Vargas-Chacoffe, G. Flikb, G. Martinez-Rodriguezd, D.M. Powerc, J.M. Manceraa, F.J. 5
Arjonaa,b,# 6
7 a
Departamento de Biología, Facultad de Ciencias del Mar y Ambientales, Universidad 8
de Cádiz, Av. República Saharaui s/n, E11519 Puerto Real, Cádiz, Spain 9
b
Department of Animal Ecology & Physiology, Institute for Water and Wetland 10
Research, Faculty of Science, Radboud University, Heyendaalseweg 135, Box 30, 11
6525 AJ Nijmegen, The Netherlands 12
c
Comparative Endocrinology and Integrative Biology Group, Centre of Marine 13
Sciences (CCMAR), Universidade do Algarve, Campus de Gambelas, 8005-139 Faro, 14
Portugal 15
d
Instituto de Ciencias Marinas de Andalucía (ICMAN-CSIC), Spanish National 16
Research Council, Av. República Saharaui, 2, E11519 Puerto Real, Cádiz, Spain 17
e
34
Instituto de Ciencias Marinas y Limnológicas, Facultad de Ciencias, Universidad 18
Austral de Chile, casilla 567, Valdivia, Chile 19
20
Current address: 21
+ Nutrigenomics and Fish Growth Endocrinology Group, Institute of Aquaculture 22
Torre de la Sal, Consejo Superior de Investigaciones Científicas (IATS-CSIC), Ribera 23
de Cabanes, E-12595 Castellón, Spain 24
# Department of Physiology, Radboud Institute for Molecular Life Sciences, Radboud 25
university medical center, Nijmegen, The Netherlands 26
27
Running title: Salinity and the thyroid system in a euryhaline fish.
28 29
Ms. has 38 pages, 5 figures, 1 table, 7 suppl. files
30 31 32 33
Page 2 of 37 *Corresponding author:
35
Ignacio Ruiz-Jarabo, PhD 36
Departamento de Biología, Facultad de Ciencias del Mar y Ambientales, Universidad 37
de Cádiz, Av. República Saharaui s/n, E11519 Puerto Real, Cádiz, Spain 38
Page 3 of 37
Abstract
41
Thyroid hormones are involved in many developmental and physiological processes, 42
including osmoregulation. The regulation of the thyroid system by environmental 43
salinity in the euryhaline gilthead seabream (Sparus aurata) is still poorly 44
characterized. To this end seabreams were exposed to four different environmental 45
salinities (5, 15, 40 and 55 ppt) for 14 days, and plasma free thyroid hormones (fT3, 46
fT4), outer ring deiodination and Na+/K+-ATPase activities in gills and kidney, as 47
well as other osmoregulatory and metabolic parameters were measured. Low salinity 48
conditions (5 ppt) elicited a significant increase in fT3 (29 %) and fT4 (184 %) 49
plasma concentrations compared to control animals (acclimated to 40 ppt, natural 50
salinity conditions in the Bay of Cádiz, Spain), while the amount of pituitary thyroid 51
stimulating hormone subunit β (tshb) transcript abundance remained unchanged. In 52
addition, plasma fT4 levels were positively correlated to renal and branchial 53
deiodinase type 2 (dio2) mRNA expression. Gill and kidney T4-outer ring
54
deiodination activities correlated positively with dio2 mRNA expression and the 55
highest values were observed in fish acclimated to low salinities (5 and 15 ppt). The 56
high salinity (55 ppt) exposure caused a significant increase in tshb expression (65 57
%), but deiodinase gene expression (dio1 and dio2) and activity did not change and 58
were similar to controls (40 ppt). In conclusion, acclimation to different salinities led 59
to changes in the peripheral regulation of thyroid hormone metabolism in seabream. 60
Therefore, thyroid hormones are involved in the regulation of ion transport and 61
osmoregulatory physiology in this species. The conclusions derived from this study 62
may also allow aquaculturists to modulate thyroid metabolism in seabream by 63
adjusting culture salinity. 64
65
Keywords: deiodinases, osmoregulation, outer ring deiodination, Sparus aurata,
66
thyroid hormones. 67
68 69
Page 4 of 37
1. Introduction
70 71
Thyroid hormones (THs) are truly pleiotropic in fish, affecting metabolism, 72
reproduction, growth and osmoregulation, relevant physiological processes for 73
aquaculture (Blanton and Specker, 2007). Thus, understanding how this system is 74
regulated by the environment in cultured species, is key for the optimization of their 75
culture. In the aquaculture ponds of the South of Spain, where culture of gilthead 76
seabream (Sparus aurata) is carried out, salinity is highly variable and may well 77
influence the thyroid system. In general, the fish thyroid system responds to stimuli 78
by regulating the release of thyroid stimulating hormone (Tsh) that in turn stimulates 79
the thyroid follicle to secrete thyroxine (T4) into the blood stream (Eales and Brown, 80
1993). Within the plethora of stimuli regulating the release of Tsh in fish, different 81
salinity concentrations are postulated (Leatherland and Farbridge, 1992). Pituitary 82
thyroid stimulating hormone subunit β (tshb) gene expression is under negative
83
feedback control by plasma (free) thyroid hormones (Cohn et al., 2010; Manchado et 84
al., 2008). 85
The pro-hormone T4 is deiodinated into bioactive triiodothyronine (T3) in the 86
peripheral tissues (Bernier et al., 2009; Klaren et al., 2008). The regulation of 87
deiodination in peripheral tissues is therefore a determining factor for the 88
physiological effects of thyroid hormones. 89
Two iodothyronine deiodinases (Dio1 and Dio2) have outer ring deiodination (ORD) 90
activities and in peripheral organs such as the gills and the kidney produce T3 from 91
T4 that are directly involved in ion transport and osmoregulation (Arjona et al., 2008). 92
The inactivation pathways of THs are catalysed also by Dio1 and by a third 93
iodothyronine deiodinase, Dio3. Both Dio1 and Dio2 ORD activities have distinct 94
substrate and co-substrate preferences (Klaren et al., 2012; Orozco et al., 2000). 95
Reverse T3 (rT3) is usually the preferred substrate for Dio1 in mammals (Orozco et 96
al., 1997) while T4 is the preferred substrate of Dio2 (Garcia-G et al., 2004). 97
One consequence of increased TH activity is the stimulation of the basal metabolic 98
rate, which seems to result, at least in part, in increased oxygen consumption and ATP 99
hydrolysis. Several studies have reported species-specific changes in plasma TH 100
levels, ORD activity (Arjona et al., 2008) or deiodinase gene expression (Lorgen et 101
al., 2015) when fish are submitted to an osmotic challenge. Osmotic acclimation in 102
fish is also associated with variations in plasma THs and in gilthead seabream plasma 103
Page 5 of 37
free T4 and gill ORD activity respond to a change in environmental salinity from 35 104
ppt to 1 ppt (Klaren et al., 2007). 105
Other authors have studied the thyroid system in S. aurata in hypo-saline conditions 106
(Klaren et al., 2007; Power et al., 2001). To our knowledge, there are no previous 107
studies characterizing the effects of acclimation to iso- or hypersaline conditions on 108
the thyroid system in this species. We therefore set out to compare the effects of 109
environmental hypo- and hyper-salinity on the thyroid system of the euryhaline 110
gilthead seabream, an important aquaculture species. 111
112
2. Materials and methods
113 114
2.1 Animal maintenance prior to experimentation
115
Immature juvenile gilthead seabream juveniles (N=32; 200 ± 44 g body mass, mean ± 116
SD) were provided by Servicios Centrales de Investigación en Cultivos Marinos 117
(SCI-CM, CASEM, University of Cádiz, Spain; Operational Code REGA 118
ES11028000312), and maintained in the fish husbandry facility of the Faculty of 119
Marine and Environmental Sciences (Puerto Real, Cadiz, Spain). Fish were 120
acclimated for 35 days in 400-L tanks to seawater (40 ppt, natural salinity condition in 121
the Bay of Cadiz, Spain) in a flow-through system under natural photoperiod (month 122
of May in Cadiz, 14 h light:10 h dark) and temperature (environmental temperature of 123
approximately 19.5ºC). Fish were fed commercial pellets (1% body mass) once a day 124
(9:00) (Dibaq-Diproteg, Segovia, Spain). The experimental procedures complied with 125
the guidelines of the University of Cadiz (Spain) and the European Union 126
(86/609/EU) for the use of animals in research. 127
128
2.2 Acclimation to different environmental salinities
129
Fish were lightly anaesthetized in 0.05 % (v/v) 2-phenoxyethanol, netted and 130
randomly allocated to 400-L cubic tanks with different salinities (5, 15, 40 and 55 ppt 131
with 140, 364, 1090 and 1546 mOsm kg-1 osmolality, respectively) (N=8 per group). 132
During transfer to the experimental tanks, the mass and length of the animals were 133
recorded. Experimental salinities were achieved by mixing full-strength seawater with 134
dechlorinated tap water (Puerto Real, Spain) or by mixing seawater with natural 135
marine salt (Salina La Tapa, Puerto de Santa María, Cádiz, Spain). Each tank had a 136
water recirculation system, which consisted of an external filter (Hydor Prime 30, 137
Page 6 of 37
Sacramento, CA, USA) to ensure optimal water conditions. Water conditions during 138
experimentation were: temperature, ranging between 19.1 and 19.8 ºC; 5, 15, 40 and 139
55 ppt salinity (variations <1 ppt for each tank); pH, ranging between 7.82 and 7.88; 140
dissolved oxygen, >5 mg O2 L-1; nitrites, between 0.05 and 1.69 mg L-1; nitrates, 141
between 4.13 and 36.41 mg L-1; and ammonium, 0.0-0.2 mg L-1. These parameters 142
were checked daily and did not vary significantly for the duration of the experiment. 143
20 % of the water in circuits was replaced every other day. Fish were maintained in 144
these conditions for 14 days and were fasted for 24 h before sampling. No mortality 145
was observed during the acclimation period. 146
147
2.3 Sampling
148
Fish were netted, anaesthetized in 0.1 % (v/v) 2-phenoxyethanol, weighed and 149
sampled. Blood was collected with ammonium-heparinized syringes from the caudal 150
vessels and placed into heparinized tubes. Plasma was separated from cells by 151
centrifugation of whole blood (3 min, 10,000 x g, 4ºC). Fish were then euthanized by 152
spinal transection and the pituitary gland was collected from each fish. The first gill 153
arch on the left side of fish was excised. Adherent blood was removed by blotting 154
with absorbent paper and a smaller subsample consisting of a few branchial filaments 155
was collected using fine-point scissors. A small portion of the caudal part of the 156
kidney was also collected. Gill filaments and kidney were placed in 100 μL of ice-157
cold sucrose-EDTA-imidazole (SEI) buffer (150 mM sucrose, 10 mM EDTA, 50 mM 158
imidazole, pH 7.3) for the analysis of Na+/K+
Water samples were filtered (0.22 µm pore size) prior to analysis. Na
-ATPase activity. The remaining gill 159
tissue and kidney were snap frozen in liquid nitrogen and stored at -80ºC until 160
measurement of outer ring deiodination activities or mRNA extraction. Liver was also 161
collected and weighed to determine the hepatosomatic index (HSI). 162 163 2.4 Water chemistry 164 + , K+ and Mg2+ 165
levels were measured using a flame atomic absorption spectrophotometer (UNICAM 166
939, Servicios Centrales, University of Cadiz). Cl− and Ca2+ levels were measured 167
with commercially available kits following the manufacturers protocol (Spinreact 168
S.A, Sant Esteve d´en Bas, Girona, Spain). Osmolality was measured using a vapour 169
pressure osmometer (Fiske One-Ten osmometer, Fiske, Massachusetts, USA) and 170
Page 7 of 37
expressed as mOsm kg−1 H2O. Water chemistry data are shown in Supplementary File 171 1. 172 173 2.5 Cloning of tshb 174
The sequence of the beta subunit of tsh was originated using a cDNA cloned from a 175
seabream pituitary cDNA library (Louro et al., 2005). Plasmid DNA was extracted 176
using the alkaline lysis procedure (Birnboim and Doly, 1979) and sequenced using the 177
Sanger sequencing method. Sequence identity was determined using the tblastx and 178
blastn algorithms (Altschul et al., 1994) against the non-redundant nucleotide (nr db) 179
and GenBank EST databases. Homologues were defined as those with an E-value 180
<1e-5
Total RNA was extracted from the pituitary, gills and kidney using Mini or Midi 203
RNeasy kits (Qiagen, Hilden, Germany) following the manufacturer’s protocol. The 204
and a score of >40. Several cDNA clones corresponding to tshb were identified; 181
one cDNA clone (281 EP10C7 Sa) was selected as reference and fully sequenced in 182
order to obtain 3-fold coverage. 183
184
2.6 Phylogenetic analyses
185
Clustal Omega (SeaView v4 software, Gouy et al., 2010) with default parameters was 186
used to generate a multiple sequence alignment of tshb sequences from 187
representatives of the main vertebrate taxa. 188
Model Generator v0.85 (Keane et al., 2006) was used to test which substitution model 189
best fitted the amino acid (aa) sequence alignment data. The Maximum Likelihood 190
(ML) method, based on the selected optimal matrix-based model (JTT) (Jones et al., 191
1992), was used for the evolutionary analyses conducted in MEGA6 (Tamura et al., 192
2013). The bootstrap consensus tree was inferred from 1,000 replicates (Felsenstein, 193
1985), and only branches corresponding to partitions reproduced in more than 50 % 194
bootstrap replicates were presented. Initial tree(s) for the heuristic search were 195
obtained automatically by applying Neighbor-Join and BioNJ algorithms to a matrix 196
of pairwise distances estimated using a JTT model, and then selecting the topology 197
with a superior log likelihood value. A discrete gamma distribution was used to model 198
evolutionary rate differences among sites [5 categories (+G, parameter = 1.7029)]. All 199
positions containing gaps and missing data were eliminated. 200
201
2.7 Real-time quantitative PCR (qPCR)
Page 8 of 37
concentration of RNA was determined at 260 nm using BioPhotometer Plus 205
Spectrophotometer (Eppendorf, Hamburg, Germany) and its quality was determined 206
in a 2100 Bioanalyzer using the RNA 6000 Nano Kit (Agilent Technologies, Santa 207
Clara, CA, USA). Only samples with an RNA Integrity Number (RIN) higher than 9.0 208
were used for qPCR. Synthesis of cDNA was carried out in a final reaction volume of 209
20 μL using qSCRIPT™ cDNA synthesis kit (Quanta BioSciences, Gaithersburg, 210
MD, USA). Primers used for the analysis were designed using Primer3 software (v. 211
0.4.0.) (http://frodo.wi.mit.edu/primer3) and seabream cDNA sequences available in 212
GenBank: deiodinase type 1 (dio1, DQ888894); deiodinase type 2 (dio2, DQ888895); 213
tshb (KM014688); and β-actin (actb, X89920). qPCR assay linearity and
214
amplification efficiencies (Supplementary File 2) were checked using dilution curves 215
(six serial 1/4 dilutions, in triplicate, starting from 10 ng of cDNA, calculated from 216
total input of RNA per reaction). All optimized qPCR assay were linear through 6 217
serial dilutions (dio1: r2 = 0.982, efficiency (E) = 0.90; dio2: r2 = 0.982, E = 0.90; 218
tshβ: r2
= 0.998, E = 0.90; β-actin: r2 = 0.999, E = 1.01). To confirm the correct 219
amplification of these primer pairs, the obtained PCR amplicons were cloned and 220
sequenced (CloneJET PCR Cloning Kit, ThermoFisher Scientific, Waltham, MA, 221
USA). qPCR was carried out with a Fluorescent Quantitative Detection System 222
(Mastercycler ep realplex2 S, Eppendorf, Hamburg, Germany). Each reaction was
223
carried out in triplicate and contained 10 ng cDNA/total input of RNA, 0.5 μL of each 224
specific forward and reverse primer, and 5 μL of PerfeCTa SYBR®
Green FastMix™ 225
(Quanta BioSciences) in a final reaction volume of 10 μL. The thermal cycle utilized 226
was 10 min at 95ºC; 40 cycles of 20 s at 95ºC followed by 30 s at 60ºC; melting curve 227
(60ºC to 95ºC, 20 min); 95ºC, 15 s. A final melt curve showed single 228
product/dissociation curves in all reactions. The results for each gene were normalized 229
to actb, which was stable between all samples analysed (< 0.35 CT variation). 230
Relative gene quantification was performed using the ∆∆CT
Tracers used for measurements of deiodinase activity were prepared using the 235
chloramine-T method to produce [
method (Livak and 231
Schmittgen, 2001). 232
233
2.8 Outer ring deiodination (ORD) activities
234
125
I-]rT3, [125I-]T3 and [125I-]T4 from the 3,3´-T2, 236
3,5-T2 and 3,5,3´-T3, respectively (Visser et al., 1977). All those molecules have 237
been reported as substrates for ORD activity in teleost fish (Klaren et al., 2012). 238
Page 9 of 37
Iodothyronines were purchased from Sigma Chemical Co. (St. Louis, MO, USA), 239
Na125I was obtained from NEN Life Science Products Inc., Boston, MA, USA. 240
Radiolabelled iodothyronines from the radioiodination reaction were purified using 10 241
% (w/v) Sephadex LH-20 minicolumns as described previously (Mol and Visser, 242
1985) followed by high pressure liquid chromatography (HPLC, platinum column 243
EPS C18, 150 mm length, internal diameter 4.6 mm, Alltech Associated Inc., Illinois, 244
USA) with a reverse phase isocratic elution of 35/65 % acetonitrile 0.05 M K2HPO4, 245
pH 3.2. Sephadex LH-20 was obtained from Amersham Pharmacia Biotech (Uppsala, 246
Sweden). All other chemicals were analytical grade and obtained from commercial 247
suppliers. 248
Gills and kidneys were homogenized in 1 mL and 3 mL of phosphate buffer (100 mM 249
Na-phosphate, 2 mM EDTA, pH 7.2), respectively. To determine ORD activities, 250
homogenates were incubated with [125I-]rT3, [125I-]T3 or [125I-]T4 without DTT as 251
previously described (Klaren et al., 2005). Protein concentrations in the homogenates 252
were measured with a Coomassie Brilliant Blue reagent kit (Bio-Rad, München, 253
Germany) using bovine serum albumin (BSA) as the standard. Deiodination rates 254
were normalized using the total homogenate protein in the reaction and were 255
corrected for non-enzymatic deiodination. 256
257
2.9 Plasma parameters
258
Plasma osmolality was measured with a vapour pressure osmometer and expressed as 259
mOsm kg−1 H2
Plasma cortisol was measured by radioimmunoassay (RIA) (Arends et al., 1999). 267
Plasma free thyroxine (fT4) concentrations were determined using a commercially 268
available kit (DELFIA® fT4, PerkinElmer Life and Analytical Sciences, Turku, 269
Finland), which consists of a solid phase time-resolved fluoroimmunoassay reaction 270
and measurements were performed using a Wallac Victor
O. Plasma glucose, lactate and triglyceride levels were measured using 260
commercial kits from Spinreact adapted to 96-well microplates. The total plasma 261
protein concentration was determined in diluted plasma samples using a bicinchoninic 262
acid BCA Protein Assay Kit (Pierce, IL, USA) using BSA as a standard. All assays 263
were performed with a Bio Kinetic EL-340i Automated Microplate Reader (BioTek 264
Instruments, Winooski, VT, USA) using Deltasoft3 software for Macintosh 265
(BioMetallics Inc., Princeton Junction, NJ, USA). 266
2
1420 multilabel counter. 271
Page 10 of 37
Serially diluted S. aurata charcoal-stripped plasma produced binding curves that were 272
parallel to the standard curve (results not shown). 273
Plasma free triiodothyronine (fT3) levels were measured with a solid phase 274
competitive ELISA (Human Diagnostics, Wiesbaden, Germany) according to the 275
manufacturer´s instructions as previously described for this species (Vargas-Chacoff et 276
al., 2016). Absorbance was measured in a Bio-Rad Model-680 microplate reader (Bio-277
Rad, Veenendaal, The Netherlands). Samples were diluted with S. aurata charcoal-278
stripped plasma when the measured concentrations of fT3 were above the maximum 279 standard concentration. 280 281 2.10 Na+/K+-ATPase activity 282
Na+/K+-ATPase activities in gill and kidney homogenates were determined in 283
microplates using McCormick’s method (McCormick, 1993) with modifications 284 (Mancera et al., 2002). 285 286 2.11 Statistics 287
Differences between groups were tested using a one-way ANOVA with 288
environmental salinity as the factor of variance. When necessary, data were 289
logarithmically transformed to fulfil the requirements for parametric ANOVA. 290
Normality was analysed using the Kolmogorov-Smirnov´s test. The homogeneity of 291
variances was analysed using Levene´s test. When ANOVA yielded significant 292
differences, Tukey's post-hoc test was used to identify significantly different groups. 293
When data did not comply with the premises of the parametric ANOVA, data were 294
analysed using a Kruskal–Wallis ANOVA by ranks. Correlations between free THs, 295
relative to mRNA expression of tshβ, dio1 and dio2, and ORD activities in gill and 296
kidney were analysed using linear regression on mean values of parameters measured 297
in the experimental groups, as previously described (Speers-Roesch et al., 2015). 298
Statistical significance was accepted at p<0.05. All the results are given as mean ± 299
standard error of the mean (SEM). 300 301 3. Results 302 303 3.1 Biometrics 304
Page 11 of 37
None of the groups differed in length or body mass at the start of the 14-days 305
acclimation period (data not shown). No mortality was recorded during the 306
experimental period. At the end of the acclimation period HSI decreased significantly 307
in animals exposed to 55 ppt (HSI 0.67 ± 0.05 %) compared to animals acclimated to 308
15 ppt (HSI 0.94 ± 0.06 %) or 40 ppt (HSI 0.96 ± 0.06 %) 309
310
3.2 Tshb amino acid sequence
311
The full-length sequence of S. aurata tshb consisted of 870 bp (accession number 312
KM014688) and had an open reading frame (ORF) of 438 nucleotides that encoded a 313
146 aa protein (Supplementary File 3). Multiple sequence alignment of Tshb 314
(Supplementary File 4) from seabream and a wide selection of vertebrates revealed 315
they shared from 39 % aa sequence conservation with mammals and reptiles (anole 316
lizard) up to 92 % aa sequence conservation with Perciformes (European sea bass) 317
(Supplementary File 5). In common with other jawed vertebrates S. aurata, Tshb 318
possessed a signal peptide of 20 aa and contained 12 conserved cysteine residues and 319
a putative site for asparagine-linked glycosylation (Supplementary File 5). 320
Evolutionary analysis of S. aurata Tshb using the maximum likelihood method 321
confirmed its identity and revealed that the branching of the consensus phylogenetic 322
tree was consistent with established evolutionary relationships (Figure 1). The 323
exception was the chondrosteian Siberian sturgeon that grouped with the tetrapods. 324
Percomorphs grouped into one clade, with tetraodontidae (82-84 % aa sequence 325
conservation), cichlids (84 % aa sequence conservation) and ovalentaria (medaka and 326
platy fish, 71-78 % aa sequence conservation) in subclades. The Perciformes grouped 327
into a consistent clade with the exception of the ovalentaria, a newly established fish 328
clade (Wainwright et al., 2012). Seabream Tshb shared 70 % aa sequence identity 329
with Salmoniformes and 60 % with Cypriniformes. The aa sequence identity between 330
seabream Tshb and tetrapod TSHB was approximately 40 %. 331
332
3.3 Pituitary tshb mRNA expression
333
Pituitary tshb gene expression was significantly (p<0.05) higher (65 %) in animals 334
acclimated to 55 ppt salinity compared to groups acclimated to 5 or 40 ppt salinity 335
(Figure 2). No significant differences were detected between animals acclimated to 15 336
ppt and any of the other groups. 337
Page 12 of 37
3.4 Plasma fTH levels
339
Free T4 (fT4) concentrations in plasma were significantly higher (p=0.0002, one-way 340
ANOVA followed by a Tukey post hoc test; salinity effect p=0.014; N=4 per group) 341
in animals acclimated to 5 and 15 ppt compared to fish acclimated to 40 and 55 ppt 342
salinities. Plasma free T3 was also significantly higher (p between 0.019 and 0.010, 343
one-way ANOVA followed by a Tukey post hoc test; salinity effect p=0.0019; N=4 344
per group) in fish acclimated to 5 ppt compared to those maintained at 15, 40 and 55 345
ppt (Figure 3). 346
347
3.5 deiodinases type 1 and 2 mRNA expression in gills and kidney
348
Branchial dio1 transcript abundance was significantly lower in seabream acclimated 349
to 5 ppt salinity, with 37 % lower mRNA expression in the 5 ppt-acclimated fish 350
relative to those maintained at 40 ppt (control) and 55 ppt salinity (salinity effect 351
p=0.025; N=5 per group). Conversely, deiodinase type 2 (dio2) gene expression was 352
significantly higher (salinity effect p=0.007; N=5 per group) in fish acclimated to 15 353
ppt compared to fish at 40 and 55 ppt salinity (Figure 4A). In contrast, transcript 354
abundance of deiodinase type 1 (dio1) in kidney did not vary between groups. 355
However, dio2 expression was significantly higher in the 5 ppt group (210 % higher 356
than the control group) compared to the 55 ppt salinity group (25 % less expression 357
than the control group (Figure 4B). 358
359
3.6 ORD activity in gills and kidney
360
Branchial and renal T4-ORD activities were higher in animals acclimated to salinities 361
of 5 and 15 ppt compared to animals acclimated to 40 and 55 ppt salinity (Figure 5). 362
However, when incubated with rT3, gill and renal ORD activities were not 363
significantly different between groups. Kidney T3-ORD activity increased with 364
increased salinity with T3-ORD rates measured at 40 and 55 ppt twice as high as 365
those measured at 5 ppt. 366
367
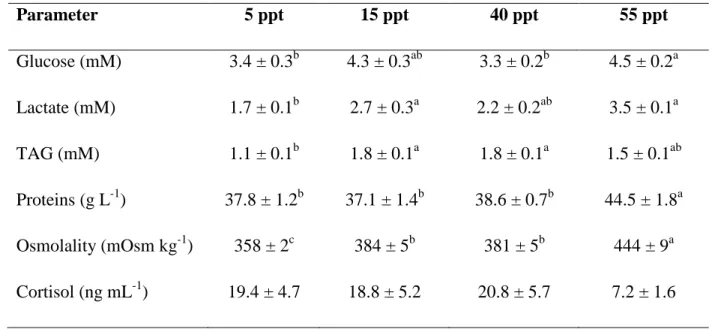
3.7 Plasma osmolality, metabolites and cortisol levels
368
Plasma parameters significantly differed between the experimental groups (Table 1). 369
Plasma osmolality increased with increasing salinity. In general, all plasma metabolite 370
concentrations were significantly higher in fish at 55 ppt and lower in fish at 5 ppt 371
Page 13 of 37
compared with fish at 15 ppt and 40 ppt salinities. Plasma cortisol concentrations 372
were similar between all the experimental groups. 373
374
3.8 Correlations between components of the thyroid system
375
Correlations between elements of the thyroid system in fish exposed to different 376
salinities are indicated in Supplementary File 6. Correlation analysis revealed the 377
highest plasma fT3 levels inhibited pituitary tshb mRNA expression (Pearson r 378
coefficient, r=-0.820). Hence, 67.2 % of the variance of tshb expression was 379
explained by plasma fT3 concentrations (r2=0.672, p=0.180). A positive correlation 380
was found between plasma fT4 and higher dio2 expression in gills and kidney 381
(r2=0.827 and r2=0.917, respectively). Branchial dio2 expression correlated positively 382
with T3- and T4-ORD branchial activities (r2=0.933 and r2=0.894, respectively). In 383
this sense, renal dio2 expression correlated positively with rT3- and T4-ORD renal 384
activities (r2=0.764 and r2=0.684, respectively), but was negatively correlated with 385
T3-ORD activity in this tissue (r2=0.998). Finally, plasma fT3 displayed a positive 386
and strong correlation with renal dio1 expression (r2=0.935). 387
388
3.9 Na+/K+-ATPase activity in gills and kidney
389
Branchial Na+/K+-ATPase activity as a function of ambient salinity was significantly 390
higher in fish acclimated to 55 and 5 ppt salinities compared to fish at 15 ppt salinity. 391
Renal Na+/K+
The present study substantiates the notion that the thyroid system is regulated by 397
changes in salinity in gilthead seabream. In this sense, a range covering 5 to 55 ppt 398
salinity modified tshb gene expression, fTHs concentrations in plasma, ORD activities 399
and relative mRNA levels of deiodinases in osmoregulatory organs (gills and kidney). 400
The change in the thyroid system in response to a salinity challenge suggests it is 401
involved and/or affected during the acclimation of seabream to changing osmolality 402
conditions. Physiological processes regulated by the thyroid system such as growth or 403
reproduction (Nugegoda and Kibria, 2016), of paramount relevance for the 404
-ATPase activity was not significantly different between experimental 392
fish groups (Supplementary File 7). 393
394
4. Discussion
395 396
Page 14 of 37
aquaculture, will consequently be modified when seabream culture occurs at different 405
salinities. 406
Although pituitary tshb is differentially expressed in response to environmental 407
salinity, only 67.2 % of its variance is explained by changes in plasma fT3, and less 408
by plasma fT4 (23.6 %) (Supplementary Figure 6). Our findings reveal that although 409
fT3 levels partially modulate pituitary expression of tshb, its fine regulation is 410
dependent on the total amount of T3 and/or T4 in plasma. Thus, the classical feedback 411
mechanism in which plasma T3 regulates TSH secretion was evident only in the 412
extreme-salinity groups (5 and 55 ppt). On the other hand, the absence of a clear 413
correlation between plasma fTHs and pituitary expression of tshb may suggest that the 414
thyroid system is not fully controlled by the pituitary, but may be fine-tuned at the 415
peripheral tissue level. 416
Our findings indicate that gilthead seabream maintains thyroidal homeostasis (viz. 417
stable fT3 concentrations in plasma) in a wide range of environmental salinities (from 418
15 to 55 ppt) by changing plasma fT4 levels (higher levels at hypo- and isosmotic 419
environments), in common with what occurs in Solea senegalensis (Arjona et al., 420
2008) and Acipenser stellatus (Krayushkina et al., 2015). The differences in plasma 421
fT4 levels in our study are probably due to changes in T4 production/secretion by the 422
thyroid gland, and/or changes in peripheral thyroid hormone metabolism. 423
Deiodination of T4 towards the formation of the active T3 is carried out by Dio1 and 424
Dio2 enzymes (Klaren et al., 2008). The substrate specificity of gilthead seabream 425
Dio1 and Dio2 is not well established. In the present study, incubations with different 426
substrates for the Dio1 and Dio2 deiodinases (T3, rT3 and T4), reveal that T4-ORD 427
activity in gills and kidney decreases with environmental salinity while no changes in 428
rT3-ORD activity occurred in any of the groups tested. Despite these similarities, 429
there are some differences between both tissues that should be mentioned. In this 430
sense, gill ORD activity is maximal when rT3 is the substrate (Figure 5A), while the 431
highest renal activity occurs with T4 as the substrate (Figure 5B). These differences in 432
deiodinase activity between the gills and the kidney may be explained by differing 433
ratios of Dio1 and Dio2 enzymes in these tissues. Thus, the apparent substrate 434
preference of mammalian and fish Dio1 for rT3 rather than T4 (Klaren et al., 2005; 435
Kohrle, 1999) could indicate that the main deiodinase in gilthead seabream gills is 436
Dio1. Herein, the expression of dio2 in both tissues positively correlates with T4-437
ORD activity (Supplementary Figure 6), pointing to T4 as the preferential substrate 438
Page 15 of 37
for gilthead seabream Dio2. Thus, the high T4-ORD activity revealed for the 439
seabream kidney in the present study may indicate that the predominant deiodinase in 440
this tissue is Dio2 rather than Dio1, even though Dio1 is also expressed. 441
The presence of Dio2 in gills seems to depend on the fish species studied (Lorgen et 442
al., 2015; Orozco et al., 2000), although recent studies in S. aurata have illustrated 443
that the thyroid metabolism canonical pathway is clearly regulated by salinity changes 444
in this osmoregulatory tissue (Martos-Sitcha et al., 2016). In S. aurata dio2 mRNA 445
expression occurs not only in gills, but also in kidney indicating that Dio2 is relevant 446
in osmoregulatory organs. We provide some correlations between plasma fT4 447
concentrations and expression of dio2 in both gills and kidney, indicating an 448
enhancement in peripheral ORD activity when circulating T4 levels increase. The 449
results of the present study in seabream coincide with those of previous studies in 450
fish, as the expression of Dio2 is described to increase in hyposmotic salinities 451
(López-Bojórquez et al., 2007) due to the presence of osmotic response elements in 452
the dio2 promoter region (Lorgen et al., 2015). Moreover, gill dio1 expression 453
increases with environmental salinity in S. aurata (Figure 4A), and this may suggest 454
that TH inactivation pathways (as this enzyme also presents inner ring deiodinase 455
activity) are involved in acclimation to hyperosmotic conditions. The results obtained 456
ex vivo when T3 was used as the substrate for kidney were negatively correlated with
457
renal dio2 expression (Supplementary Figure 6), and this may indicate that high levels 458
of T3 inhibit dio2 expression in this tissue. ORD and IRD (inner ring deiodination) 459
processes could then be modulated jointly, as renal dio1 expression was upregulated 460
by plasma fT3 concentrations (Supplementary Figure 6), sustaining an increased IRD 461
activity in the kidney when T3 levels were high. However, the enhanced T3-ORD 462
activity in kidney at higher salinities (40 and 55 ppt) was not accompanied by 463
differences in dio1 transcript abundance suggesting that regulation of deiodinase 464
transcription and translation diverge. Overall, our results of ORD activity and mRNA 465
expression support the idea of Dio2 as the main “osmoregulatory deiodinase” in 466
seabream with Dio1 taking a secondary role. 467
The elevated fTH levels measured in hyposmotic conditions (5 ppt) can be interpreted 468
as an acclimation response that may increase the activity of ion transporters in 469
osmoregulatory organs (Laiz-Carrion et al., 2005a). In this sense it was postulated that 470
THs interact with other hormones such as cortisol and GH/IGF-I in order to increase 471
the osmoregulatory capacity of fish (McCormick, 2011). As the highest fT3 levels 472
Page 16 of 37
shown in this study (fish acclimated to 5 ppt) are related to reduced growth rates 473
(Laiz-Carrion et al., 2005b), it could be suggested that T3 reallocates metabolic 474
energy from growth processes to ion transport and osmoregulation so that seabream 475
can cope with the ionoregulatory demands dictated by low salinity (5 ppt) 476
environments (higher ion transport and water retention). In agreement with this, gill 477
Na+/K+
506
-ATPase activity was maximal at 5 ppt. The metabolic actions of THs have 478
been associated with increased plasma levels of energy metabolites (Vargas-Chacoff 479
et al., 2016). However, the results of the present study are not in total concordance 480
with this idea as seabream acclimated to 55 ppt had low levels of fTHs but a high 481
concentration of metabolites in plasma and highest branchial NKA activity. 482
Regarding to this, previous works reported in this species that extreme salinities are 483
associated with higher gill NKA (Laiz-Carrión et al., 2005a) and thus metabolic 484
activities. This may suggest that metabolite turnover is not only regulated by the 485
thyroid system at this salinity (55 ppt). 486
In conclusion, the thyroid system of gilthead seabream (Sparus aurata) is regulated 487
by salinity. Hypo- and isosmotic environments cause an increase in plasma fTH levels 488
evoking a hyperthyroid condition. Environmental salinity modulated ORD activity in 489
osmoregulatory tissues such as the gills and kidney supporting the idea that the 490
thyroid system is involved in osmoregulation in fish. Gills seem to have 491
predominantly Dio1 activity as indicated by high rT3-ORD activity, while kidney has 492
mainly Dio2 activity, as indicated by the high T4-ORD activity. Dio2 seems to be 493
more responsive to osmoregulatory changes than Dio1, and we propose Dio2 should 494
be considered as the main “osmoregulatory deiodinase” in the seabream. Our results 495
indicate that the peripheral tissue plays an important role in TH regulation during 496
osmoregulation in seabream. 497
498
Acknowledgments. This work was partially supported by a Socrates/Erasmus Grant
499
from the European Union and a Ph.D. scholarship from the University of Cadiz (UCA 500
2009-074-FPI) to I. R-J. It has been also supported by grants AGL2007-61211/ACU 501
(Ministerio de Educación y Ciencia and FEDER, Spain) and Proyecto de Excelencia 502
PO7-RNM-02843 (Junta de Andalucía) to J.M.M. BL (SFRH/BPD/89889/2012) and 503
PISP (SFRH/BPD/84033/2012) were supported by the Science Foundation (FCT) of 504
Portugal. 505
Page 17 of 37
References
507 508
Altschul, S.F., Boguski, M.S., Gish, W., Wootton, J.C., 1994. Issues in searching 509
molecular sequence databases. Nat Genet 6, 119-129. 510
Arends, R.J., Mancera, J.M., Munoz, J.L., Wendelaar Bonga, S.E., Flik, G., 1999. The 511
stress response of the gilthead sea bream (Sparus aurata L.) to air exposure and 512
confinement. J Endocrinol 163, 149-157. 513
Arjona, F.J., Vargas-Chacoff, L., Martin del Rio, M.P., Flik, G., Mancera, J.M., 514
Klaren, P.H.M., 2008. The involvement of thyroid hormones and cortisol in the 515
osmotic acclimation of Solea senegalensis. Gen Comp Endocrinol 155, 796-803. 516
Bernier, N.J., Flik, G., Klaren, P.H.M., 2009. Regulation and contribution of the 517
corticotropic, melanotropic and thyrotropic axes to the stress response in fishes, 518
in: N.J. Bernier, G. van der Kraak, A.P. Farrell, C.J. Brauner (Eds.), Fish 519
Physiology. Academic Press, 235-311. 520
Birnboim, H.C., Doly, J., 1979. A rapid alkaline extraction procedure for screening 521
recombinant plasmid DNA. Nucleic Acids Res 7, 1513-1523. 522
Blanton, M.L., Specker, J.L., 2007. The hypothalamic-pituitary-thyroid (HPT) axis in 523
fish and its role in fish development and reproduction. Crit Rev Toxicol 37, 97-524
115. 525
Cohn, W.B., Jones, R.A., Valverde, R.A., Leiner, K.A., MacKenzie, D.S., 2010. 526
Molecular cloning and regulation of mRNA expression of the thyrotropin beta 527
and glycoprotein hormone alpha subunits in red drum, Sciaenops ocellatus. Fish 528
Physiol Biochem 36, 1277-1290. 529
Eales, J.G., Brown, S.B., 1993. Measurement and regulation of thyroidal status in 530
teleost fish. Rev Fish Biol Fisher 3, 299-347. 531
Felsenstein, J., 1985. Confidence limits on phylogenies: an approach using the 532
bootstrap. Evolution 39, 783-791. 533
Garcia-G, C., Jeziorski, M.C., Valverde-R, C., Orozco, A., 2004. Effects of 534
iodothyronines on the hepatic outer-ring deiodinating pathway in killifish. Gen 535
Comp Endocr 135, 201-209. 536
Gouy, M., Guindon, S., Gascuel, O., 2010. SeaView Version 4: A multiplatform 537
graphical user interface for sequence alignment and phylogenetic tree building. 538
Mol Biol Evol 27, 221-224. 539
Page 18 of 37
Jones, D.T., Taylor, W.R., Thornton, J.M., 1992. The rapid generation of mutation 540
data matrices from protein sequences. Computer applications in the biosciences: 541
CABIOS 8, 275-282. 542
Keane, T., Creevey, C., Pentony, M., Naughton, T., Mclnerney, J., 2006. Assessment 543
of methods for amino acid matrix selection and their use on empirical data shows 544
that ad hoc assumptions for choice of matrix are not justified. BMC Evol Biol 6, 545
29. 546
Klaren, P.H.M., Geven, E.J.W., Flik, G., 2008. The involvement of the thyroid gland 547
in teleost osmoregulation, in: B. Baldisserotto, J.M. Mancera, B.G. Kapoor 548
(Eds.), Fish osmoregulation. Science Publisher, Enfield, USA, 35-65. 549
Klaren, P.H.M., Geven, E.J.W., Nagelkerke, A., Flik, G., 2012. Kinetics and thiol 550
requirements of iodothyronine 5'-deiodination are tissue-specific in common carp 551
(Cyprinus carpio L.). Comp Biochem Physiol B Biochem Mol Biol 161, 275-552
282. 553
Klaren, P.H.M., Guzman, J.M., Reutelingsperger, S.J., Mancera, J.M., Flik, G., 2007. 554
Low salinity acclimation and thyroid hormone metabolizing enzymes in gilthead 555
seabream (Sparus auratus). Gen Comp Endocrinol 152, 215-222. 556
Klaren, P.H.M., Haasdijk, R., Metz, J.R., Nitsch, L.M.C., Darras, V.M., Van der 557
Geyten, S., Flik, G., 2005. Characterization of an iodothyronine 5'-deiodinase in 558
gilthead seabream (Sparus auratus) that is inhibited by dithiothreitol. 559
Endocrinology 146, 5621-5630. 560
Kohrle, J., 1999. Local activation and inactivation of thyroid hormones: the 561
deiodinase family. Mol Cell Endocrinol 151, 103-119. 562
Krayushkina, L.S., Semenova, O.G., Vyushina, A.V., Gerasimov, A.A., 2015. 563
Morphofunctional remodelling of the osmoregulatory system in starred sturgeon 564
Acipenser stellatus (Acipenseridae) during transition from hyperosmotic to
565
hypoosmotic regulation. J Ichthyol 55, 259-272. 566
Laiz-Carrion, R., Guerreiro, P.M., Fuentes, J., Canario, A.V.M., Martin Del Rio, 567
M.P., Mancera, J.M., 2005a. Branchial osmoregulatory response to salinity in the 568
gilthead sea bream, Sparus auratus. J Exp Zool Part A 303A, 563-576. 569
Laiz-Carrion, R., Sangiao-Alvarellos, S., Guzman, J.M., Martin del Rio, M.P., 570
Soengas, J.L., Mancera, J.M., 2005b. Growth performance of gilthead sea bream 571
Sparus aurata in different osmotic conditions: implications for osmoregulation
572
and energy metabolism. Aquaculture 250, 849-861. 573
Page 19 of 37
Leatherland, J.F. Farbridge, K.J., 1992. Chronic fasting reduced the response of the 574
thyroid to growth hormone and TSH, and alers the growth hormone-related 575
changes in hepatic 5´-monodeiodinase activity in rainbow trout, Oncorhynchus 576
mykiss. Gen Comp Endocrinol 87, 342-53.
577
Livak, K.J., Schmittgen, T.D., 2001. Analysis of relative gene expression data using 578
real-time quantitative PCR and the 2-ΔΔCT method. Methods 25, 402-408. 579
López-Bojórquez, L., Villalobos, P., Garcia-G, C., Orozco, A., Valverde-R, C., 2007. 580
Functional identification of an osmotic response element (ORE) in the promoter 581
region of the killifish deiodinase 2 gene (FhDio2). J Exp Biol 210, 3126-3132. 582
Lorgen, M., Casadei, E., Krol, E., Douglas, A., Birnie, M.J., Ebbesson, L.O., Nilsen, 583
T.O., Jordan, W.C., Jorgensen, E.H., Dardente, H., Hazlerigg, D.G., Martin, S.A., 584
2015. Functional divergence of type 2 deiodinase paralogs in the Atlantic salmon. 585
Curr Biol 25, 936-941. 586
Louro, B., Passos, A.L., Power, D., 2005. Transcriptome analysis of the gilthead sea 587
bream (Sparus auratus) pituitary gland: Type I markers for molecular genetics. 588
Revista Portuguesa de Zootecnia 12, 91-105. 589
Mancera, J.M., Laiz Carrion, R., Martín del Río, M.P., 2002. Osmoregulatory action 590
of PRL, GH, and cortisol in the gilthead seabream (Sparus aurata L.). Gen Comp 591
Endocrinol 129, 95-103. 592
Manchado, M., Infante, C., Asensio, E., Planas, J.V., Canavate, J.P., 2008. Thyroid 593
hormones down-regulate thyrotropin [beta] subunit and thyroglobulin during 594
metamorphosis in the flatfish Senegalese sole (Solea senegalensis Kaup). Gen 595
Comp Endocrinol 155, 447-455. 596
Martos-Sitcha, J.A., Mancera, J.M., Calduch-Giner, J.A., Yufera, M., Martinez-597
Rodriguez, G., Perez-Sanchez, J., 2016. Unraveling the tissue-specific gene 598
signatures of gilthead sea bream (Sparus aurata L.) after hyper- and hypo-599
osmotic challenges. PLoS One 11, e0148113. 600
McCormick, S.D., 1993. Methods for nonlethal gill biopsy and measurement of Na+, 601
K+-ATPase activity. Can J Fish Aquat Sci 50, 656-658. 602
McCormick, S.D., 2011. The hormonal control of osmoregulation in teleost fish, in: 603
A.P. Farrell (Ed.), Encyclopedia of Fish Physiology: From Genome to 604
Environment. Academic Press, San Diego, 1466-1473. 605
Mol, J.A., Visser, T.J., 1985. Rapid and selective inner ring deiodination of thyroxine 606
sulfate by rat liver deiodinase. Endocrinology 117, 8-12. 607
Page 20 of 37
Nugegoda, D., Kibria, G., 2016. Effects of environmental chemicals on fish thyroid 608
function: Implications for fisheries and aquaculture in Australia. Gen Comp 609
Endocrinol (DOI 10.1016/j.ygcen.2016.02.021). 610
Orozco, A., Linser, P., Valverde, C., 2000. Kinetic characterization of outer-ring 611
deiodinase activity (ORD) in the liver, gill and retina of the killifish Fundulus 612
heteroclitus. Comp Biochem Physiol B Biochem Mol Biol 126, 283-290.
613
Orozco, A., Silva, J.E., Valverde, R.C., 1997. Rainbow trout liver expresses two 614
iodothyronine phenolic ring deiodinase pathways with the characteristics of 615
mammalian types I and II 5'-deiodinases. Endocrinology 138, 254-258. 616
Power, D.M., Llewellyn, L., Faustino, M., Nowell, M.A., Björnsson, B.T., 617
Einarsdottir, I.E., Canario, A.V.M., Sweeney, G.E., 2001. Thyroid hormones in 618
growth and development of fish. Comp Biochem Phys C 130, 447-459. 619
Speers-Roesch, B., Robinson, J.L., Val, A.L., Almeida-Val, V.M.F., Driedzic, W.R., 620
2015. Interspecific dietary diversity has little influence on pathways of glucose 621
metabolism in liver and heart of piranhas and pacus (family Serrasalmidae). 622
Hydrobiologia, p. 1-15 (DOI 10.1007/s10750-015-2562-0). 623
Tamura, K., Stecher, G., Peterson, D., Filipski, A., Kumar, S., 2013. MEGA6: 624
Molecular Evolutionary Genetics Analysis version 6.0. Mol Biol Evol 30, 2725-625
9. 626
Vargas-Chacoff, L., Ruiz-Jarabo, I., Arjona, F.J., Laiz-Carrion, R., Flik, G., Klaren, 627
P.H.M., Mancera, J.M., 2016. Energy metabolism of hyperthyroid gilthead sea 628
bream Sparus aurata L. Comp Biochem Physiol A Mol Integr Physiol 191, 25-629
34. 630
Visser, G.J., Docter, R., Hennemann, G., 1977. Radioimmunoassay of reverse tri-631
iodothyronine. J Endocrinol 73, 395-396. 632
Wainwright, P.C., Smith, W.L., Price, S.A., Tang, K.L., Sparks, J.S., Ferry, L.A., 633
Kuhn, K.L., Eytan, R.I., Near, T.J., 2012. The evolution of pharyngognathy: A 634
phylogenetic and functional appraisal of the pharyngeal jaw key innovation in 635
labroid fishes and beyond. Syst Biol 61, 1001-1027. 636
637
Figure legends
638 639
Page 21 of 37
Figure 1. Phylogenetic analysis of vertebrate Tshb amino acid sequences using
640
the maximum likelihood method based and a JTT matrix-based model. A
641
bootstrap test of phylogeny was performed with 1,000 replications. Branches with less 642
than 50 % bootstrap support are collapsed into a single clade. The consensus tree is 643
drawn to represent the evolutionary history of the taxa analysed. Partial proteins were 644
not used for phylogenetic analysis. Species included in the analysis were gilthead 645
seabream (S. aurata), European seabass (Dicentrarchus labrax), fugu (Takifugu 646
rubripes
Figure 4. Expression of dio1 and dio2 in osmoregulatory tissues of seabream.
670
Branchial (A) and renal (B) quantitative real-time PCR analysis of deiodinases 1 and 671
2 (dio1, black bars; and dio2, white bars) relative transcript abundance in seabream
672
individuals acclimated to four different environmental salinities for two weeks. 673
), green spotted pufferfish (Tetraodon nigroviridis), zebra mbuna (Maylandia 647
zebra), princess of Burundi (Neolamprologus brichardi), Nile tilapia (Oreochromis
648
niloticus), three-spined stickleback (Gasterosteus aculeatus), platy (Xiphophorus
649
maculatus), medaka (Oryzias latipes), Atlantic cod (Gadus morhua), rainbow trout
650
(Oncorhynchus mykiss), Atlantic salmon (Salmo salar), blind cave fish (Astyanax 651
mexicanus), zebrafish (Danio rerio), common carp (Cyprinus carpio), Japanese eel
652
(Anguilla japonica), spotted gar (Lepisosteus oculatus), Siberian sturgeon (Acipenser 653
baerii), anole lizard (Anolis carolinensis), chicken (Gallus gallus), Chinese softshell
654
turtle (Pelodiscus sinensis), human (Homo sapiens), and mouse (Mus musculus). 655
656
Figure 2. Expression of tshb in pituitary of seabream. Quantitative real-time PCR
657
analysis of tshb transcript abundance in the pituitary gland of seabream after 658
acclimation to 5, 15, 40 and 55 ppt salinity for two weeks. Data were normalized by 659
dividing transcript number by the absolute value of β-actin in every sample. Results 660
are expressed as mean ± SEM (N=8). Different letters indicate significant differences 661
among groups (one-way ANOVA followed by a Tukey test, p<0.05). 662
663
Figure 3. Plasma concentrations for free thyroid hormones (fT3 and fT4) in
664
seabreams acclimated to four different environmental salinities for two weeks (black 665
bars, fT3; white bars, fT4). Results are expressed as mean ± SEM (N=4). Different 666
letters indicate significant differences among groups (capital and lowercase letters 667
represent fT3 and fT4, respectively). Further details as in legend of Figure 2. 668
Page 22 of 37
Different letters indicate significant differences among groups (capital and lowercase 674
letters represent dio1 and dio2 mRNA expression, respectively). Further details as in 675
legend of Figure 2. 676
677
Figure 5. Outer ring deiodination activity in osmoregulatory tissues of seabream.
678
Branchial (A) and renal (B) outer ring deiodination (ORD) activities when incubating 679
with reverse T3 (black bars), 3,5,5´-T3 (light grey bars) and T4 (dark grey bars) in 680
seabream animals acclimated to four different environmental salinities for two weeks. 681
Results are expressed as mean ± SEM (N=5). Different letters indicate significant 682
differences among groups (capital and lowercase letters represent T4- and T3-ORD 683
activity, respectively). Further details as in legend of Figure 2. 684
685
Legends to supplementary files
686 687
Supplementary file 1. Water parameters at different environmental salinities in the
688
experiment. 689
690
Supplementary file 2. Primers, concentrations (in nM) and amplicon sizes used for
691
qPCR analysis of seabream tshb, dio1, dio2 and actb. Sa denotes Sparus aurata; Fw 692
and Rv indicate forward and reverse primers, respectively. 693
694
Supplementary file 3. Nucleotide sequence for tshb (GenBank acc. no. KM014688)
695
cDNA cloned from seabream. Nucleotides shown in lower case at the beginning and 696
the end designate 5´ and 3´ untranslated regions. Nucleotides for ORF are indicated in 697
upper case, bold and italics. Start and stop codons are indicated in black boxes. 698
Putative adenylation signal aataaa sequence is lower case letter, bold and underlined. 699
700
Supplementary file 4. Tshb sequence identity matrix.
701 702
Supplementary file 5. Multiple sequence alignments for twenty four complete
703
Tshb/TSHB proteins, including the deduced seabream protein sequence. Common and 704
scientific names of the species used and their respective GenBank or NCBI Reference 705
Sequence numbers are as follows: the Percomorph fish gilthead seabream (Sparus 706
aurata, KM014688) and European seabass (Dicentrarchus labrax, CBN80754); the
Page 23 of 37
cichlids Nile tilapia (Oreochromis niloticus, XP_005478198), princess of Burundi 708
(Neolamprologus brichardi, XP_006782879) and zebra mbuna (Maylandia zebra, 709
XP_004547638); the tetraodontiformes green spotted pufferfish (Tetraodon 710
nigroviridis, H3DLQ2_TETNG) and fugu (Takifugu rubripes, XP_003973164);
711
cyprinodontiformes like the platy (Xiphophorus maculatus, XP_005813805); the non 712
Percomorph fish including the Atlantic cod (Gadus morhua, GADMO16328) and two 713
salmonids, Atlantic salmon (Salmo salar, AAC77908) and rainbow trout 714
(Oncorhynchus mykiss, P37240); the cyprinids zebrafish (Danio rerio, AAN08914) 715
and common carp (Cyprinus carpio, BAA20082); the characiform blind cave fish 716
(Astyanax mexicanus, XP_007253483.1); the ancient teleost Japanese eel (Anguilla 717
japonica, AAO17791); the holostean spotted gar (Lepisosteus oculatus, 718
XP_006628446); two reptile species, the Chinese softshell turtle (Pelodiscus sinensis,
719
NP_001273864) and the green anole lizard (Anolis carolinensis, XP_008108073); one 720
bird, chicken (Gallus gallus, AAB88127); and two mammals, mouse (Mus musculus, 721
AAA40492) and human (Homo sapiens, AAA36782). The presumptive signal peptide 722
sequence is underlined, the conserved amino acids residues that share 100 % identity 723
are indicated with bold white letters black boxed. All designated sites and sequences 724
specified are presumptive and based on sequence analysis and comparison. Thus, 725
hairpin loops, the long loop and the seatbelt are underlined. The quoted numbers at
726
the end of each sequence indicate the number of amino acids that each deduced 727
protein contains. 728
729
Supplementary file 6. Product-moment correlation analysis between plasma free
730
thyroid hormones (fT3 and fT4), pituitary tshb and gills and kidney dio1 and dio2 731
mRNA expression, and branchial and renal rT3-, T3- and T4-ORD activities in 732
seabream individuals acclimated to four different environmental salinities for two 733
weeks. Correlation matrixes were performed using the means for each group 734
(environmental salinity of 5, 15, 40 or 55 ppt). Linear regression results are displayed 735
as the Pearson´s coefficient (r), coefficient of determination (r2
Supplementary file 7. Branchial and renal Na
) and p value (p). 736
Variables from the second column on the left are linearly correlated with those 737
variables shown in bold in the top rows. 738
739
+
/K+-ATPase activities (in μmol ADP 740
mg-1 protein h-1) in seabream individuals acclimated to four different environmental 741
Page 24 of 37
salinities for two weeks. Results are expressed as mean ± SEM (N=8). Different 742
letters indicate significant differences among groups (one-way ANOVA followed by a 743
Tukey test, p<0.05). 744
745 746
Page 25 of 37
Figure 1
747
Page 26 of 37
Figure 2
749
750 751
Page 27 of 37
Figure 3
752
753 754
Page 28 of 37 Figure 4 755 756 757 758
Page 29 of 37
Figure 5
759
760 761
Page 30 of 37
Table 1. Plasmatic metabolites and osmoregulatory parameters in seabream
762
individuals acclimated to four different environmental salinities for two weeks. 763
Results are expressed as mean ± SEM (N=8). Different letters indicate significant 764
differences among groups (one-way ANOVA followed by a Tukey test, p<0.05). 765 766 767 768 Parameter 5 ppt 15 ppt 40 ppt 55 ppt Glucose (mM) 3.4 ± 0.3b 4.3 ± 0.3ab 3.3 ± 0.2b 4.5 ± 0.2a Lactate (mM) 1.7 ± 0.1b 2.7 ± 0.3a 2.2 ± 0.2ab 3.5 ± 0.1 TAG (mM) a 1.1 ± 0.1b 1.8 ± 0.1a 1.8 ± 0.1a 1.5 ± 0.1 Proteins (g L ab -1 37.8 ± 1.2 ) b 37.1 ± 1.4b 38.6 ± 0.7b 44.5 ± 1.8 Osmolality (mOsm kg a -1 358 ± 2 ) c 384 ± 5b 381 ± 5b 444 ± 9 Cortisol (ng mL a -1 19.4 ± 4.7 ) 18.8 ± 5.2 20.8 ± 5.7 7.2 ± 1.6
Page 31 of 37 Suppl. 1 769 770 Water parameter 5 ppt 15 ppt 40 ppt 55 ppt Na+ (mM) 63 169 570 780 Cl- (mM) 77 194 588 957 Ca2+ (mM) 2.67 5.19 13.00 17.72 K+ (mM) 1.28 3.48 11.28 15.36 Mg2+ (mM) 6.95 19.46 57.11 88.65 771 772
Page 32 of 37 Suppl. 2 773 774 775 776
Gene Primer Sequence (5´ 3´) Conc.
(nM) Amplicon (bp)
tshb SaTshb_Fw ACGTCATCCTTCAGCTTGTGAT 200 128
SaTshb_Rv CGCTAATGAAAATACCCAGCAG 200
dio1 SaDio1_Fw AGGACAAGAGGCTTTTGTGG 400 123
SaDio1_Rv CTTCCAAAACTCAGCACCAG 400
dio2 SaDio2_Fw GGTTGAGGACTTCAGTGATG 400 103
SaDio2_Rv GAAAGAGCAAGAGCCCATAG 400
actb Saβactin_Fw TCTTCCAGCCATCCTTCCTCG 200 108
Page 33 of 37 Suppl. 3 777 778 779 780
Page 34 of 37 Suppl. 4 781 Spec ies gilt h sea Eur seab fugu g puf zebr a m bun a pri Buru Nile tilap ia th sti plat y med aka Atlan tic c od rain bow tro ut Atla salm blin d cav e fis h zebrafis h com mon carp Japa nese eel spotted gar Sber stur hum an mou se chicke n Chin s ano le liz ard g -91. 7% 81. 5% 84. 2% 83. 5% 84. 2% 83. 5% 80. 9% 70. 9% 78. 0% 63. 6% 71. 4% 68. 7% 58. 9% 58. 2% 58. 9% 54. 4% 47. 0% 43. 9% 39. 7% 41. 7% 39. 0% 39. 7% 38. 5% E 91. 7% -83. 5% 84. 9% 86. 3% 86. 9% 86. 3% 80. 2% 72. 2% 80. 8% 64. 3% 75. 5% 72. 1% 56. 2% 57. 6% 60. 2% 55. 1% 49. 6% 45. 9% 41. 0% 41. 0% 39. 7% 39. 7% 38. 5% f 81. 5% 83. 5% -86. 9% 82. 1% 83. 5% 82. 8% 70. 0% 65. 5% 73. 9% 61. 6% 66. 6% 65. 9% 50. 9% 54. 3% 55. 6% 52. 3% 47. 0% 41. 8% 40. 4% 39. 7% 39. 0% 38. 3% 35. 8% g 84. 2% 84. 9% 86. 9% -80. 8% 81. 5% 80. 8% 73. 4% 64. 8% 73. 2% 60. 2% 68. 0% 64. 6% 54. 3% 54. 9% 56. 2% 53. 0% 45. 6% 41. 2% 41. 0% 41. 7% 39. 7% 40. 4% 37. 1% z 83. 5% 86. 3% 82. 1% 80. 8% -98. 6% 99. 3% 72. 7% 68. 2% 76. 7% 65. 0% 69. 3% 65. 9% 53. 6% 54. 3% 58. 2% 53. 7% 48. 3% 43. 9% 39. 0% 39. 0% 39. 7% 39. 7% 35. 8% p 84. 2% 86. 9% 83. 5% 81. 5% 98. 6% -99. 3% 73. 4% 68. 9% 77. 3% 65. 0% 70. 0% 66. 6% 54. 9% 54. 9% 58. 9% 53. 7% 49. 0% 44. 5% 39. 7% 39. 7% 39. 7% 39. 7% 35. 8% N 83. 5% 86. 3% 82. 8% 80. 8% 99. 3% 99. 3% -72. 7% 68. 2% 76. 7% 65. 0% 69. 3% 65. 9% 54. 3% 54. 3% 58. 2% 53. 0% 49. 0% 44. 5% 39. 7% 39. 7% 39. 7% 39. 7% 35. 8% t 80. 9% 80. 2% 70. 0% 73. 4% 72. 7% 73. 4% 72. 7% -64. 4% 75. 5% 57. 1% 65. 9% 62. 5% 53. 9% 53. 2% 55. 2% 51. 3% 47. 3% 44. 2% 40. 1% 40. 8% 38. 7% 38. 0% 35. 5% p 70. 9% 72. 2% 65. 5% 64. 8% 68. 2% 68. 9% 68. 2% 64. 4% -69. 5% 51. 3% 56. 3% 53. 0% 50. 9% 48. 3% 49. 0% 47. 6% 43. 0% 42. 0% 35. 1% 35. 1% 36. 4% 37. 8% 34. 6% m 78. 0% 80. 8% 73. 9% 73. 2% 76. 7% 77. 3% 76. 7% 75. 5% 69. 5% -58. 9% 64. 6% 61. 2% 54. 9% 54. 9% 56. 2% 55. 7% 49. 6% 41. 2% 36. 3% 34. 9% 36. 3% 36. 3% 36. 4% A 63. 6% 64. 3% 61. 6% 60. 2% 65. 0% 65. 0% 65. 0% 57. 1% 51. 3% 58. 9% -61. 2% 60. 5% 50. 3% 53. 3% 55. 3% 51. 0% 46. 9% 39. 1% 37. 6% 37. 6% 39. 5% 40. 2% 36. 3% r 71. 4% 75. 5% 66. 6% 68. 0% 69. 3% 70. 0% 69. 3% 65. 9% 56. 3% 64. 6% 61. 2% -91. 1% 59. 8% 62. 5% 64. 4% 56. 7% 51. 9% 46. 9% 44. 8% 42. 8% 41. 4% 42. 8% 40. 2% A 68. 7% 72. 1% 65. 9% 64. 6% 65. 9% 66. 6% 65. 9% 62. 5% 53. 0% 61. 2% 60. 5% 91. 1% -57. 8% 60. 5% 61. 1% 54. 0% 49. 3% 48. 2% 46. 8% 44. 6% 43. 8% 45. 3% 42. 5% b 58. 9% 56. 2% 50. 9% 54. 3% 53. 6% 54. 9% 54. 3% 53. 9% 50. 9% 54. 9% 50. 3% 59. 8% 57. 8% -69. 5% 73. 5% 46. 7% 47. 6% 42. 4% 41. 0% 40. 3% 39. 7% 42. 3% 37. 2% z 58. 2% 57. 6% 54. 3% 54. 9% 54. 3% 54. 9% 54. 3% 53. 2% 48. 3% 54. 9% 53. 3% 62. 5% 60. 5% 69. 5% -86. 6% 48. 6% 45. 6% 41. 1% 37. 0% 35. 0% 38. 6% 40. 0% 36. 1% c 58. 9% 60. 2% 55. 6% 56. 2% 58. 2% 58. 9% 58. 2% 55. 2% 49. 0% 56. 2% 55. 3% 64. 4% 61. 1% 73. 5% 86. 6% -50. 0% 47. 0% 43. 1% 39. 7% 37. 7% 41. 0% 42. 3% 36. 6% J 54. 4% 55. 1% 52. 3% 53. 0% 53. 7% 53. 7% 53. 0% 51. 3% 47. 6% 55. 7% 51. 0% 56. 7% 54. 0% 46. 7% 48. 6% 50. 0% -52. 6% 40. 5% 38. 7% 38. 0% 37. 4% 38. 0% 36. 2% s 47. 0% 49. 6% 47. 0% 45. 6% 48. 3% 49. 0% 49. 0% 47. 3% 43. 0% 49. 6% 46. 9% 51. 9% 49. 3% 47. 6% 45. 6% 47. 0% 52. 6% -47. 3% 42. 6% 42. 6% 42. 6% 42. 0% 40. 1% S 43. 9% 45. 9% 41. 8% 41. 2% 43. 9% 44. 5% 44. 5% 44. 2% 42. 0% 41. 2% 39. 1% 46. 9% 48. 2% 42. 4% 41. 1% 43. 1% 40. 5% 47. 3% -53. 8% 55. 9% 51. 7% 55. 2% 46. 8% h 39. 7% 41. 0% 40. 4% 41. 0% 39. 0% 39. 7% 39. 7% 40. 1% 35. 1% 36. 3% 37. 6% 44. 8% 46. 8% 41. 0% 37. 0% 39. 7% 38. 7% 42. 6% 53. 8% -84. 7% 66. 6% 68. 8% 61. 4% m 41. 7% 41. 0% 39. 7% 41. 7% 39. 0% 39. 7% 39. 7% 40. 8% 35. 1% 34. 9% 37. 6% 42. 8% 44. 6% 40. 3% 35. 0% 37. 7% 38. 0% 42. 6% 55. 9% 84. 7% -65. 2% 65. 2% 59. 2% c 39. 0% 39. 7% 39. 0% 39. 7% 39. 7% 39. 7% 39. 7% 38. 7% 36. 4% 36. 3% 39. 5% 41. 4% 43. 8% 39. 7% 38. 6% 41. 0% 37. 4% 42. 6% 51. 7% 66. 6% 65. 2% -79. 8% 66. 1% C 39. 7% 39. 7% 38. 3% 40. 4% 39. 7% 39. 7% 39. 7% 38. 0% 37. 8% 36. 3% 40. 2% 42. 8% 45. 3% 42. 3% 40. 0% 42. 3% 38. 0% 42. 0% 55. 2% 68. 8% 65. 2% 79. 8% -69. 1% a 38. 5% 38. 5% 35. 8% 37. 1% 35. 8% 35. 8% 35. 8% 35. 5% 34. 6% 36. 4% 36. 3% 40. 2% 42. 5% 37. 2% 36. 1% 36. 6% 36. 2% 40. 1% 46. 8% 61. 4% 59. 2% 66. 1% 69. 1%
-Page 35 of 37 Suppl. 5 782 783 784 785
Page 36 of 37 Suppl. 6 786 787 788 Plasma fT3 Plasma fT4 Tissue Variable r r2 p r r2 p Plasma fT3 0.633 0.401 0.367 Pituitary tshb -0.820 0.672 0.180 -0.486 0.236 0.514 Gills dio1 -0.876 0.767 0.124 -0.926 0.857 0.074 dio2 0.281 0.079 0.719 0.910 0.827 0.090 rT3-ORD -0.781 0.611 0.218 -0.252 0.063 0.748 T3-ORD 0.148 0.022 0.852 0.858 0.737 0.142 T4-ORD 0.579 0.335 0.421 0.987 0.974 0.013 Kidney dio1 0.967 0.935 0.033 0.713 0.508 0.287 dio2 0.828 0.686 0.172 0.958 0.917 0.042 rT3-ORD 0.546 0.298 0.454 0.939 0.882 0.061 T3-ORD -0.830 0.688 0.170 0.957 0.916 0.043 T4-ORD 0.742 0.551 0.258 0.781 0.609 0.219
Gill dio1 Gill dio2
r r2 p r r2 p
Gill rT3-ORD 0.506 0.256 0.494 -0.013 0.000 0.987
T3-ORD -0.607 0.368 0.393 0.966 0.933 0.034
T4-ORD -0.884 0.781 0.116 0.945 0.894 0.055
Kidney dio1 Kidney dio2
r r2 p r r2 p
Kidney rT3-ORD 0.702 0.493 0.298 0.874 0.764 0.126
T3-ORD -0.879 0.773 0.121 -0.999 0.998 0.001
Page 37 of 37 Suppl. 7 789 790 791 792 Na+/K+-ATPase activity (μmol ADP mg-1 prot h-1 5 ppt ) 15 ppt 40 ppt 55 ppt Gills 12.6 ± 1.1b 8.8 ± 0.4c 9.7 ± 0.7bc 22.2 ± 2.9a Kidney 12.2 ± 0.9 11.7 ± 0.4 11.6 ± 1.0 11.7 ± 0.8