CRIMINALITY SPATIAL DYNAMIC IN MANAUS CITY, AM
E. P. SILVA1, S. LAUDARES2, M. P. LIBÓRIO3, M. P. EKEL41Polícia Militar do Amazonas, 2,3PUC Minas, 4FAPEMIG
[email protected] 4 Received 26/02/2017 -‐ Accepted 04/01/2018 DOI: 10.15628/holos.2018.5698 ABSTRACT
Thefts and robberies are common crimes in urban centers. Criminality control is a state responsibility and the complex urban context turns the police tactics into a hard and, frequently, inefficient task. This paper presents a method to identify, characterize and diagnose areas with highest incidence of thefts and robberies. The method has as a goal to increase security
perception in citizens and improve police efficiency. The results are presented through density maps, photographic records, field reports and descriptive statistics, producing geo-‐intelligence results dealing with geographic and temporal dynamics of theft and robbery crimes in three neighborhoods of Manaus city, in Amazonas state, Brazil.
PALAVRAS-‐CHAVE: Public Security. Thefts and Robberies. Spatial Analysis. Geographic Information Systems.
DINÂMICA ESPACIAL DA CRIMINALIDADE DA CIDADE DE MANAUS, AM
RESUMOOs furtos e os roubos são crimes comuns em centros urbanos. O controle da criminalidade é uma responsabilidade do estado que está inserida em um contexto geográfico complexo, tornando a aplicação de táticas policiais uma tarefa difícil, e frequentemente retratada em ações ineficientes. Este artigo apresenta um método para identificar, caracterizar e diagnosticas áreas com maior concentração de ocorrências de furtos e roubos. A aplicação do método tem como objetivo aumentar a percepção de segurança dos cidadãos
através da melhoria da eficiência das ações policiais. Os resultados são apresentados através de mapas que representam a concentração da criminalidade, registros fotográficos, relatórios de campo e estatísticas descritivas. Assim, consolidam informações para inteligência policial, conferindo uma maior compreensão da dinâmica espaço-‐temporal dos crimes de furto e roubo de três bairros da cidade de Manaus, Estado do Amazonas, Brasil.
KEYWORDS: Segurança Pública. Furtos e Roubos. Análise Espacial. Sistema de Informações Geográficas.
1 INTRODUCTION
Security is defined by Câmara et al. (2002) as a basic need for a healthy survival, evidencing the relevance of violence and criminal control. Violence causes, according to Mathias (2010) are rooted in the urban space segregation, from complex social processes which generate conflicts. These social processes create, then, criminal territories in urban space, demanding, consequently, mechanisms for their prevention.
The fast growth in criminal taxes in the last decades brings Santos (2016) to seek, through the geographical science, for a spatial comprehension of the phenomenon, exploring the nature and the composition of the crimes, as well as criminality distribution among the cities.
In this context, having the thefts and robberies as the principal delicts in the city of Manaus (80% of the registers), in 2006 a police program called ‘’Ronda de Bairro’’ was elaborated. The program, financed by the city community, seeks for the enlargement of security perception through reducing theft and robbery crimes. ‘’Ronda de Bairro’’ is distributed among the 63 neighborhoods of the city, comprehending six police commands in thirteen subareas in a hundred ninety four policing sectors.
Due to this complex spatial dynamic, geographical intelligence application is fundamental, as detailed by Batela et al. (2008), because, according to Moresi et al. (2012), Manaus is turning into an increasingly more urbanized city and it is also becoming more susceptible to crimes incidence.
This paper present a spatial analysis identifying the highest concentration of delicts, delimiting the problem, its features and the catalyzing factors to the criminal practices, allowing the best employment of available police resources.
The hot and cold points mapping, through color system in delicts practices related to thefts and robberies, associated to criminal statistics, will be used to police allocation in days, hours and neighborhoods which present events concentration. Considering this, the purposed work aims to originate preventive and efficient actions organizing police resources, performing a detailed analysis on which factors motivate the success in thefts and robberies practice.
This research has as a goal the study of crimes related to thefts and robberies in Manaus, using spatial analysis techniques such as the hot points mapping or applying Kernel density, cited by Kampel et al. (2001).
2 CRIMES SPATIAL ANALYSIS
The nature of crimes related to thefts and robberies are considered by Chainey (2013) as crimes against patrimony and observing this aspect it is plausible to cite articles 155 (theft) and 157 (robbery) from the Brazilian criminal code. Theft can be defined as the subtraction for your own or for other people, of foreign object, and robbery as the subtraction for your own or for other people accompanied by intimidation, violence or resistance impossibility imposition.
Theft and robbery practice is motivated by the perpetrator perception about the punishment risk and about the benefit generated by the objects. Thus, it is possible to conclude that the practice is made in economical nature decisions, according to Brasil & Pontes (1956). Also, Shikida (2005) highlights that the impunity is a motivating factor for this kind of delicts and a contribution for the violence and criminality growth in the country.
Furthermore, spatial analysis is described by Sousa Neto (2011) as a transformation process of raw data in information, favoring scientific discovery and the efficient decision making. In this context, Longley et al. (2013) indicates that geographic referencing and spatial analysis of criminal events, in the state of São Paulo, among 1998 and 2008, were factors that caused homicide reduction in the state.
Georeferencing and geographic distribution of information consists, according to Pereira & Grassi (2013), in geoprocessing which associated to geographic information systems (GIS) permits interventions in the space seeking to modify a determined phenomenon, as well as in the homicides case in Betim city, Minas Gerais state. GIS, as said by Tavares (2015), is a specific technology, which tool framework is directed to spatial data analysis.
According to Sousa Neto (2011), geovisualization not only presents maps, but potentiates geographical data analysis through the web, attending to a wide arrangement of social and scientific needs, becoming a research field for new visual methods and interactive tools. Thus, as approached by Tavares (2015), through the concept named “geo-‐collaboration” interactive maps are produced by the cooperation of many users and published from the intent of simple geovisualization to spatial crime analysis.
Thus, as in Laudares (2014), the crime mapping is based on highest criminality areas, named hot points, making possible for the police to identify the type of committed delicts, as well as to improve the criminal combat. The identification of hot points associated to theft and robbery crimes using the Kernel density estimative, is designated by Moresi et al. (2012) as a generation of a symmetrical surface which reflects the distance between the interest points to a place of reference based in a statistical function.
Kernel density is defined by Eck et al. (2005) as a nonparametric approach to estimate a variable and it is defined as a problem of data softening. In other bibliographic reference, Rosenblatt (1956) affirms that Kernel density is an estimative function of a probability density, defined by Kernel estimator, according to Formula 1.
𝒇𝒉 𝒙 =𝟏𝒏 𝒏𝒊!𝟏𝒌𝒉 𝒙 − 𝒙𝒊 =𝒏𝒉𝟏 𝒏𝒊!𝒏𝒌 𝒙!𝒙𝒉𝒊 (1)
In which, k is as Kernel results from a positive or negative symmetrical function and h as the smoothing parameter for data softening.
The usage of statistical techniques in Geography for the study of crimes is a frequent approach in literature. In the study of Santos (2016), the techniques of descriptive statistics, as regression and correlation, are employed accompanied by thematic maps, prism maps and three dimensional maps, in the identification of standards and criminal concentration.
In another study, an analysis of influence, based on the cell size created by Kernel density, is presented by Kampel et al. (2001) to estimate criminality and identify spatial criminality standards.
In the analysis of georeferenced data written by Batela et al. (2008), intelligence data were used through enterprise systems to identify the types of crimes in a geographic region, generating geospatial knowledge for short-‐term tactics and mid and long-‐term strategies of Civil Police of The Federal District support.
In summary, this research uses the density map to represent, describe and analyze criminality in Manaus, at the Amazonas state, Brazil. However, unlike another correlated works, using a field study of neighborhoods with highest delicts concentration, a statistical analysis details the criminal temporality features. This advantage allows the prediction of the moments in which preventive police actions should occur.
3 MATERIAL AND METHODS
This work presents an experimental research which applies geographic quantification to describe and comprehend interactions of phenomena constituted on urban space, as seen in Parzen (1962), of criminality spatial dynamics in Manaus city neighborhoods. This analysis of geographic space associated to field research collected observations produced a diagnostic work contemplated by criminal main map and information.
3.1 Study Area
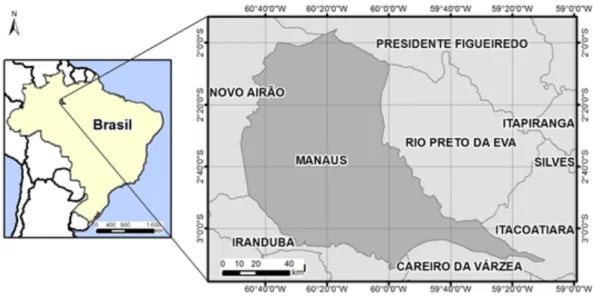
Concerning geographic space of work, in Manaus (Figure 1), the civil and military police are integrated, working on the same physical structure, divided only by its attributed responsibility and subordination. Thus, considering that the city is divided in 194 sectors, with the integrated police structures, the management of police activities in Manaus is a challenge.
Figure 1: Geographic location Map of Manaus, Amazonas.
In the 50’s, according to Moresi et al. (2012), Manaus has grown fast, reaching 54% of urban population in the states of Amazonas, Acre, Roraima and Rondônia all together. Currently,
according to Laudares & Libório (2015), the city has a population of approximately two million inhabitants. For the role of attending the public security needs, six policing areas were divided in 30 sub-‐areas (integrated district police -‐ IDP). Thereby, each IDP has a Civil Police station and a Military Police Interactive Community Company and, moreover, in some districts there is also an unit of Military Fire Department.
3.2 Research Steps
This research is divided in geoprocessing environment structure; geoprocessing and spatial analysis; and delicts diagnosis, see Figure 2.
Figure 2: Methodological flowchart.
At the step (1) geoprocessing space structuration is divided in the phases of data collect and data treatment. The phase of data collect for thefts and robberies registration in Amazonas Public Security Integrated System (PSIS – AM), integrated data platform of Military Police, Civil Police, Fire Department and State Traffic Department. The phase of data treatment related to PSIS – AM is based on classification and structuration of the geographic coordinates registers, neighborhood and area name, police integrated district number, day of the week, time, period and description about how the crime occurred stated in table formats.
In step (2), geoprocessing and spatial analysis, it is presented the georeferencing of criminal cases and the calculation of the density related to this occurrence. The georeferencing is processed in ArcGIS 10.3 desktop GIS IBGE (2010) and the density calculation is processed in the software named Crimestat III ESRI (2006).
In step (3), delicts diagnosis, the areas with highest delicts concentration are identified, visited and photographed, having data related to an specific day of the week and occurrence period (dawn, from 0h to 6h; morning from 6h to 12h; afternoon from 12h to 18h; and evening from 18h to 23:59h) registered.
4 RESULTS
The neighborhoods delimited in Figure 4 map concentrates 70% of thefts and robberies (Figure 3), being identified as Centro (South); Cidade Nova (North); and São José Operário (East).
Figure 3. Manaus neighborhoods highest criminal concentration.
Areas with thefts and robberies concentration, showed in Figure 4, have economic, cultural and social booming features, characterizing, then, a spatial correlation Error! Reference source
not found..
The Neighborhood named Centro, for example, has according to Error! Reference source
not found. a population of 33.183 inhabitants, involving nine policing sectors and the lower
household population among the analyzed neighborhood. The 24º IDP is the integrated police district responsible by Centro, second neighborhood that presents the highest thefts registration. The field research reveals locations with higher presence of commercial points, reflecting an intense people and vehicle flow, as the bus terminal of Matriz (Figure 4).
Figure 4. Matriz Autobus terminal.
Manaus port and Amazonas theatre (Figure 5), both relevant tourism places, contributes for the high visitors presence, turning the neighborhood into one of the main targets of perpetrators actions in criminal engagements.
Figure 5. Eduardo Ribeiro Avenue and Amazonas Theatre (avenue leftside).
Graphic of Figure 6 shows the evolution of theft crimes in the center of Manaus during the week, presenting how the criminal occurrence is distributed among different weekdays.
Figure 6: Manaus Center thefts characterization.
The neighborhood Cidade Nova has, according to Error! Reference source not found., 121.135 inhabitants, counting with eight policing sectors, being the 6º IPD the policing integrated district responsible for the neighborhood. In 2014, Cidade Nova presented the highest robbery number register in Manaus, delicts which were concentrated in the proximities of T3 bus terminal (Figure 7).
The field research identified a higher people flow next to banks, schools, shopping centers and other commercial locations of avenues Noel Nutels (Figure 8) and Max Teixeira. It is possible to affirm that those places are motivating factors for perpetrators actions, according to Error!
Reference source not found. and Error! Reference source not found., about thefts and robberies
execution. (see graphic presented on Figure 9).
Figure 8: Banks and shopping centers near Noel Nutels avenue – Google Maps.
The graphic presented on Figure 9 characterizes theft and robbery crimes in Cidade Nova neighborhood in Manaus. In details, it is showed the percentage that each day of the week represents in the totality of those crimes, as well as the significance of each day period in the occurrences.
Figure 9: Cidade Nova neighborhood thefts and robberies characterization graphic.
The neighborhood São José do Operário, in accordance with Error! Reference source not
found., has a 66.169 inhabitants population, seven policing sectors, which are under 9º IPD
guardianship. In São José do Operário, thefts and robberies registers are concentrate on T5 bus terminal (Figure 10).
Figure 10: T5 bus terminal in Cosme Ferreira avenue (From: Google Maps)
At the field research, it was observed a higher people flow next to commercial areas, bank agencies, schools, shopping centers, and also close to the hospital João Lúcio, as well as around the T5 bus terminal, turning the proximities of Cosme Ferreira and Autaz Mirim avenues into areas of criminal actions committed by perpetrators (see Fingure 11).
Figure 11: Autaz Mirim avenue (From: Google Maps).
The graphic of Figure 12 shows thefts and robberies evolution in São José do Operário neighborhood, presenting the weekdays and the percentage participation of crimes in each day of the week. The graphic also presents how this kind of delicts concentrates among the neighborhood during the different day periods.
Figure 12: São José do Operário neighborhood thefts and robberies characterization.
The results show that the highest criminal incidence happens during the week, period characterized by large people flow among commercial and touristic spheres. Therefore, a plan with efficient ostentatious measurements should observe the crime distribution through policing increase. Figure 13, represents the mobility of the police force according to the distribution of crimes through space and time.
Figure 13: Thefts and robberies crimes distribution through six policing areas of Manaus
In general, the police contingent redistribution must be oriented at the middle of the week, in the beginning of the night, in north and south policing regions due to higher crimes concentration in those areas.
At the police research division, it is up to the Civil Police to analyze, verify and compute information from vulnerable places to the practice of offenses, because as regarded in this research the categorization of the type of theft is neglected. The aggregation of information regarding the way the theft was "materialized", for example: towards X; towards residency; towards commerce, in a bus; and the theft of cars, allows the formulation of several geo-‐ intelligence based initiatives.
5 FINAL CONSIDERATIONS
The results of thefts and robberies crime geographic analysis allowed the indication of the weekdays, periods of the day, neighborhoods and the policing areas with highest delicts concentration, as well as the characterization of those areas through field visitation. These results
evidenced the motivator features of delicts occurrence in those locations and also the higher people flow time, commercial and touristic activities.
Thus, the aim of diagnosing criminal dynamics in Manaus was achieved through maps elaboration and analysis, tables, graphs and photos, giving information to police actions planning which can be able to reduce criminality.
Possible research evolutions using geo-‐statistic techniques could produce data for measuring security public resources efficiency, verifying the adequate positioning or repositioning of this type of equipment to inhibit criminal actions. As an example it is possible to cite the calculation of spatial correlation level degree among police stations, barracks and security cameras with the criminal practice. In further analysis, criminal spots can be applied to study intentional lethal violent crimes.
6 REFERENCES
Batella, W.B., Diniz, A.M.A., Teixeira, A.P. (2008) Explorando os determinantes da geografia do crime nas cidades médias mineiras. Revista de Biologia e Ciências da Terra, v. 8, n. 1, p. 21-‐31. Brazil; Pontes, T.R. (1956) Código penal brasileiro. Livraria Freitas Bastos.
Câmara, G., Monteiro, A.M., Fucks, S.D, Carvalho, M.S. (2002) Análise espacial e geoprocessamento. Análise espacial de dados geográficos, v. 2.
Chainey, S.P. (2013) Examining the influence of cell size and bandwidth size on kernel density estimation crime hotspot maps for predicting spatial patterns of crime. Bulletin of the Geographical Society of Liege, v. 60, p. 7-‐19.
Eck, J., Chainey S., Cameron, J., Wilson, R. (2005) Mapping crime: Understanding hotspots. Washington. National Institute of Justice.
ESRI. (2006) ArcGIS for Desktop. Available in: http://www.esri.com/software/arcgis/arcgis-‐for-‐ desktop/features>. access 12 Jul. 2016.
Harries, K.A. (1999) Mapping crime: Principle and practice. Washington. Department of Justice. IBGE, Instituto Brasileiro de Geografia e Estatística (2010). Censo 2010. Sinopse por setores
censitários. Disponível em: http://www.censo2010.ibge.gov.br/sinopseporsetores/?nivel=st, acessado em: 07 dez. 2015.
Kampel, S.A., Câmara, G., Monteiro, A.M.V. (2001) Análise espacial do processo de urbanização da Amazônia. São José dos Campos: Instituto Nacional de Pesquisas Espaciais.
Laudares, S. (2014) Geotecnologia ao Alcance de Todos. Curitiba. Ed. Appris, 1 ed.
Laudares, S., Libório, M.P. (2015) Análise Discriminante em Estudos De Sistemas Integrados: Um Transecto Urbano em Itaúna-‐MG. Anais do XI ENANPEGE. XI ENCONTRO NACIONAL DA ANPEGE. Presidente Prudente, SP. p. 5.723-‐5.733.
Levine, N. (2004) CrimeStat III: a spatial statistics program for the analysis of crime incident locations (version 3.0). Houston (TX): Ned Levine & Associates/Washington, DC: National Institute of Justice.
Longley, P.A., Maguire, D.J., Goodchild, M.F., Rhind, D.W. (2013) Sistema e ciência da informação geográfica. 3. ed. Porto Alegre: Bookman.
Mathias, J.C.S. A (2010) Polícia Militar E As Políticas Públicas Municipais Na Prevenção Criminal. Revista LEVS, n. 5.
Moresi, E.A.D., Santos Filho, R.P. dos, Silva, J.W.C. da. (2012) Inteligência Geoespacial: um estudo aplicado à Polícia Civil do Distrito Federal. Sistemas, Cibernética e Informática v. 9, n. 2.
Parzen, E. (1962) On estimation of a probability density function and mode. The annals of mathematical statistics, v. 33, n. 3, p. 1065-‐1076.
Pereira, A.L.G., Grassi, R.A. (2013) Compreendendo a redução dos homicídios no estado de São Paulo no período 1998-‐2008. Revista Teoria e Evidência Econômica, v. 19, n. 40.
Rosenblatt, M. (1956) Remarks on some nonparametric estimates of a density function. The Annals of Mathematical Statistics, v. 27, n. 3, p. 832-‐837.
Santos, M.A.F. (2016) Territórios Do Crime No Espaço Urbano E Mecanismos De Prevenção. Revista da ANPEGE, v. 11, n. 16, p. 279-‐341.
Shikida, P.F.A. (2005) Economia do crime: teoria e evidências empíricas a partir de um estudo de caso na Penitenciária Estadual de Piraquara (PR). Revista de Economia e Administração, São Paulo, v. 4, n. 3, p. 315-‐342.
Sousa Neto, H.A. de. (2011) Crime de furto: fatores preponderantes para a baixa resolutividade em Teresina. [on-‐line]. Universidade Federal de Santa Catarina. Projeto Buscalegis.
Tavares, C.L. (2015) A relação entre fatores socioeconômicos e índice de homicídios em Betim-‐MG: uma modelagem utilizando sistemas de informações geográficas. Belo Horizonte: FACE.