Repositório ISCTE-IUL
Deposited in Repositório ISCTE-IUL:
2018-11-19
Deposited version:
Post-print
Peer-review status of attached file:
Peer-reviewed
Citation for published item:
Bhimani, A., Gulamhussen, M. A. & Lopes, S. (2009). The effectiveness of auditor's going concern evaluation as an external governance mechanism: evidence form bank loan defaults. The
International Journal of Accounting. 44 (3), 239-255
Further information on publisher's website:
10.1016/j.intacc.2009.06.002
Publisher's copyright statement:
This is the peer reviewed version of the following article: Bhimani, A., Gulamhussen, M. A. & Lopes, S. (2009). The effectiveness of auditor's going concern evaluation as an external governance
mechanism: evidence form bank loan defaults. The International Journal of Accounting. 44 (3), 239-255, which has been published in final form at https://dx.doi.org/10.1016/j.intacc.2009.06.002. This article may be used for non-commercial purposes in accordance with the Publisher's Terms and Conditions for self-archiving.
Use policy
Creative Commons CC BY 4.0
The full-text may be used and/or reproduced, and given to third parties in any format or medium, without prior permission or charge, for personal research or study, educational, or not-for-profit purposes provided that:
• a full bibliographic reference is made to the original source • a link is made to the metadata record in the Repository • the full-text is not changed in any way
The effectiveness of the auditor's going concern evaluation as an external governance
mechanism: Evidence from loan defaults*
Alnoor Bhimani, London School of Economics Mohamed Azzim Gulamhussen, ISCTE Business School
Samuel Lopes, European Central Bank**
Abstract
When there is substantial doubt about an entity's ability to continue as a going concern, professional auditing standards require the independent auditor to disclose the uncertainty in the auditor's opinion. This study assesses the influence of the independent auditor's going concern evaluation by examining default following the release of the auditor's report. We use a proprietary sample maintained by the Portuguese central bank on 12,199 audit reports relating to approximately 2,000 firms that are liable by law to have their accounts audited on an annual basis. Empirical estimation of a logit model controlling for accounting cash flow related and non-accounting variables shows that the likelihood of default for firms that received going concern opinion is 2.792 times that of firms that received a clean opinion. Likelihood ratio tests for omitted variable also confirm the incremental predictive ability of going concern opinion over and above accounting and non-accounting variables for the estimation and hold-out samples. In the non-defaulting group the average default rate is 6.05% and in the defaulting group it is 17.78%. The default rate for firms in the non-defaulting group that received a going concern opinion is 9.92% and for firms that received a clean opinion is 5.96%. In the defaulting group, the rate for firms that received a going concern opinion is 35.49% and for firms that received a clean opinion is 16.96%. Checks for robustness across different asset classes, age, industries and regions indicate that firms that receive a going concern opinion on average default more than those that receive a clean opinion.
JEL classification: M42; G33; G21.
Keywords: Auditing; Bankruptcy and liquidation; Bank loans.
* Previous versions of this paper were presented at the American Accounting Association IAS mid-year meeting held at UCLA (2006) and the Illinois International Accounting Symposium held at the University of Hawai`i at Manoa (2007). We are grateful to the discussants Flora Niu (AAA) and Ling-Tai Chou (IIAS), and conference participants for their comments and suggestions. We also benefited from detailed comments made by Andrew Clare, Carl Lins, Peter Wysocki, Phil Molyneux, Raj Aggarwal and Sarkis Khoury. The views stated herein are those of the authors and are not necessarily the views of the London School of Economics, Lisbon University Institute, or the European Central Bank.
**Corresponding address: Samuel Lopes, ECB - European Central Bank Financial Supervision Postfach 16 03 19
The effectiveness of the auditor's going concern evaluation as an external governance mechanism: Evidence from loan defaults
1. Introduction
Independent auditors that have a substantial doubt about the ability of a company to continue to meet its obligations are required to disclose this uncertainty in their opinion.1
Although there has been apparent public support for the requirement to disclose going concern uncertainties in the independent audit report, there is some opposition to this on the contention that the auditor's evaluation of uncertainties is not superior to evaluations which statement users could make (Brown, 1989). However, the audit opinion may provide useful information because the independent auditor has intimate knowledge of the client’s activities and future plans (Mutchler, 1985; Menon and Schwart, 1987). The results of surveys and experiments reported in the accounting literature support the claim that statement users find the auditor's going concern disclosures valuable (Firth, 1979; Campbell and Mutchler, 1988). Recent research also recognizes the effectiveness of the auditor’s going concern opinion as an external governance mechanism (Willenborg and McKeown, 2000; Fan and Wong, 2005).
Despite the importance of going concern problems and the controversy surrounding the independent auditor's disclosure, research concerning the incremental value to market reaction to the going concern opinion is limited. Firth (1978) shows that financial markets react negatively to going concern uncertainties. Elliott (1982) and Dodd et al. (1984) find negative abnormal returns during the period surrounding the release of the auditor’s going concern opinion, but their results were not significant at statistically meaningful levels. Loudder et al. (1992) find that the market reaction to subject-to qualifications depended on the probability that the independent auditor would issue a qualified opinion. They provide separate statistics for clean and going concern opinions. Jones (1996) provides evidence on the incremental value of the going concern disclosures in the audit report to investors in financially distressed firms. He shows that mean
1 The need for such a disclosure was recognized early on by certified public accountant bodies (for example, the SAS No. 2 issued by the AICPA -
American Institute of Certified Public Accountants - in 1974). Professional accounting standards in many countries provide important guidelines for the disclosure of going concern problems (for example, the SAS No. 34 and SAS No. 59 issued by AICPA in 1981 and 1988). The requirement to disclose going concern uncertainties has been controversial in many countries. In 1982, for example, the AICPA proposed to eliminate the requirement. Strong public opposition frustrated this effort (Mann 1982). Public interest in the matter continued into the mid-1980s because situations were observed in which firms had gone bankrupt without any alert about going concern problems in their reports (Berton and Ingersoll, 1985). The AICPA responded to this by issuing standards, including SAS No. 59, which increased the responsibility of auditors in evaluating and disclosing going concern problems. In the SAS No. 34, independent auditors were not required to search for evidence relating to continued existence. But, if during auditing, certain information raised uncertainty about the ability of firms continuing to operate, auditors were required to evaluate firm status and disclose doubts about continuity of operations. In the SAS No. 59, independent auditors are required to
abnormal returns surrounding the release of the auditors’ reports were lower for going concern opinions than for clean opinions. Hopwood et al. (1989), McKee (2003) and Geiger et al. (2005) found that the independent audit opinion had incremental value in models used to predict client bankruptcies. However, to date, there is no evidence on the influence of auditor’s opinion and its incremental value in contemporary models used to predict default.
Our paper analyzes the likelihood of default for firms that received a going concern opinion (GCO) and for firms that received a clean opinion (CO). We recognize that a clean opinion (CO) - an unqualified opinion - can be viewed as a favorable evaluation of going concern status. Our study includes a sample of over 12,000 audit opinions maintained by the central bank in Portugal, a sample that is larger than any previously reported study.2 Portuguese business law imposes corporate firms to certify their accounts with a certified auditor (Revisor Oficial de Contas- ROC). Where the auditor has doubts about a firm’s ability to continue as a going concern, the professional code of conduct requires the independent auditor to disclose the uncertainty in her or his opinion. According to the rules of the chamber of ROC, independent auditors are required to proactively assess the going concern status of a client and issue a GCO opinion. The history of going concern uncertainty in Portugal has also been controversial along the lines described in the introduction but from the year 2000 onwards, the chamber of ROC recommends the adoption of the International Standard of Auditing 570.
In this paper, we first model the influence of GCO on default. This influence is analyzed within the context of a standard model used to monitor financial pressure in the corporate sector at the central bank. We then assess the incremental predictive ability of GCO over and above other accounting and non-accounting factors. We then compute expected default rates for both GCO and CO firms. In the next section we develop the hypotheses, section 3 describes the data and method used to test the hypotheses, section 4 reports the findings, and the final section provides a summary and conclusion.
2. Hypotheses and variables Going concern opinion
There are good reasons to believe that independent auditors' disclosures about going concern status are useful because these disclosures are based on extensive access to information
and managers. Professional accounting standards suggest that in assessing going concern status, independent auditors should consider labor problems, excessive reliance on a few customers, and mitigating factors such as the company's ability to cut costs, sell assets, and obtain additional credit. Some of this information, acquired by the independent auditor, may not be publicly available to investors and analysts. The independent auditor's evaluation about the going concern status of a particular firm can be indicated explicitly by a comment in the independent auditor's report, or may be indicated implicitly by a clean opinion which makes no reference to going concern uncertainties. If there is information content in the independent auditor's evaluation, one would expect a positive relation to default in light of the issuance of the GCO. A GCO is a remark made by a certified auditor that appears coupled to the annual company accounts. It does not explicitly suggest that the firm is about to default. However, it can point towards the firm’s inability to meet its debt obligations, reflecting information which is ‘not clean’ about firms’ activities thus transmitting a warning signal to creditors.
H1a: There is a positive relationship between a going concern opinion and default.
In the context of this paper, one issue is to determine whether, in practice, the independent auditor's going concern evaluation influences default is to examine the odds of default after the release of the GCO. A second issue is whether GCO has incremental predictive ability over and above established accounting and non-accounting information already used by investors and creditors. If the inclusion of GCO in a standard model of default shows statistical incremental ability in predicting default then one can conclude that it conveys information over and above other observable information.
H1b: Auditor’s going concern opinion has incremental predictive ability over and above the other accounting and non-accounting information.
Accounting controls
Although there has been extensive scholarly research on default and these studies have effectively posed and confirmed relevant propositions, one important problem remains: there is still no agreement on what accounting factors are good predictors of default and why. In general though, most studies include at least some measure of cash flow, earnings, debt, and liquidity for short and long term horizon (Dambolena and Khoury, 1980). We use predictors used by Beaver (1966), Ohlson (1980) and Dimitras et al. (1996). The theoretical concept of default is simple but the implications for the empirical content of prediction models are not clear. Pioneering research
work on default makes the assumption that default occurs whenever realized operational profits or realized plus expected operational profits are less than debt obligations. This perspective indicates that if current operating profits accurately predict future financial status, then past and present operational profit measure in terms of the level of debt obligations should be good predictors of default (Scott, 1981). Empirical studies that predict corporate failure generally include theoretically determined cash flow variables in their models (Casey and Bartczak, 1985; Gentry et al., 1985; Aziz et al., 1988).
H2a: There is a negative relationship between a cash flow to debt and default.
The more profitable the firm, the greater its capacity to raise capital on attractive terms. Firms that that do not generate positive earnings will be more constrained in raising external capital to finance their projects. It is thus desirable to generate positive earnings before interest and tax on a regular basis to meet debt obligations. The ratio of earnings before interest and tax divided by financial costs (FINANCOV) indicates the elbowroom in debt servicing in the long run (Laitinen, 1994; Laitinen and Kankaanpää, 1999).
H2b: There is a negative relationship between a financial coverage and default.
To meet debt obligations in the short-run, firms have to dispose current assets. Firms’ short-term liquidity measured as ratio of current assets to current liabilities (LIQUIDITY) indicates their ability to transform current assets into cash that can be used to meet immediate obligations. The greater the ability to transform current assets into cash the larger the capacity to settle obligations (Dambolena and Khoury, 1980).
H2c: There is a negative relationship between liquidity and default.
The level of capital is relevant since it is related not only to the level of debt, but also to the capacity of the firm to absorb losses. A high solvency ratio, measured through equity as a ratio of total assets (SOLIDITY) indicates the ability of the firm to finance assets with own equity reducing the dependence on external finance. Thus a high solvency ratio should decrease the probability of a firm entering into default (Westgaard and Wijst, 2001).
H2d: There is a negative relationship between solvability and default. Non-accounting controls
A large number of models developed to predict default use annual accounting information in the form of financial ratios in order to predict default (or failure), mainly because these are objective measures based on publicly available information. Nevertheless, the use of financial
ratios has been criticized and there are some drawbacks to default prediction on the basis of only accounting information. Models constructed on the basis of financial ratios implicitly assume that annual accounts give a fair and true view of firms’ financial situation. However, many annual accounts are unreliable and do not give a fair and true view of the firms’ financial situation. There is evidence that firms in general, and especially ones moving towards default, have incentives to manage their earnings and manipulate their annual accounts with creative accounting practices. Annual accounts close to the point of default are potentially likely to be unreliable and may result in a distorted model. However, this problem may be solved by using the previous years’ annual accounts, which we do undertake in this study. Due to these criticisms some authors include non-accounting or qualitative indicators in default prediction models (Ohlson, 1980; Zavgren, 1983; Sheppard, 1994; Becchetti and Sierra, 2002). Examples of possible non-accounting and qualitative indicators used in these studies are size and age of the firm. These two factors are assumed to capture, indirectly, some of the distributional properties of the cash flow. Both size and age are associated with safer cash flows. Compared to small and young firms, large and older firms have more bargaining power in debt restructuring. Large (measure in millions of euros) and older firms (measure in years of existence) also have more managerial resources making these firms less susceptible to idiosyncratic shocks (Bickerdyke et al., 2000).
H3a: There is a negative relationship between firm size and default. H3b: There is a negative relationship between age and default. Industry and region controls
Our main hypothesis relating to GCO is controlled not only for accounting and non-accounting influences but also for specific effects associated with industries (PRIMARY, MANUFACTURING, CONSTRUCTION, TRADE, HOSPITALITY, TRANSPORT AND COMMUNICATION and OTHERS) and regions (NORTH, LISBON, CENTRE, ALENTEJO, ALGARVE, AZORES, MADEIRA). Industry dummies are used to capture different capital intensity whereas regions are used to capture different costs of monitoring business activity (see Petersen and Rajan, 2002). The Nomenclature of Territorial Units for Statistics (NUTS) is a standard geographical code for referencing the administrative division of countries for statistical purposes. The standard is proposed by the European Union. Because of the nature of these dummy variables no hypotheses as to their influence was formulated.
The developed hypotheses are tested as a function of a binary dependence on whether a firm defaulted (1) or not (0) following the issuance of a GCO.
3. Data and method
We use a comprehensive data set for public corporations that are liable to have their accounts audited on an annual basis and maintained by the Central Bank of Portugal. The sample comprises 12,199 opinions on approximately 2,000 firms during the period 1997-2003. Almost 800 of these observations relate to firms that entered into default, representing 7% of the total. The Central Bank maintains data on approximately 16,000 firms. Firms that do not have to comply with certifying their accounts were not considered for this study. All the accounts reported up to a default are defined as accounts from a solvent firm. Only the last account of a defaulted firm is classified as a default account. The description of each firm was organized so as to generate consistent information for all firms. This yielded the date of set up, the size in millions of euros, industry code and geographic location.
The data contains annual information on credits granted by financial institutions to the corporate sector and includes an item that indicates the credit status of each loan (that is used in this study to define a loan as defaulted or non-defaulted). Loans are considered defaulted if classified (credit status) by the credit institutions with more than 90 days in arrears or when, for several reasons, are considered as doubtful despite performing, because the debt balance remains unpaid. This definition is recommended by the Basel Committee on Banking Supervision (2005). The definition includes those situations in which obligators (are past due more than 90 days on) have exceeded any of their credit obligations, or those in which, borrowers can be considered highly unlikely to meet their debts. In this way, the study defines a firm as defaulted at time “t” when any exposure (amount of debt outstanding) in the central credit register to that firm at time “t” is in default.
We removed firms with zero assets; negative sales and negative gross value-added (sum of net profit, depreciation, provisions, interest paid, taxes and salaries); short-term debt less than zero; total exposure lower than €100,000; solvency ratio larger than 100 per cent; those owned by general government or with legal form other than public (because these firms are not obliged to have their annual accounts audited). We also identified extreme observations. Some variables were transformed into logarithms and some observations were deleted (outlier and missing value
deletion) in order to comply with normality assumptions. We also considered alternative thresholds as at least 2% and 5% of the total exposure to test the definition of default, not taking residual events into account. Specifically, if the unpaid amount is less than 2% of the total credit drawn down, it is not considered to be unpaid. To improve the predictability of default, the study relates accounting data for year before “t-1” to the credit status of the firm in year “t”.
The total contents of the database are illustrated in Table 1. It can be observed that the number of GCOs decreases along the years 1997-2003. The number of defaults on the other hand shows erratic behavior. The time frame is still considered to be small for investigating the effects of macroeconomic factors on default rates. As suggested by Fan & Wong (2005) and others, the market effect of audit opinions may depend on the perceived credibility of the auditors who issue the opinions. Therefore it might be meaningful to include the audit firm type (e.g., Big 5 or non-Big 5) in the model to control for the incremental information of audit firm credibility. Unfortunately we do not have a means of distinguishing Big 5 and non-Big 5 firms. Future research should certainly address this issue.
INSERT TABLE 1 ABOUT HERE
The distribution of defaults by industry breakdown is displayed in Table 2. As the table shows, there are some significant differences in default frequencies across the industries. MANUFACTURING shows the largest number of defaults followed by TRADE and CONSTRUCTION. The distribution of defaults by geographic breakdown is displayed in Table 3. Defaults are mostly concentrated in the NORTH, CENTER and LISBON.
INSERT TABLE 2 AND 3 ABOUT HERE
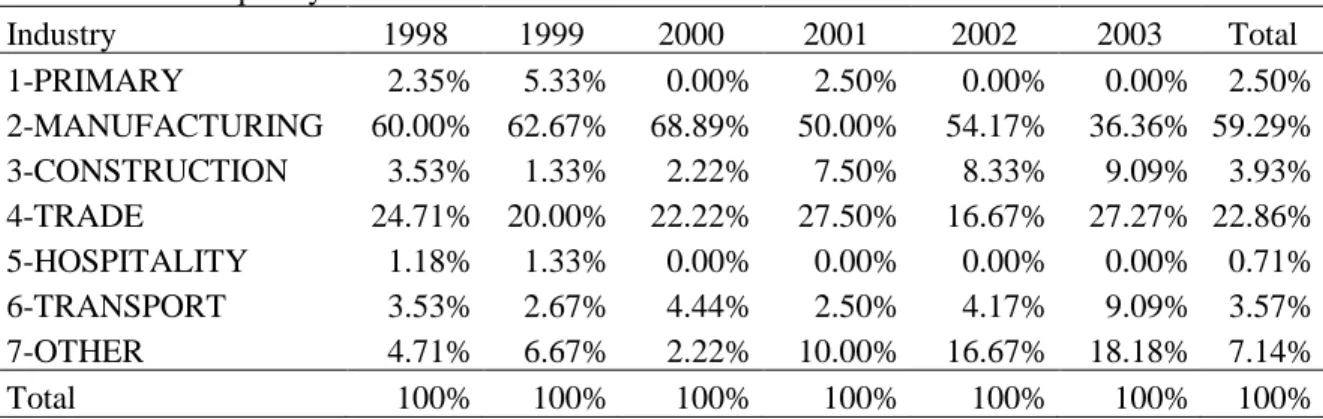
The distribution of GCOs in the sample by industry breakdown in Table 4 shows that firms in MANUFACTURING, TRADE and OTHER sectors received the largest number of GCOs. The breakdown by geographical regions in Table 5 shows that firms in the NORTH, CENTER and LISBON received the largest number of GCOs.
INSERT TABLE 4 AND 5 ABOUT HERE
Differences between defaulting and non-defaulting firms for 1997-2002, broken down by default variable in 1998-2003, can be read from Table 6. The average for GCO in the non-defaulting group is less than the average for the non-defaulting group. Insofar as accounting variables
are concerned, the default group shows higher ratios for all variables. Surprisingly the non-default group shows lower age. The proportion of firms in the non-defaulting group in MANUFACTURING is higher than the non-defaulting group. The situation is the opposite in TRADE and OTHER sectors. In terms of regions the proportion is fairly similar.
INSERT TABLE 6 ABOUT HERE
Our objective is to empirically examine the hypotheses formulated in section 2. We thus specify an empirical model on the basis of those hypotheses, estimate the model’s coefficients and test whether the sign and significance of the coefficients result in accepting or rejecting the hypotheses. These requirements rule out the use of a large number of financial ratios in combination with a search technique. We use logit analysis to estimate the influence of the above-mentioned variables on the probability of default.
The model is estimated using the SAS software package, adopting a procedure that estimates a binary logit model via maximum likelihood. Estimates of default probabilities are produced for the overall model. The quality of the forecast is evaluated with the concept of receiver operating characteristic-curve for which we report the accuracy ratio. We first also perform out-of-sample validation. We develop one model from the 1998-2003 training set (with 50% partition) and test this model on the 1998-2003 out-of-sample set. The training data set was used for preliminary model fitting. The validation data set was used to monitor and tune the model weights during estimation and was also used for model assessment. We used a stratified random sampling in order to maintain the same number of defaults to create partitioned data sets. 4. Empirical findings
The results of the logit analysis specified in the previous section are summarized in Table 7, where the variables are defined as above. In this table, GCO shows the expected positive relationship with default at the 1% level of significance. The odds ratio tells us that the predicted odds of default for firms that received a GCO is 2.792 times the predicted default for firms that received a CO. Thus, we do not reject our main hypothesis (H1). We also computed -2 log-likelihood of the model with (5,381) and without GCO (5,386). The likelihood ratio statistic is the difference between the -2 log-likelihood of each model with and without the omitted variable. We compare this difference (5.00) with the critical value from the chi-squared distribution with 1 degree of freedom (model without GCO to get the model with GCO). Thus, we have our chi
-square statistic (x2 = 5.00), our predetermined alpha level of significance (0.05), and the degrees of freedom (1, model without GCO to get the model with GCO). In a chi-square distribution table with 1 degree of freedom we can see that x2 =5.00 lies between 3.841 and 5.412. The corresponding probability is 0.05<p<0.02. This is smaller than the conventionally accepted significance level of 0.05 or 5%; so the null hypothesis that the two distributions are similar is rejected. In other words, since our x2 statistic =5.00 exceeds the critical value for a 0.05 probability level (3.841), we can reject the null hypothesis that the observed values of our x2have the same theoretical distribution. A similar analysis for the hold-out-sample led to similar conclusion. This allows us to conclude that GCO has, in statistical terms, an incremental effect on our basic model of default (at the level of 5% level of significance). Thus, we can not reject H1b.
INSERT TABLE 7 ABOUT HERE
The accounting controls CASHDEBT, FINANCOV, LIQUIDITY and SOLIDITY, are as expected negatively related to default at the 1% level of significance, not allowing us to reject H2 (a-d). SIZE is also negatively related to default as expected and significantly so at a 1% level of significance. This relationship also does not allow us to reject H3a. Surprisingly the relationship between AGE and default is positive and significantly so at a 1% level of significance. This relationship contradicts the sign we expected, not allowing us to confirm H3b. However, the magnitude of the coefficient is small (0.009) and the odds ratio is close to 1 (1.009). Nevertheless, one possible explanation could be that older firms are engaged in traditional sectors such as textile manufacturing which in recent years started facing competitive pressures in international markets from firms originating in China and India. Table 8 illustrates this point, showing default company distribution by age categories.
INSERT TABLE 8 ABOUT HERE
Almost all industry dummies show a positive relationship with default (compared to OTHER sectors). PRIMARY, TRADE and TRANSPORT are not significant at any statistically meaningful level, and MANUFACTURING and CONSTRUCTION are significant at the 1% level. Compared to the remaining sectors, predicted odds of default are higher in these sectors, 2.938 and 2.751, respectively. TRADE (2.289) and TRANSPORT (1.928) have lower odds of default compared to the aforementioned sectors. Compared to these sectors HOSPITALITY
shows the lowest predicted odd of default (1.027). The results for region dummies are rather poor. With the exception of ALENTEJO and CENTER which are, respectively positively and negatively related to default at the 1% and 5% level of significance (compared to MADEIRA) none of the dummies shows a statistically significant result at any meaningful level. The predicted odds of firms from ALENTEJO are 1.597 times the predicted odds of default in other regions. This is also a region that has been subject of most desertification.
The quality of the forecast was evaluated using the concept of receiver operating characteristic curve. Table 9 shows that the area under the curve is 75% for the estimation sample and 77% for the hold-out-sample (with 50% partition) firms. The area below the curve has probabilistic significance and indicates the probability that any defaulting firm picked at random from the population will have an estimated score which is greater than that of any other non-defaulting firm selected at random.
INSERT TABLE 9 ABOUT HERE
We show the model’s predictive power by applying the model to the hold-out-sample. The results are given separately for the groups of defaulting and non-defaulting firms in Table 10. The hold-out-sample consists of 5,689 non-defaulting firms and 411 defaulting firms. The model shows a good capacity to discriminate between defaulting and non-defaulting firms. The average default rate is almost three times for the default sample (17.78%) when compared with the non-default sample (6.05%). The variations in the non-default probabilities of the non-non-defaulting firms are also lower than the variations in the default probabilities of the defaulting sample. Few non-defaulting firms still get a very high default probability (92.37% is maximum) and a few defaulting firms get very low default probabilities (0.19% is minimum). In table 11, to supplement the above analysis we also show the error type I, broken down by 4 expected default frequency categories.
INSERT TABLE 10 AND 11 ABOUT HERE
Partitioning the sample by GCO and CO in Table 12 shows that in the non-defaulting group the average default rate for firms that receive a GCO is 9.92% and for the ones that get a CO it is 5.96%. In the defaulting group the average default rate for firms that receive a GCO is 35.49% and for the ones that get a CO it is 16.96%. For firms that receive a GCO (in comparison
to firms that received a CO) the standard deviation is 2.16% higher in the non-defaulting group and 6.18% higher in the defaulting group. These results from out-of-sample validation indicate a strong relationship between default and the variables used in the model. We also include test results of significant difference between the CO and GCO groups. In both samples, the probability of the Kolmogorov-Smirnov Z statistic falls well below 5%. By that standard, the distributions of the two groups (CO and GCO) are significantly different from each other. Default rates for different asset sizes for total sample are shown in Table 13. It can be observed that default rates are systematically higher for firms that receive a GCO. Surprisingly though, default rates tend to increase with size.
INSERT TABLE 13 ABOUT HERE
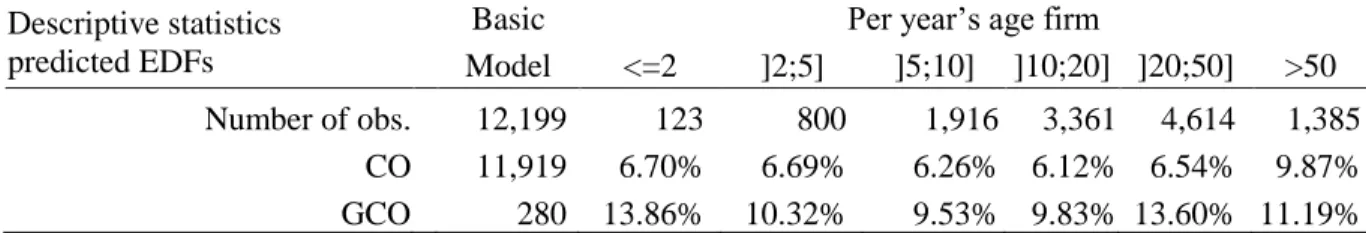
Cross tabulation by age in Table 14 continues to show higher default rates for the group of firms that receive a GCO. However, unlike size, default rates for the group of firms that received a CO remain relatively stable for different age groups. For the group of firms that receives a GCO, default rates reduce with increasing age.
INSERT TABLE 14 ABOUT HERE
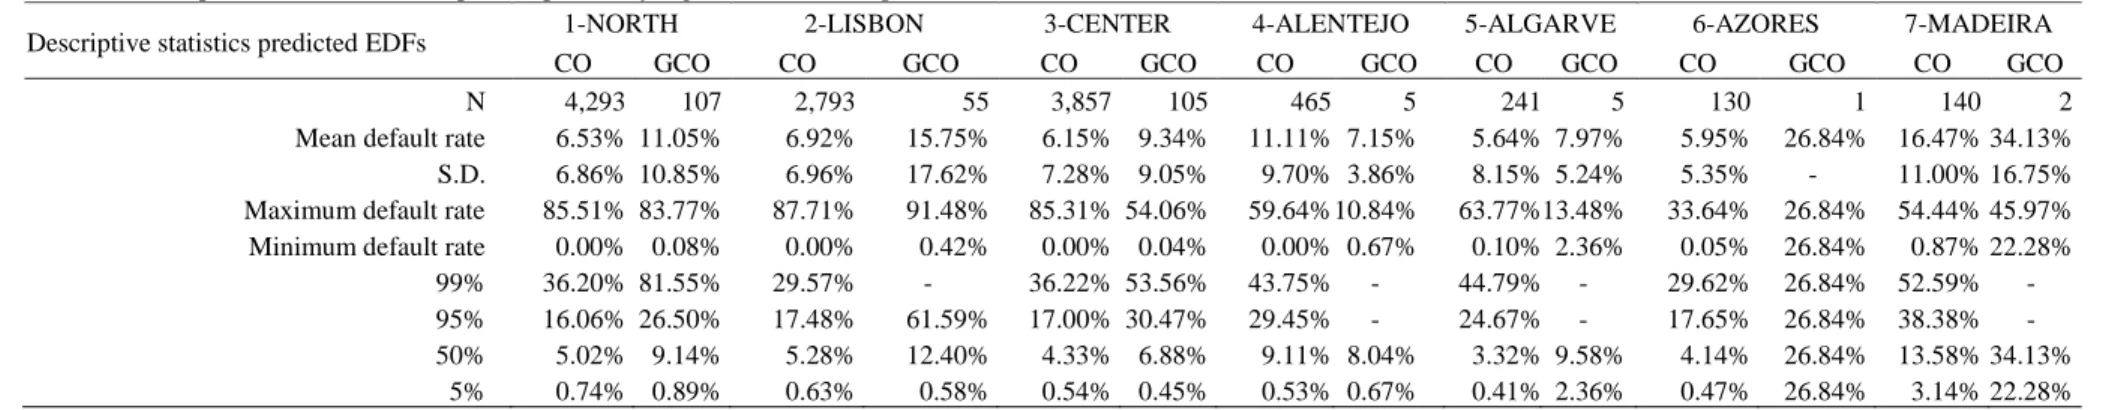
In Table 15 we tabulate the default rates across different sectors. With the exception of HOSPITALITY, the group of firms that received a GCO shows higher default rates. Standard deviation of these default rates is also higher for firms that received a GCO. PRIMARY, MANUFACTURING and CONSTRUCTION show larger differences in predicted default rates between firms that receive a GCO and a CO. Differences in other sectors are relatively small. In the tabulation for regions (Table 16) we observe that in ALENTEJO default rates for firms that receive a GCO are lower than the group of firms that received a CO. NORTH, LISBON, AZORES and MADEIRA show larger differences between firms that receive a GCO and firms that receive a CO. The findings reported here suggest that the information conveyed by the GCO is relevant across different tabulations suggesting that banks can effectively rely on the auditor’s opinion to predict default.
To check the robustness of our findings, we employed a dummy variable to verify a potential structural break for the introduction of the ISA 570. However, the dummy did not turn out to be significant. One possible explanation is that the auditors adopted the ISA 570 normative before its legal implementation. Geiger et al. (2005) found that auditors were more likely to issue prior going-concern modified audit opinion in the post-Enron era of 2002-03 than in the earlier 1991-1992 recession recovery period and less likely to have issued prior going-concern modified audit reports for bankrupt companies after the Reform Act of 1995. The current research used data from 1997 to 2003 in Portuguese Central Bank. Our data set spans the period 1997-2003. If data spanning the post-Enron period becomes available then it would certainly be desirable to analyze this issue in more detail. Overall, we cannot reject our main hypothesis relating to the influence of the auditor’s GCO on default (H1a), the incremental predictive ability of GCO, our hypotheses relating to the influence of accounting factors on default (H2a-H2d) and our hypothesis relating to the influence of size of firm on default (H3a).
5. Conclusions
The paper contributes to the existing literature on informational content conveyed by the auditor’s GCO. It indicates that firms that receive a GCO are more likely to default in comparison to firms that receive a CO. The paper provides estimates of the odds of default for firms that receive a GCO. Further, the paper shows that GCO has incremental predictive ability over and above standard accounting and non-accounting factors that enable default prediction. Additionally, it documents default rates for firms that receive a GCO and firms that receive a CO across different asset classes, age of firms and industry and regions. Consistent with our expectation, firms that receive a GCO show higher default rates.
The analysis is embedded in the contemporary literature that explains default on the basis of accounting and non-accounting data. As suggested by the theory, the study finds that high levels of indebtedness, low financial coverage, liquidity and solvability increase the likelihood of default. Larger firms are also less likely to enter into default but, surprisingly, age is positively related to default.
Auditing standards which have required independent auditors to disclose the going concern uncertainty have been controversial. Some have argued that the disclosure provides little information to users. The primary purpose of our study was to determine whether the
independent auditor's going concern evaluation had information content by examining whether firms default following issuance of a GCO and whether GCO carries incremental predictive ability. Previous studies (Firth, 1978; Elliott, 1982; Dodd et al., 1984) do not find a significant reaction to the GCO. This could be interpreted as an indication that there is little information content in the independent auditor's going concern disclosure, and that the controversial requirement for the disclosure should be abandoned. But the study by Jones (1996) shows that the extent of the abnormal returns surrounding the release of the auditor's report depended on the probability that a GCO would be received. He argues that the release of information in the 10-K concerning default or debt restructuring was also found to influence the market reaction. Thus, it is important to control for the influence of such information in default prediction which we confirm in our study. Overall, the results of our study provide additional support for the continuation of the requirement to disclose going concern uncertainties in the audit report. It also suggests that the independent auditor's going concern evaluation can reduce the opacity of financial statements that investors and creditors use to predict default.
References
American Institute of Certified Public Accountants (AICPA). 1974. Statement on Auditing Standards No. 2: Reports on Audited Financial Statements. New York: American Institute of Certified Public Accountants.
American Institute of Certified Public Accountants (AICPA). 1978. Commission on Auditors' Responsibilities (Cohen Commission). Report, Conclusions, and Recommendations. New York: American Institute of Certified Public Accountants.
American Institute of Certified Public Accountants (AICPA). 1981. Statement on Auditing Standards No. 34: The Auditor's Consideration When a Question Arises About an Entity's Continued Existence. New York: American Institute of Certified Public Accountants.
American Institute of Certified Public Accountants (AICPA). 1988. Statement on Auditing Standards No. 59: The Auditor's Consideration of an Entity's Ability to Continue as a Going Concern. New York: American Institute of Certified Public Accountants.
Aziz, A., D. Emanuel, and G. Lawson. 1988. “Bankruptcy prediction – an investigation of cash flow based models”. Journal of Management Studies, (25): 419-437.
Basel Committee on Banking Supervision. 2005. Basel II: International Convergence of Capital Measurement and capital standards - A revised framework. Basel: Bank for International Settlements.
Beaver, W. 1966. “Financial ratios as predictors of failure”. Journal of Accounting Research, Supplement on Empirical Research in Accounting, (4): 71-111.
Bechetti, L., and J. Sierra. 2002. “Bankruptcy risk and productive efficiency in manufacturing firms”. Journal of Banking and Finance, (27): 2099-2120.
Berton, L., and B. Ingersoll. 1985. “Rep. Dingell to take aim at accountants, SEC in hearings on profession's role as a watchdog”. The Wall Street Journal, 205 (34): 4.
Bickerdyke, I., R. Lattimore R., and A. Madge. 2000. Business Failure and Change: An Australian Perspective. Ausinfo, Camberra: Productivity Commission Staff Research Paper.
Brown, H. 1989. “Should 'going concern' be auditor's headache”. Accounting Today, (3): 4.
Campbell, J., and J. Mutchler. 1988. “The "expectations gap" and going-concern uncertainties”. Accounting Horizon, (2): 42-49.
Casey, C., and N. Bartczak. 1985. “Using operating cash flow data to predict financial distress: some extensions”. Journal of Accounting Research, (23): 384-401.
Dambolena I., S. Khoury. 1980. “Ratio stability and corporate failure”. Journal of Finance, (33): 1017-1026.
Dimitras, A., S. Zanakis, and C. Zopounidis. 1996. “A survey of business failures with an emphasis on prediction methods and industrial applications”. European Journal of Operating Research, (90): 487-513.
Dodd, P., N. Dopuch, R. Holthausen, and R. Leftwich. 1984. “Qualified audit opinions and stock prices: Information content, announcement dates and concurrent disclosures”. Journal of Accounting and Economics, (6): 3-38.
Elliott, J. 1982. “"Subject to" audit opinions and abnormal security returns-outcomes and ambiguities”. Journal of Accounting Research, (20): 617-638.
Fan, J. and T. Wong. 2005. “Do external auditors perform a corporate governance role in emerging markets? Evidence from East Asia”. Journal of Accounting Research, (43): 35-72.
Ferguson, A., J. Francis, and D. Stokes. 2003. “The effects of firm- wide and office- level industry expertise on audit pricing”. The Accounting Review, (78): 429-448.
Firth, M. 1978. “Qualified audit reports: Their impact on investment decisions”. The Accounting Review, (53): 642-650.
Firth, M. 1979. “Qualified audit reports and bank lending decisions”. Journal of Bank Research, (9): 237-241.
Geiger, M., K. Raghunandan, D. V. Rama. 2005. “Recent changes in the association between bankruptcies and prior audit opinions”. Auditing: A Journal of Theory and Practice, (24): 21-35.
Gentry, J. A., P. Newbold, and D. Whitford. 1985. “Classifying bankrupt firms with funds flow components”. Journal of Accounting Research, (23): 146-160.
Hopwood, W., J. McKeown, and J. Mutchler. 1989. “A test of the incremental explanatory power of opinions qualified for consistency and uncertainty”. The Accounting Review, (64): 28-48.
Jones, F. 1996. “The information content of the auditor's going concern evaluation”. Journal of Accounting and Public Policy, (15): 1-27.
Khanna, K., K. Palepu, and S. Srinivasan. 2004. “Disclosure Practices of Foreign Companies Interacting with U.S. Markets”. Journal of Accounting Research, (42): 75–508.
Laitinen, E. K. 1994. “Traditional versus operating cash flow in failure prediction”. Journal of Business Finance and Accounting, (21): 195-217.
Laitinen, T., and M. Kankaanpää. 1999. “Comparative analysis of failure prediction methods: The Finnish case”. The European Accounting Review, (8): 67-92.
Loudder, M., I. Khurana, R. Sawyers, C. Cordery, C. Johnson, J. Lowe, and R. Wunderle. 1992. “The information content of audit qualifications”. Auditing: A Journal of Practice and Theory, (11): 69-82.
Mann, A.1982. “Special report - ASB public meeting on "subject-to" opinion”. Journal of Accountancy, (154): 10-14.
McKee, T. 2003. “Rough sets bankruptcy prediction models versus auditor signalling rates”. Journal of Forecasting, (22): 569-586.
Menon, K. and K. Schwartz. 1987. “An empirical investigation of audit qualification decisions in the presence of going concern uncertainties”. Contemporary Accounting Research, (3): 302-315.
Mutchler, J. 1985. “A multivariate analysis of the auditor's going-concern opinion decision”. Journal of Accounting Research, (23): 668-682.
Ohlson, J. 1980. “Financial ratios and the probabilistic prediction of bankruptcy”. Journal of Accounting Research, (18): 109-131.
Petersen, M. and R. Rajan. 2002. “Does distance still matter? The information revolution in small business lending”. Journal of Finance, (57): 2533-2570.
Scott, J. 1981. “The probability of bankruptcy: A comparison of empirical predictions and theoretic models”. Journal of Banking and Finance, (5): 317-344.
Sheppard, J. 1994. “Strategy and bankruptcy: An exploration into organizational death”. Journal of Management, (20): 795-833.
Westgaard, S., and N. Wijst. 2001. “Default probabilities in a corporate bank portfolio: A logistic model approach”. European Journal of Operational Research, (135): 338-349.
Willenborg, M. and J. McKeown. 2000. “Going-concern initial public offerings”. Journal of Accounting and Economics, (30): 279-313.
Zavgren, C. 1983. “The prediction of corporate failure: The state of the art”. Journal of Accounting Literature, (2): 1-37.
Table 1 GCOs , defaults and accounts 1997-2003 Year Number of GCOs Number of defaults Number of accounts Default frequency 1997 85 - 1,881 - 1998 75 131 1,942 6.96% 1999 45 115 1,826 5.92% 2000 40 102 2,192 5.59% 2001 24 180 2,166 8.21% 2002 11 150 2,192 6.93% 2003 - 144 6.57% Total 280 822 12,199 6.74%
Table 2 Default frequency in various industries 1998-2003
Industry 1998 1999 2000 2001 2002 2003 Total 1-PRIMARY 7.63% 7.83% 7.84% 2.22% 4.00% 2.78% 4.99% 2-MANUFACTURING 67.18% 66.09% 61.76% 52.78% 59.33% 52.78% 59.25% 3-CONSTRUCTION 11.45% 12.17% 12.75% 11.11% 6.00% 9.72% 10.34% 4-TRADE 6.87% 5.22% 7.84% 20.00% 15.33% 13.19% 12.29% 5-HOSPITALITY 0.76% 1.74% 4.90% 2.22% 2.67% 1.39% 2.19% 6-TRANSPORT 5.34% 6.09% 2.94% 3.33% 4.67% 4.17% 4.38% 7-OTHER 0.76% 0.87% 1.96% 8.33% 8.00% 15.97% 6.57% Total 100% 100% 100% 100% 100% 100% 100%
Table 3 Default frequency in various geographical regions 1998-2003
Geography 1998 1999 2000 2001 2002 2003 Total 1-NORTH 38.17% 37.39% 32.35% 34.44% 34.00% 36.81% 35.52% 2-LISBON 23.66% 26.96% 24.51% 23.33% 26.67% 22.92% 24.57% 3-CENTER 26.72% 22.61% 29.41% 33.89% 30.67% 34.03% 30.05% 4-ALENTEJO 5.34% 7.83% 10.78% 6.11% 7.33% 2.08% 6.33% 5-ALGARVE 2.29% 2.61% 1.96% 1.67% 0.67% 1.39% 1.70% 6-AZORES 2.29% 1.74% 0.98% 0.56% 0.67% 0.00% 0.97% 7-MADEIRA 1.53% 0.87% 0.00% 0.00% 0.00% 2.78% 0.85% Total 100% 100% 100% 100% 100% 100% 100%
Table 4 GCO frequency in various industries 1998-2003 Industry 1998 1999 2000 2001 2002 2003 Total 1-PRIMARY 2.35% 5.33% 0.00% 2.50% 0.00% 0.00% 2.50% 2-MANUFACTURING 60.00% 62.67% 68.89% 50.00% 54.17% 36.36% 59.29% 3-CONSTRUCTION 3.53% 1.33% 2.22% 7.50% 8.33% 9.09% 3.93% 4-TRADE 24.71% 20.00% 22.22% 27.50% 16.67% 27.27% 22.86% 5-HOSPITALITY 1.18% 1.33% 0.00% 0.00% 0.00% 0.00% 0.71% 6-TRANSPORT 3.53% 2.67% 4.44% 2.50% 4.17% 9.09% 3.57% 7-OTHER 4.71% 6.67% 2.22% 10.00% 16.67% 18.18% 7.14% Total 100% 100% 100% 100% 100% 100% 100%
Table 5 GCO frequency in various geographical regions 1998-2003
Geography 1998 1999 2000 2001 2002 2003 Total 1-NORTH 37.65% 38.67% 40.00% 32.50% 41.67% 45.45% 38.21% 2-LISBON 20.00% 20.00% 22.22% 20.00% 16.67% 9.09% 19.64% 3-CENTER 36.47% 36.00% 31.11% 45.00% 41.67% 45.45% 37.50% 4-ALENTEJO 2.35% 2.67% 2.22% 0.00% 0.00% 0.00% 1.79% 5-ALGARVE 1.18% 2.67% 4.44% 0.00% 0.00% 0.00% 1.79% 6-AZORES 1.18% 0.00% 0.00% 0.00% 0.00% 0.00% 0.36% 7-MADEIRA 1.18% 0.00% 0.00% 2.50% 0.00% 0.00% 0.71%
Table 6 Default and non-default sample ratios Average figures 1997-2002 Non-default sample 1998-2003 Default sample 1998-2003 GCO 2.18% 3.89% Accounting controls CASHDEBT 71.75% 1.02% FINANCOV 27.20 15.25 LIQUIDITY 4.02 2.11 SOLIDITY 32.89% 18.13% Non-accounting controls SIZE 4.16 3.79 AGE 24.48 28.44 Industry Dummies 1-PRIMARY 4.36% 4.99% 2-MANUFACTURING 46.19% 59.25% 3-CONSTRUCTION 10.18% 10.34% 4-TRADE 21.73% 12.29% 5-HOSPITALITY 2.56% 2.19% 6-TRANSPORT 4.68% 4.38% 7-OTHER 10.31% 6.57% Region Dummies 1-NORTH 36.11% 35.52% 2-LISBON 23.26% 24.57% 3-CENTER 32.65% 30.05% 4-ALENTEJO 3.67% 6.33% 5-ALGARVE 2.04% 1.70% 6-AZORES 1.08% 0.97% 7-MADEIRA 1.19% 0.85%
Table 7 Estimation results of the LOGIT model Variables B S.E. Wald Chi-squares p- value Exp(B) GCO 0.513 0.113 20.57 0.000 2.792 Accounting controls CASHDEBT -0.397 0.092 18.81 0.000 0.672 FINANCOV -0.374 0.118 9.96 0.002 0.688 LIQUIDITY -0.197 0.100 3.86 0.050 0.821 SOLIDITY -2.195 0.239 84.42 0.000 0.111 Non-accounting controls SIZE -1.412 0.205 47.41 0.000 0.244 AGE 0.009 0.002 13.83 0.000 1.009 Industry dummies 1-PRIMARY 0.122 0.228 0.29 0.592 2.102 2-MANUFACTURING 0.457 0.109 17.72 0.000 2.938 3-CONSTRUCTION 0.392 0.157 6.22 0.013 2.751 4-TRADE 0.207 0.171 1.47 0.225 2.289 5-HOSPITALITY -0.594 0.307 3.74 0.053 1.027 6-TRANSPORT 0.036 0.215 0.03 0.867 1.928 Region dummies 1-NORTH -0.166 0.132 1.58 0.209 0.784 2-LISBON -0.035 0.144 0.06 0.811 0.893 3-CENTER -0.268 0.132 4.12 0.042 0.707 4-ALENTEJO 0.546 0.214 6.53 0.011 1.597 5-ALGARVE -0.184 0.354 0.27 0.603 0.769 6-AZORES 0.029 0.393 0.01 0.942 0.952 Log likelihood 5,711
Cox & Snell R2 0.619
Nagelkerke R2 0.824
Hosmer-Lemeshow 40,195
GCO: Going Concern Opinion [dummy: 0=CO (Clean Opinion); 1=GCO] CASHDEBT: Cash Flow to Debt (realized operational profits/debt obligations) FINANCOV: Financial Coverage (earnings before interest and tax/financial costs) LIQUIDITY: Liquidity (current assets/current liabilities)
SOLIDITY: Solvability (equity/total assets) SIZE: Total Assets (log millions of euros) AGE: Years of existence
Table 8 Default frequency in various industries 1998-2003, by age
Industry Per year’s age firm
<=2 ]2;5] ]5;10] ]10;20] ]20;50] >50 Total 1-PRIMARY 16.67% 2.78% 5.61% 4.15% 6.27% 2.92% 4.99% 2-MANUFACTURING 33.33% 41.67% 45.79% 57.14% 62.07% 72.26% 59.25% 3-CONSTRUCTION 0.00% 8.33% 8.41% 8.76% 13.79% 7.30% 10.34% 4-TRADE 50.00% 22.22% 19.63% 15.21% 8.15% 7.30% 12.29% 5-HOSPITALITY - 2.78% 0.93% 2.30% 2.51% 2.19% 2.19% 6-TRANSPORT - 8.33% 7.48% 3.69% 3.76% 3.65% 4.38% 7-OTHER - 13.89% 12.15% 8.76% 3.45% 4.38% 6.57% Total 100% 100% 100% 100% 100% 100% 100%
Table 9 Area under the ROC-curve
N Area Std. Error 95% Confidence Interval
Lower Upper Total sample With GCO 12,199 0.750 0.009 0.732 0.769 Without GCO 12,199 0.743 0.010 0.724 0.762 Hold-out-sample With GCO 6,100 0.765 0.013 0.739 0.791 Without GCO 6,100 0.759 0.013 0.733 0.785
Table 10 Descriptive statistics for default and non-default hold-out-sample Descriptive statistics predicted EDFs Non-default 1998-2003 Default 1998-2003 N 5,689 411
Mean default rate 6.05% 17.78% Standard deviation 6.51% 19.11% Maximum default rate 92.37% 95.21% Minimum default rate 0.00% 0.19% 99% 31.72% 91.03% 95% 16.66% 66.41% 50% 4.40% 11.27% 5% 0.43% 1.43%
Table 11 Error Classification
Observed Predicted
EDFs N default Non-Default Default
(error type I) (correct)
100-75 19 13 0 13 (100%)
74-50 26 18 0 18 (100%)
49-25 135 54 1 (1.9%) 53 (98.1%)
24-0 5,920 326 79 (24.2%) 247 (75.8%)
Table 12 Descriptive statistics default and non-default hold-out-sample, by GCO Descriptive statistics predicted EDFs Non-default 1998-2003 Default 1998-2003 CO GCO CO GCO N 5,572 117 393 18
Mean default rate 5.96% 9.92% 16.96% 35.49%
S.D. 6.43% 8.59% 18.45% 24.63% Predicted probability Non-default Predicted probability Default Most Extreme Differences Absolute .289 .248 .541 .222 Positive .289 .118 .541 .143 Negative -.037 -.248 .000 -.222 Kolmogorov-Smirnov Z 3.096 2.653 2.245 .922
Table 13Mean default rate total sample companies, by size vs auditor’s opinion Descriptive statistics
predicted EDFs
Basic Per total assets (million euros)
Model <=0,5 ]0,5;1,5] ]1,5;5] ]5;10] ]10;50] >50 Number of obs. 12,199 112 809 3,555 2,729 3,671 1,323
CO 11,919 5.22% 5.39% 5.85% 6.92% 7.19% 8.75% GCO 280 9.68% 6.64% 11.81% 13.25% 10.19% 12.03%
Table 14 Mean default rate total sample companies, by age vs auditor’s opinion Descriptive statistics
predicted EDFs
Basic Per year’s age firm
Model <=2 ]2;5] ]5;10] ]10;20] ]20;50] >50 Number of obs. 12,199 123 800 1,916 3,361 4,614 1,385
CO 11,919 6.70% 6.69% 6.26% 6.12% 6.54% 9.87% GCO 280 13.86% 10.32% 9.53% 9.83% 13.60% 11.19%
Table 15 Descriptive statistics total sample companies, by sector vs auditor’s opinion
Descriptive statistics predicted EDFs 1-PRIMARY 2-MANUFACTURING 3-CONSTRUCTION 4-TRADE
5-HOSPITALITY 6-TRANSPORT 7-OTHER
CO GCO CO GCO CO GCO CO GCO CO GCO CO GCO CO GCO
N 530 7 5,576 166 1,232 11 2,509 64 307 2 558 10 1,207 20
Mean default rate 7.59% 10.67% 8.31% 14.35% 6.78% 13.73% 3.87% 6.07% 5.86% 0.63% 6.33% 6.53% 5.75% 6.87%
S.D. 7.24% 9.21% 8.00% 13.50% 5.08% 7.94% 5.09% 9.01% 9.49% 0.01% 7.30% 6.63% 7.66% 3.46%
Maximum default rate 79.67% 22.23% 87.71% 91.48% 59.81% 36.55% 85.31% 45.97% 71.80% 0.64% 82.49% 18.11% 79.70% 13.48%
Minimum default rate 0.10% 0.95% 0.00% 0.06% 0.04% 6.17% 0.00% 0.08% 0.05% 0.62% 0.01% 0.04% 0.00% 1.05%
99% 31.43% - 39.61% 86.31% 26.80% - 20.95% - 55.98% - 37.92% - 40.75% -
95% 20.60% - 20.93% 41.26% 16.23% - 9.60% 31.34% 25.31% - 18.23% - 16.72% 13.40%
50% 5.67% 14.67% 6.59% 12.13% 5.75% 12.76% 2.86% 3.22% 2.17% 0.63% 4.36% 4.69% 3.62% 6.30%
5% 1.28% 0.95% 1.05% 1.54% 1.70% 6.17% 0.24% 0.23% 0.44% 0.62% 0.46% 0.04% 0.38% 1.13%
Table 16 Descriptive statistics total sample companies, by region vs auditor’s opinion
Descriptive statistics predicted EDFs 1-NORTH 2-LISBON 3-CENTER 4-ALENTEJO 5-ALGARVE 6-AZORES 7-MADEIRA
CO GCO CO GCO CO GCO CO GCO CO GCO CO GCO CO GCO
N 4,293 107 2,793 55 3,857 105 465 5 241 5 130 1 140 2
Mean default rate 6.53% 11.05% 6.92% 15.75% 6.15% 9.34% 11.11% 7.15% 5.64% 7.97% 5.95% 26.84% 16.47% 34.13%
S.D. 6.86% 10.85% 6.96% 17.62% 7.28% 9.05% 9.70% 3.86% 8.15% 5.24% 5.35% - 11.00% 16.75%
Maximum default rate 85.51% 83.77% 87.71% 91.48% 85.31% 54.06% 59.64% 10.84% 63.77% 13.48% 33.64% 26.84% 54.44% 45.97% Minimum default rate 0.00% 0.08% 0.00% 0.42% 0.00% 0.04% 0.00% 0.67% 0.10% 2.36% 0.05% 26.84% 0.87% 22.28%
99% 36.20% 81.55% 29.57% - 36.22% 53.56% 43.75% - 44.79% - 29.62% 26.84% 52.59% -
95% 16.06% 26.50% 17.48% 61.59% 17.00% 30.47% 29.45% - 24.67% - 17.65% 26.84% 38.38% -
50% 5.02% 9.14% 5.28% 12.40% 4.33% 6.88% 9.11% 8.04% 3.32% 9.58% 4.14% 26.84% 13.58% 34.13%