277
Vol.55, n. 2: pp.277-282, March-April 2012
ISSN 1516-8913 Printed in Brazil BRAZILIAN ARCHIVES OF
BIOLOGY AND TECHNOLOGY
A N I N T E R N A T I O N A L J O U R N A L
Comparison of Diversity Indices Applied to Macrophyte
Incidence-Based Data
Heloísa Beatriz Antoniazi Evangelista
1, Sidinei Magela Thomaz
1*and Luiz Roberto
Evangelista
21Departamento de Biologia; Universidade Estadual de Maringá; Av. Colombo, 5790; Maringá - PR - Brasil. 2Universidade Estadual de Maringá; Departamento de Física; Av. Colombo, 5790; Maringá - PR - Brasil
ABSTRACT
In this work, a recently proposed diversity index based on Patil and Taillie parametric diversity measure (or Tsallis entropy), Sq*, was applied to samples (presence-absence data) of macrophytes from the Itaipu Reservoir, Brazil. This new index was the value of the family of indices Sq for a specific evenness of a sample. Results demonstrated that the Shannon index and species richness showed expressively high correlation with the Sq*; however, the evenness had low correlation coefficients with the index Sq*, indicating that Sq* was particularly sensitive to rarity and species richness. On the other hand, the weak correlations of this index with evenness demonstrated that it was less sensitive to species relative abundances.
Key words: Tsallis entropy, macrophytes, reservoir, Shannon, Simpson
*Author for correspondence: [email protected]
INTRODUCTION
The application of diversity indices is common in ecological analyses (Izsák 2007). Besides this, the concept of biological diversity is a central issue in quantitative ecology that has been studied extensively for over 50 years (Patil and Taillie 1982; Magurran 1988). Several indices have been created to measure the diversity of species; however, the most widely used in the last decades are the Shannon (1948) and Simpson (1949) (Buzas and Hayek 1996; Gorelick 2006), with the
components of diversity: richness (S) and evenness
(J). However, there is controversy about what
index should be used in each community. The main reason for this confusion is that the diversity indices combine in non-standard way two independent attributes of communities, the number of species and their relative abundances (called
evenness or equitability) (Ricotta 2003). Simpson
(D) diversity is a good measure of dominance, but
is not a good species richness predictor.
Shannon-Wiener index (H) is an intermediate measure
which balances both diversity attributes (Melo 2008).
In this context, another type of index that has been recently studied is Sq*, which is based on the parametric diversity measure proposed by Patil and Taillie (1982) and its corresponding evenness. The purpose of this index is to balance the rarity with evenness, giving a biological apparatus to better understanding of diversity in biological communities. In this investigation we used a long term (eight years) dataset on the incidence (presence-absence) of macrophytes in the Itaipu
Reservoir-Brazil to evaluate the Sq*. Results were
compared with other more traditional indices, such
as H and D. This type of analysis has been rarely
used in studies of aquatic environments and, therefore, this work might offer a contribution to improve the possibilities of using new indices and the understanding of patterns of diversity in these environments.
Study Area
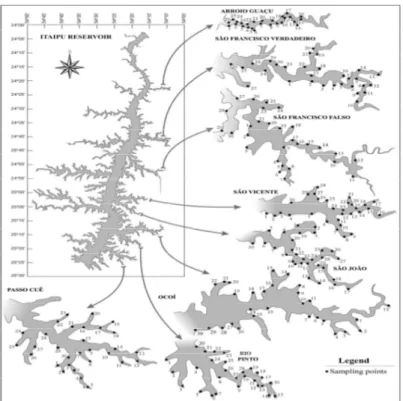
This investigation was carried out in the Itaipu Reservoir-Brazil, located on the Paraná River which is the second-largest drainage basin in South America. Eight arms of the Itaipu
Reservoir-Brazil (24o05’S and 54o00’W; 25o33’S
and 54o37’W) which has 1,350 km2 were
surveyed.
MATERIALS AND METHODS
Samples were taken at approximately every six months between April 1999 and January 2007, in 235 stands distributed in eight arms in the Brazilian (east) side of the reservoir. In each stand, the incidence of macrophytes was monitored using a standardized sampling effort which consisted of searches carried out by three people in a boat at low speed and using a rake to verify the presence of submerged species. The dataset consisted of species presence-absence.
Thirty points were sampled in each arm, except in the Arroio Guaçu and Pinto arms, where there were 26 and 29 points, respectively. Each macrophyte stand was georeferenced with a global
positioning system (GPS) Garmin®. To maximize
the spatial analysis of each arm, the sampling sites were distribuited from the mouth of the tributaries to the places positioned close to the reservoir main body. The species that were not identified in the field were herborized and analyzed later. The identification of the collected material was carried out with the help of professional literature (Cook 1990; Kissman 1997; Lorenzi 2000; Pott and Pott 2000), and most species were deposited in the Herbarium of the Universidade Estadual de Maringá.
Comparison of Diversity Indices Applied to Macrophyte 279
Data Analyses
The calculations of diversity indices were performed from the data on presence-absence of species in the sampling stations. These data were converted into frequency data by dividing the number of times the species were recorded by the total records of all the species, referred as relative
abundance (
p
i), which was measured as:∑
=
= S
i i i i
n n p
1
(1)
where niis the number of stands in which the
species i was recorded. The values of relative
abundances ( i
p) were based on the frequency of
occurrences (incidence based data-set) and not on other measures of abundance (e.g., density or biomass) because of two reasons: (i) macrophytes are mostly clonal what makes very difficult to separate individual organisms and (ii) given the high number of sites surveyed and logistic limitations, it would be difficult to measure biomasses in all samples. According to Magurran (2004) the number of sampling units in which a species occurs may also be used as a method to estimate abundances. In fact, this approach has been successfully applied to measure the Shannon diversity in macrophytes assemblages (Baattrup-Pedersen et al. 2002). With the relative abundances estimated with frequency data, the
Shannon (H) and Simpson (D) diversity was
estimated. The other index used (the target index) was the Sq* (Mendes et al. 2008), which was from a family of diversity indices (Evangelista et al. 2009). In this work, a simplified methodology was developed for determining this number, using the software Mathematica 6.0 (Wolfram 1991), in which all the indices of diversity were also calculated.
In addition to the diversity indices used in this study, other components of diversity were
analyzed: richness (S: number of species per
sampling station) and Pielou evenness index (J).
The values of evenness tend to zero when one species dominates the whole community and, when the species have abundances very close, this value tends to 1. The dominance curves (Whittaker plot) were also prepared for each of the arms examined, as a way to visualize the two components of diversity (the number of species and the evenness).
The Pearson correlation values among the indices (Statistica v.7 software, StatSoft 2003) were estimated in order to analyze which indices were more related to the values of Sq*. However, because the same data was used to estimate all indices, the significance of correlations was not tested. Thus, first an analysis was made to assess whether there was correspondence between this new index and other traditional ones. Then the correlation analysis allowed assessing which attribute of the community of macrophytes, whose results were incidence based, best explained this index.
RESULTS
From 1999 until 2007, 53 taxa of macrophytes were observed in the eight arms of the Itaipu Reservoir, belonging to 28 families, of which one was identified to the level of family, 17 to the level of genera and 35 to species level. In more recent collections, many of these genera were identified down to species level, but in this work more conservative identification was preferred in order to maintain the consistency of data obtained since the beginning of the collection in 1999. This choice allowed comparing the data using long-term dataset. The distribution of relative abundances (based on incidence data) of the species was similar in all the arms (Fig. 2). However, slightly higher evenness values were found in the arms with the highest species richness: São Francisco Falso, Ocoí and Arroio Guaçu, with 46, 43 and 43 species, respectively (Fig. 2).
The arms with higher values of diversity,
according to Sq* and D were Arroio Guaçu,
followed by the Ocoí and São Francisco Falso.
Using the H index, the arms with higher diversity
were the same as those found with the indices Sq*
and D, but in different order: Ocoí, then the São
Francisco Falso and Arroio Guaçu. It was worth
noting that the Sq* index presented larger
oscillations (1.94 to 6.23) than H (1.73 to 3.01)
and D (0.75 to 0.94), indicating that this index
enhanced the differences among the samples
(Table 1). Moreover, the values of q* were always
lower than 1 (0.57 and 0.91), moving away from D
and approaching H and S (Table 1). Thus, they
were closer to the Shannon index (q tended to 1)
than the richness (q = 0) or the Simpson index (q =
0 10 20 30 40 50 Species rank
0 50 100 150 200 250 300 350 400
R
e
la
ti
v
e
a
b
u
n
d
a
n
c
e
OC PC RP SJ
A
0 10 20 30 40 50
Species rank 0
50 100 150 200 250 300 350 400
R
e
la
ti
v
e
a
b
u
n
d
a
n
c
e
AG SFF SFV SV
B
Figure 2 - Species rank of the macrophyte assemblages in the Itaipu Reservoir obtained in the arms Ocoí - OC, Passo Cuê - PC, Pinto - P, São João - SJ (A) and Arroio Guaçu - AG, São Francisco Falso - SFF, São Francisco Verdadeiro - SFV, São Vicente - SV (B).
Table 1 - Mean (amplitude between parentheses) values of the Sq*, H, D and q* measured for the eight arms in the Itaipu Reservoir.
Arms Sq * H D q*
Arroio Guaçu 4.55 (2.84-6.23) 2.59(2.17-2.94) 0.91 (0.85-0.94) 0.65 (0.57-0.79) Ocoí 4.26 (3.04-5.55) 2.71 (2.32-3.01) 0.91 (0.87-0.94) 0.73 (0.67-0.86) Passo Cuê 3.45(2.39-4.46) 2.38 (1.80-2.65) 0.88 (0.80-0.91) 0.75 (0.65-0.87) Pinto 3.50 (2.94-4.18) 2.40 (2.16-2.70) 0.89 (0.87-0.91) 0.73 (0.70-0.80) São Francisco Verdadeiro 3.65(2.22-5.61) 2.45 (1.87-2.98) 0.88 (0.80-0.94) 0.77 (0.65-0.86) São Francisco Falso 4.0 (2.66-5.55) 2.61(2.17-2.99) 0.90(0.85-0.94) 0.75 (0.65-0.84) São João 3.71 (2.54-4.98) 2.45 (2.09-2.77) 0.89 (0.83-0.92) 0.73 (0.65-0.85) São Vicente 2.96 (1.94-3.97) 2.23 (1.73-3.26) 0.85 (0.75-0.89) 0.78 (0.70-0.91)
The correlations among the indices were relatively
high (Table 2). The highest values of r were found
with the index H in Arroio Guaçu and São
Francisco Falso (r=0.98) and with S also in São
Francisco Verdadeiro (r=0.97). However, J had
low correlation coefficients with the index Sq*, and
the major value founded was in the arm Passo Cuê
(r=0.66).
Table 2- Pearson correlation values between Sq* and the other diversity indices (H and D), species richness (S) and evenness (J).
Arms H D S J
Arroio Guaçu 0.98 0.97 0.95 0.59
Ocoí 0.93 0.95 0.92 0.45
Passo Cuê 0.91 0.90 0.94 0.66
Pinto 0.96 0.94 0.88 -0.002
São Francisco Falso 0.98 0.94 0.80 0.48
São Francisco Verdadeiro 0.97 0.93 0.96 0.55
São João 0.95 0.94 0.91 0.44
São Vicente 0.96 0.93 0.81 0.56
DISCUSSION
One of the recurring difficulties in studying the patterns of diversity is to estimate accurately the
Comparison of Diversity Indices Applied to Macrophyte 281
respect the characteristics of the assemblages, because the actual number of species is difficult to determine. An alternative way of expressing the diversity is the use of indices, which include two
attributes: the number of species (or S) and
evenness. In this work, the values of Pearson
correlation (r) found between the new index (Sq*)
and other classical indices as well as with S, were
high (Table 2).
Indeed, the highest correlation between Sq*and H
illustrates the role of Sq* as a predictor of rarity,
because the optimal value q* is related to the
minimum evenness in the sample, so the index that
Sq*results is associated with a possible measure of
species rarity (Mendes et al. 2008). This perspective is also evidenced by the relatively high correlation with the Simpson index, which emphasizes the dominance. When there is a strong dominance of one species in the community, it is expected rarity of others. In this framework one could expect some significant relationship between
Sq*and Simpson index.
The analysis of r values between the Sq* and
evenness were much lower than those obtained between Sq* and the other indices. These results indicate that Sq* is more sensitive to the rarity and species richness, as already stressed by Mendes et al. (2008), but less affected by the evenness. From the mathematical point of view, this result is also consistent with the definition of Sq*, defined as a point of minimum evenness. As seen, evenness is
linked to the index H, while the new index, Sq*,
which is connected to the minimum value of evenness, generally does not have to be directly related to this attribute of the community. Indeed, it is defined from the extreme (minimum) values of a family of curves depending on the parameter that define them. In fact, the evenness is a measure of the global distribution of species in a given sample, and the general index associated with it,
by analogy (i.e. Eq*), is an index established from
the minimum of this sample. Likewise, the new
index Sq* is the result of extreme values of q. Thus,
there should be, in principle, no reason why these
two quantities (Sq* and J) have values close to or
are dependent on each other. This was the reason explaining the low correlations between them in all the studied arms.
The use of several diversity indices improves the analysis of the dataset (Ricotta 2003). The adoption of a wider content - both emphasizing the richness, as the rarity/dominance - adds to the
theoretical efforts to obtain a more complete picture of the complex phenomenon of the
diversity in biological systems. In this sense, Sq*
has an advantage over other indices because it
depends on a parameter q* which is unique for
each community or sample analyzed. In other
words, with regard to the content Sq*, the value of
the parameter q is a property found only for a
specific system (in the present case, a sample or a community) and it acquires a specific meaning because it is determined by the sample itself to which it is applied. This approach could be considered a new perspective when indices are used to analyze the communities (Mendes et al. 2008; Evangelista et al. 2009).
It is worth noting that when the Sq family is used
as the Tsallis entropy in the statistical mechanics, there is no clear criterion for determining the
optimal value of q (Mendes et al. 2008), unlike
what occurs with a biological community. In fact, in community ecology one could always choose
the best value of q as the one that minimizes the
amount that represents a family of evenness (Eq),
which is peculiar to each sample or particular
community. In this sense, Sq* represents a
completely different meaning compared to other
indices, which are based on a single value of q,
among the infinite universe of possibilities (q=1
for Shannon and q=2 for Simpson). In addition,
the study of the families of diversity indices could be easily accomplished by the means of computer programs such as Mathematica (Wolfram 1991) and R (Oksanen et al. 2005). Thus, the results of the present study showed that parametric indices had great potential for use in the biological contexts (Keylock 2005; Lovei 2005) and represented the most complete and comprehensive mathematical tool in studies of diversity.
ACKNOWLEDGEMENTS
Research Productivity Grant. This research was funded by Itaipu Binacional.
REFERENCES
Aczel J, Daroczy Z. On measures of information and their characterization. Academic Press, New York; 1975.
Baattrup-Pedersen A, Larsen SE, Riis T. Long-term effects of stream management on plant communities in two Danish lowland streams. Hydrobiologia. 2002; 481:33-45.
Buzas MA, Hayek LAC. Biodiversity resolution: an integrated approach. Biodiversity Letters. 1996;3: 40-43.
Cook CDK. Aquatic plant book. SPB Academic, The Hague, Netherlands; 1990.
Daroczy Z. Generalized information functions.
Information and Control. 1970;16:36-51.
Evangelista HBA, Thomaz SM, Mendes RS, Evangelista LR. Generalized entropy indices to measure alpha- and beta-diversities of macrophytes.
Brazilian Journal of Physics. 2009;39:396-401. Gorelick R. Combining richness and abundance into a
single diversity index using matrix analogues of Shannon’s and Simpson’s indices. Ecography.
2006;29:525-530.
Gotelli NJ, Colwell RK. Quantifying biodiversity: procedures and pitfalls in the measurement and comparison of species richness. Ecology Letters. 2001;4:379-391.
Izsák J. Parameter dependence of correlation between the Shannon index and members of parametric diversity index family. Ecological Indicators. 2007;7:181-194.
Kissman KG. Plantas infestantes e Nocivas (2nd edition) Editora BASF, São Paulo; 1997.
Keylock CJ. Simpson diversity and the Shannon-Wiener index as special cases of a generalized entropy. Oikos. 2005;109:203-207.
Lorenzi H. Plantas daninhas do Brasil: terrestres, aquáticas, parasitas, tóxicas e medicinais. (3nd edition) Nova Odessa: Instituto Plantarum, São Paulo; 2000.
Lövei GL. Generalized entropy indices have a long history in ecology-a comment. Community Ecology. 2005;6:245-247.
Magurran AE. Ecological diversity and its measurement. Princeton University Press; 1988. Magurran AE. Measuring biological diversity. Oxford,
Blackwell Science; 2004.
Melo AS. What we win “confounding” species richness and evenness in a diversity index? Biota Neotropica. 2008;8:021-027.
Mendes RS, Evangelista LR, Thomaz SM, Agostinho AA, Gomes LC. A unified index to measure ecological diversity and species rarity. Ecography, 2008; 31:450-456.
Oksanen J, Kindt R, O’Hara RB. Vegan: Community Ecology Package version 1.6-9; 2005.
Patil GP, Taillie C. Diversity as a concept and measurement. Journal of American Statistical Association.1982; 77: 548-561.
Peet R. Relative diversity indices. Ecology.1974;56: 496-498.
Pott VJ, Pott A. Plantas aquáticas do Pantanal. EMBRAPA, Brasília; 2000.
Purvis A, Hector A. Getting the measure of biodiversity. Nature. 2000; 405: 212-219.
Rényi A. On measures of entropy and information. In:
Proceedings of the Fourth Berkeley Symposium on Mathematical Statistics and Probability (ed G. Neyman). University of California Press, Berkeley; 1961, p. 547-561.
Ricotta C. On parametric evenness measures. Journal of Theoretical Biology. 2003; 22:189-197.
Shannon CE. A mathematical theory of communication.
The Bell System Technical Journal. 1948; 27:379-423.
Simpson EH. Measurement of diversity. Nature. 1949;163:688.
Tsallis C. Possible generalization of Boltzmann-Gibbs statistics. Journal of Statistic Physics. 1988;52:479-487.
Tsallis C, Mendes RS, Plastino AR. The role of constraints within generalized nonextensive statistics.
Physica.1998;261:534-554.
Wolfram S. Mathematica - a system for doing mathematics by computer. Addison Wesley, Redwood City: California; 1991.