Economic feasibility of biogas production in
swine farms using time series analysis
Viabilidade econômica da produção de biogás em granjas de suínos, por meio da análise de séries temporais
Felipe Luis RockenbachI Adriano Mendonça SouzaII João Helvio Righi de OliveiraIII
ISSN 1678-4596
ABSTRACT
This study aimed to measure the economic feasibility and the time needed to return capital invested for the installation of a swine manure treatment system, these values originated the sale of carbon credits and/or of compensation of electric energy in swine farms, using the Box–Jenkins forecast models. It was found that the use of biogas is a viable option in a large scale with machines that operate daily for 10h or more, being the return period between 70 to 80 months. Time series analysis models are important to anticipate the series under study behavior, providing
the swine breeder/investor means to reduce the financial investment
risk as well as helping to decrease the production costs. Moreover, this process can be seen as another source of income and enable
the breeder to be self-sufficient in the continuous supply of electric
energy, which is very valuable nowadays considering that breeders are now increasingly using various technologies.
Key words: biodigestors, biogas, renewable energy, income, time series.
RESUMO
Esta pesquisa tem por objetivo mostrar a viabilidade econômica e o tempo necessário de retorno do capital investido para a instalação de um sistema de tratamento de dejetos suínos, valores estes originados da venda de créditos de carbono e/ ou de compensação de energia elétrica em granjas de suínos,
utilizando os modelos de previsão de Box e Jenkins.
Identificou-se que é viável a utilização do biogás em uma escala de produção com um funcionamento diário dos equipamentos de 10 horas ou mais e o período de retorno entre 70 a 80 meses. O uso de modelos de previsão de séries temporais foi importante, pois antecipou o comportamento da série em estudo, fornecendo ao suinocultor/investidor subsídios para que o investimento seja
feito de modo a reduzir o risco, nos aspectos financeiros e na
redução dos custos de produção, bem como possibilitando uma outra fonte de renda e a autonomia no fornecimento de energia
elétrica ininterruptamente, o que é necessário nos sistemas de
criação cada vez mais tecnificados.
Palavras-chave: biodigestores, biogás, energia renovável, renda, séries temporais.
INTRODUCTION
In order to reduce emissions of gases causing the greenhouse effect, one measure is to offer some kind of incentives to countries that reduce the emission of the most polluting gases such as methane. This new business opportunity in the international market, which is the commercialization of carbon credits, help to reduce the emissions of greenhouse gases, which came up with the signing of the Kyoto Protocol in 1997.
Methane gas is closely linked to the increase in agricultural output of high performance, especially in swine breeding, where there is an increase of waste and pollutants, which should be treated in an environmental-friendly manner. In particular, the West region of Paraná, is abreast of technological advancements and is dedicated to the swine productive chain, partially due to the mild climate. According to CIRAM/EPAGRI (2007), swine manure comprises methane producing biogas, part fuel, (60-70%), carbon dioxide (40-30%), hydrogen
sulfide (traces), and compound-derived materials that
undergo anaerobic fermentation.
ICompanhia de Saneamento do Paraná (SANEPAR), 85902-080, Toledo, PR, Brasil. E-mail: felipelr@sanepar.com.br. Corresponding author. IIDepartamento de Estatística, Universidade Federal de Santa Maria (UFSM), Santa Maria, RS, Brasil.
IIIDepartamento de Engenharia de Produção e Sistemas, Universidade Federal de Santa Maria (UFSM), Santa Maria, RS, Brasil.
Biogas can be produced using a waste treatment system in anaerobic format. Methane is also the raw material for the production of electric energy and the key to obtain carbon credits. Indeed, maintaining adequate waste treatment in an environmental-friendly and sustainable manner is crucial for the success of this project.
To assist the swine producer in the production of biogas, this research seeks to support its decision on the feasibility and the return period, on the implementation of the swine manure treatment system. In this manner is provided a better understanding of this new economic activity, because carbon credit market and the production of electricity, from the treatment of swine waste is recent and emerging in Brazil.
This study aimed to demonstrate the economic feasibility and the required time to return the capital invested for building a swine waste treatment system. Such a framework has its origins in the sale of carbon credits and/or of compensation of electric energy in swine farms, through the application the Box–Jenkins forecasting models.
In addition, using the forecast models, we intend to quantify the monetary value that is possible to generate through rational use of biogas in rural holdings. It was also evaluated the economic feasibility of the project with the return obtained the kidnapping of carbon dioxide and electricity energy generation.
This motivates swine breeders to obtain greater profits
while simultaneously caring for the environment.
MATERIALS AND METHODS
The information in this study were drawn from the BioGas Burning of System Sadia
(SQBS), from breeder and swine finishing farms
of approximately 600 swine producers, located in Toledo, PR. The period comprised June 01, 2010 to September 30, 2012, totaling 820 days, and 164 samples, being each sample of 5 days, subsequently divided by 5, thus obtaining the per capita daily average per animal.
The goal was to determine the best method linear Integrated autoregressive general class and moving average (ARIMA) according to BOX et al. (1994), MAKRIDAKIS et al. (1998), GUJARATI (2000), MORETTIN & TOLOI
(2004), MORETTIN (2008), to fit and forecast
biogas production per capita per animal in the
reproducer class and finishing farm, demonstrating
the economic feasibility of building an anaerobic swine waste treatment system and the generation of electric energy and/or carbon credits. Knowing
the future values of these variables it will enable the study of the economic feasibility of building an anaerobic swine waste treatment system and the generation of electric energy and/or carbon credits.
Initially, it was analyze the stability series by using autocorrelation and partial autocorrelation functions, jointly with Ljung–Box test. Therefore, in addition to observing the stationary nature of
the series, it provided possible identification of autoregressive integrated moving average filters
(ARIMA) (p,d,q) model. Generically, a {xt,t Z} process that is not stationary follows an ARIMA (p,d,q) MARCHEZAN and SOUZA (2010) process according to equation Φ(B)ΔdX
t = θ(B)et (2.1),where
B is backward operator, d represents the order of integration, Φ is the autoregressive term given by the order p, θ is the weight moving average parameter represented by order q, and et that is the white noise series with characteristics with zero mean and constant variance.
The proposed model had the parameters estimated Ordinary Least Squares method.
The best model will be choosed Akaike’s Information Criteria (AIC) and Bayesian Information Criteria (BIC) criteria, which are known to “penalize” because they consider the number of estimated parameters.
AIC = T 1n(SQR)+2n (2.2) BIC = T 1n(SQR)+n1n(T) (2.3)
where T is the sample size, SQR is the sum of the square of the residues, and n is the number of parameters.
After chosen the best models by AIC and BIC criteria, the forecast criteria are used, which are measures for evaluating forecast errors, we used the root mean square error (RMSE), median absolute percentage error (MAPE), and U-Theil statistics, as shown in the equations 2.4, 2.5, and 2.6, respectively.
2.4
2.5 where n corresponds to the number of forecasts performed, xi represents the real value in
2.6 where N is the number of sample observations, xi is the value of the variables in study in instant i, xi-1 is the value of the variable in study in instant i-1, and
x
ˆ
i is the value estimated by the model for the instant i.Once the adjustment process of the ARIMA models and its forecasts are completed, the variable future behavior under study is forecasted, where you can provide the producer/investor to
verify their capacity to enable the financial return
on investment realized.
It starts then to budget costs and economic feasibility of implementation of the waste treatment system and energy production and/ or carbon credits. In this phase, it is necessary to estimate the implementation costs of the waste treatment system and maintenance of the producers’ equipment.
With the future values forecast by the
adjusted models, it is possible to define a minimum
number of swine per farm such that system implementation is economically viable and assures the return of investments and will also mitigate harmful effects to the environment.
RESULTS AND DISCUSSION
Swine raising in the city of Toledo, PR, at the end of 2012, had 28,500 matrix farm and
with 500,000 swine lodging vacancies finishing
farm. According to MUNICIPAL ASSOCIATION OF SUINOCULTORES (AMST, 2013), around 1,650,000 hogs are slaughtered annually.
For the variable “Swine Matrix Farm”, it was noticed that the series has high and low
fluctuations in the biogas production, but were
stationary, showing no upward or downward trends. The estimated model was an ARIMA (1,0,0) with
constant, being all coefficients significant at 5%
level. Among competing models for the daily variable of biogas per capita production measured in m³/reproducer, the autoregressive model AR (1) provided residues with white noise characteristics that were non auto correlated, showing the adequacy of the model found.
For the variable “Swine Finishing Farm”,
it was noted that the series has fluctuations around
the mean, but it was stationary in relation to biogas
production. An AR (1) model with constant was estimated and elected as the best model. For both variables, models presented the best values to AIC and BIC for model adjustments statistics, and best values to MAPE, RMSA, and U-Theil for forecast statistics.
The choice of econometric models ARIMA (p, d, q), is due to the fact the observations were auto correlated and there was records available useful to
be fitted only by time series, represented by methane
volume of gas produced in m³. Another motive to use time series analysis is that there was no records of other explanatory covariates to investigate other representative models.
To calculate the size of the anaerobic reactors (biodigestors), it was used the volume of waste in m³/animal/day for a minimum detention period of 30 days, which is a prerequisite for the validation of carbon credits. In this study, a security volume for 40 days was collected and the parameter was utilized by the BRF.
The financial reference values used in
this research are the biodigester costs involving the values: of the lower mantle (R$ 15.00m²), upper mantle (R$ 25.00m²), and labor (variable). As shown in the table 1 – Composition of the biogas system, period for return on investment used to generate eletric energy only and used to sell carbon credits, and generate eletric energy – given that the total cost for the matrix farm of 200, 500, and 750
animals and that for the finishing farm of 1,000,
2,500, and 5,000 animals, in agreement with the Sadia Institute – BRF (12/2013).
Regarding the production of electric energy, the company BIOGÁS MOTOR LTDA., adapted from the CCE (2000), considered that 0.56kg of manure waste produces 1m³ of biogas. ENTERPRISES FOCKING; BRANCO MOTOR (2009) considered that 1m³ of biogas generates 1.8kWh, CCE (2000) 6.73kWh, and NOGUEIRA (1986) 1.43kWh. This study used the latter since it contained more conservative values.
Monetary values equivalent to 1m³ of
biogas for gasoline, diesel oil, firewood, electric energy, and liquefied petroleum gas, vary from R$
0.16 to R$ 1.80 depending on the demands and supply of the market. Among the equivalent value of biogas of R$ 0.425, R$ 0.068 are from carbon credits and R$ 0.357 from electric energy.
The values for the production of eletric energy, and biogas consumption maintain a certain proportionality, are shown in the table 1, where the motor power (CV), biogas consumption (m³ h-1),
consider the fixed costs of the burner (R$ 20,000.00)
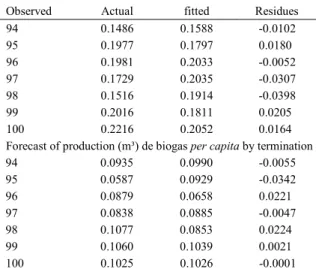
and the command control device (R$ 5,000.00). The predicted values for biogas production (m³) per capita per matrix and finished animal, are shown in the table 2 - Forecast of production of biogas per capita for the variables matrix and termination - resulted from the estimated model. These forecasts will be used in the calculation of economic feasibility, so that the producer/investor will have an assurance of at least seven periods in the future, which is equivalent to provide a guarantee of the biogas production. In this manner, we showed the
production level and confirm its stability in future.
Considering the values for the totality of the herd for the town of Toledo, PR, the volume of the electric energy obtained would generate a monthly amount of R$ 439,830.67. If it is added this amount to that obtained by the carbon credit (R$ 126,777.99), a considerable amount is obtained.
An important aspect to be consider is that the maintenance cost of the biodigestor is very low and should be done each 5,000h with a cost approximately 25% of the joint cost of a new generator. These costs
were find considering period of financial return. It was
used data from a farm matrix with 200 animals and a
finishing farm with 1,000 animals, because it was from this collection that the data were measured and fitted.
To estimate the biodigestor size for 40 days and for 80 days of storage, it was used the volume of manure and urine. To calculate the number of months for return on the investment, according to FAZ A CONTA (2013), a rate 6% of return per year was used.
It was used two hypotheses for calculating economic feasibility, as shown in table 1, a generator system with burner (electric energy and carbon credits), and a generator system electric energy. The
first system became viable in 78 months, and the
second in 68 months, with farms from 500 matrix
or 1,000 finished animals, and a daily minimum
operation for 10h, showing gains in scale.
In one scenario, cited by ROCKENBACH (2014), reported that the monthly cost of electric energy per adult animal in the farm was around R$ 2.00. Therefore, 500 animals resulted in R$ 1,000.00, an amount considered enough to cover the monthly costs to offset the initial investment.
Another example is the existence of hundreds of broiler houses, isolated or in batteries, with a capacity of around 16,000 chickens. Each aviary spends around R$ 600.00 for electric energy, R$
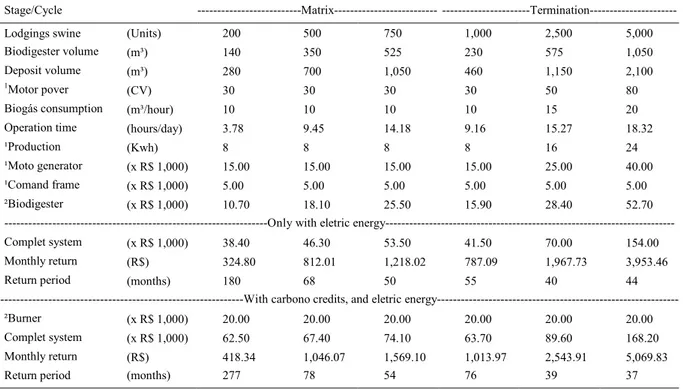
Table 1 - Composition of the biogas system, period for return on investment used to generate eletric energy only and used to sell carbon credits, and generate eletric energy.
Stage/Cycle ---Matrix---
---Termination---Lodgings swine (Units) 200 500 750 1,000 2,500 5,000
Biodigester volume (m³) 140 350 525 230 575 1,050
Deposit volume (m³) 280 700 1,050 460 1,150 2,100
1Motor pover
(CV) 30 30 30 30 50 80
Biogás consumption (m³/hour) 10 10 10 10 15 20
Operation time (hours/day) 3.78 9.45 14.18 9.16 15.27 18.32
¹Production (Kwh) 8 8 8 8 16 24
¹Moto generator (x R$ 1,000) 15.00 15.00 15.00 15.00 25.00 40.00
¹Comand frame (x R$ 1,000) 5.00 5.00 5.00 5.00 5.00 5.00
²Biodigester (x R$ 1,000) 10.70 18.10 25.50 15.90 28.40 52.70
---Only with eletric
energy---Complet system (x R$ 1,000) 38.40 46.30 53.50 41.50 70.00 154.00
Monthly return (R$) 324.80 812.01 1,218.02 787.09 1,967.73 3,953.46
Return period (months) 180 68 50 55 40 44
---With carbono credits, and eletric
energy---²Burner (x R$ 1,000) 20.00 20.00 20.00 20.00 20.00 20.00
Complet system (x R$ 1,000) 62.50 67.40 74.10 63.70 89.60 168.20
Monthly return (R$) 418.34 1,046.07 1,569.10 1,013.97 2,543.91 5,069.83
Return period (months) 277 78 54 76 39 37
100.00 for the residence, and R$ 400.00 in wood for bird heating. For the energy production for this aviary, it was required swine farm with about 500 swine matrix
or 1,250 swine finished, that will generate a monthly
return of investment of around R$ 1,100.00.
Analyzing the complete project of carbon credit returns and the generation of electric energy where the biogas volume actually is measured, the forecast of return on energy shows values that are feasible and close to reality. However, considering that the cost of electricity outside the rural environment are larger and if there is compensation in urban residential or business or industry, the investment return will be in a shorter period.
This is another source that will increase agriculture producers’ income or decrease the production costs, especially with the entrance into e of the ANEEL Regulatory Directive 482/2012.
The auto energy production by the agricultures will reduce impacts of power outages caused by climatic factors or accidents in the electric system in a country where the energy is transmited
for long distances. Other benefits brought by this
sources of clean electric energy is that it is being introduced into the national energy matrix. Studies and substantial investments such as solar and wind energy has been developed and implemented and biogas energy will compound the Brazilian energy matrix in the near future.
CONCLUSION
The goal of this research was to assist pig farmers in decision-making in the biodigester facility reached through ARIMA modeling, enabling the future of knowledge production behavior in m³ per capita biogas a horizon of seven steps a head. In this framework, the swine wastes are no longer the villains pollution and begin to
generate financial gains, through the generation of
electricity and/or carbon credits.
Producers, aware of their abilities to produce biogas, will have alternative to consuming the surplus of electric energy, producing a biointegrated system on a single property, a concern presented at the conclusion of the studies of CERVI et al. (2010).
The Box-Jenkins models fitted to swine farm matrix and finishing, were an order
autoregressive model of order 1 - AR (1), showing that production is highly dependent on the previous day. In matrix farm this dependency is on the order of 0.47987 and the termination farm is on the order of 0.79683, were both farms have an average production
per capita stable, represented by the mean significance
in the estimated models.
The use of biogas in farms using generators that function on a daily basis for 10h is viable, with return on investment around 70 to 80 months. This can be achieved by producing only electric energy or combined with carbon credits. The daily forecast per capita output of biogas is stable, relaying confidence
in volumes for the matrix and finishing farm.
Thus it is shown to be feasible implement the project and the period for economic return, with the aim of analyzing the economic viability of the project and the time necessary to generate an economic return. In turn, reducing the risk swine
breeder and increased self-sufficiency.
According to BRONDANI (2010),
significant expansion is prevented only due to the high
costs of project implementation and due to the absence of specialists for providing support for the swine
breeders to clarify costs and benefits, implementation
process, and maintenance procedures, being the negative aspects ascertained.
REFERENCES
AMORIM JÚNIOR, H.P. et al. Previsão da demanda de passageiros no Sistema de Transporte Coletivo utilizando as Redes Neurais Artificiais e os Algoritmos Genéticos. In: CONGRESSO BRASILEIRO DE COMPUTAÇÃO – CBCOMP,4., 2004, Itajaí-SC. Anais... Itajaí-SC: Universidade do Vale do Itajaí (Univali), 2004. p.306-312.
Table 2 - Forecast of production of biogas per capita for the variables matrix and termination.
----Forecast of production (m³) of biogas per capita by matrix----Observed Actual fitted Residues
94 0.1486 0.1588 -0.0102
95 0.1977 0.1797 0.0180
96 0.1981 0.2033 -0.0052
97 0.1729 0.2035 -0.0307
98 0.1516 0.1914 -0.0398
99 0.2016 0.1811 0.0205
100 0.2216 0.2052 0.0164
Forecast of production (m³) de biogas per capita by termination
94 0.0935 0.0990 -0.0055
95 0.0587 0.0929 -0.0342
96 0.0879 0.0658 0.0221
97 0.0838 0.0885 -0.0047
98 0.1077 0.0853 0.0224
99 0.1060 0.1039 0.0021
100 0.1025 0.1026 -0.0001
AMST (ASSOCIAÇÃO MUNICIPAL DE SUINOCULTORES). Toledo-PR, 2013. 1p.
ANEEL (AGÊNCIA NACIONAL DE ENERGIA ELÉTRICA). Resolução Normativa n.482/2012. Brasilia, 2012. Available from: <http://www.aneel.gov.br/cedoc/ ren2012482.pdf>. Accessed: Nov. 22, 2012.
BIOGÁS MOTORES LTDA. Energia de graça para sua propriedade. Toledo-PR: [s.d.]. 2p.
BOX, G.E.P. et al. Time series analysis: forecasting and control. 3ed. Englewood Cliffs, New Jersey: Prentice Hall, 1994, 729p.
BRONDANI, J.C. Biodigestores e biogás: Balanço energético,
possibilidades de utilização e mitigação do efeito estufa. 2010. 118f. Dissertação (Mestrado em Engenharia de Produção) – Centro tecnológico, Universidade Federal de Santa Maria, RS.
CCE (CENTRO PARA A CONSERVAÇÃO DE ENERGIA). Guia Técnico de Biogás, Agência Para a Energia – AGEEN. Alges, Portugal, 2000. 120p.
CERVI, R.G. et al. Viabilização econômica da utilização do biogás produzido em granja de suinocultura para a geração de energia elétrica. Revista Engenharia Agrícola, v.30, n.5, p.831-844, 2010.
CIRAM (CENTRO DE INFORMAÇÕES DE RECURSOS AMBIENTAIS E DE HIDROMETEOROLOGIA DE SANTA CATARINA) - EPAGRI. Biogás.Florianópolis. Available from: <http://ciram.epagri.rct-sc.br:8080/cms/mudancas_climaticas/ agricultura.jsp>. Accessed: May. 15, 2012.
EMPRESAS FOCKING; BRANCO MOTORES. Cartaz. Panambi, RS, 2009. 1p.
EVIEWS.COM. Product Information. Available from: <http:// www.eviews.com/home.html>. Accessed: Mar. 27, 2012.
FAZ A CONTA. Valor presente. Available from: <http://fazaconta. com/valor-presente-parcelamentos.htm>. Online. Accessed: Sep. 10, 2013.
GUJARATI, D.N. Econometria básica. 3ed. São Paulo: Makron Books, 2004, 846p.
MARCHEZAN, A.; SOUZA, A.M. Previsão do preço dos principais grãos produzidos no Rio Grande do Sul. Ciência Rural, v.40, n.11, p.2368-2374, 2010. Available from: <http://www.scielo.br/scielo. php?script=sci_arttext&pid=S0103-84782010001100019&lng=en&tln g=pt>. Accessed: Dec. 12, 2015.
MAKRIDAKIS, S.G. et al. Forecasting: methods and applications. 3ed. New York: John Willey & Sons, 1998, 642p.
MORETTIN, P.A. Econometria financeira: um curso em séries temporais financeiras. São Paulo: Edgard Blucher, 2008, 319p.
MORETTIN, P.A.; TOLOI, C.M.C. Análise de séries temporais. 2ed. São Paulo: Edgard Blücher, 2004. 535p.
NOGUEIRA, L.A.H. Biodigestão: a alternativa energética. São Paulo:
Nobel, 1986. 93p.
ONU (ORGANIZAÇÃO DAS NAÇÕES UNIDAS). Protocolo de Quioto. Quioto, Japão, 1997. 29p.
ROCKENBACH, F.L. Viabilidade econômica da produção de biogás em granjas de suínos, por meio da análise de séries temporais. 2014. 70f. Dissertação (Mestrado em Engenharia de Produção) – Curso de Pós-graduação em Engenharia de Produção, Universidade Federal de Santa Maria, RS.
SADIA. Programa de Suinocultura Sadia é destaque no relatório da ONU, 14/11/2008, Informativo Sadia. Available from: <http:// www.sadia.com.br/br/empresa/informativo_41963.asp>. Accessed: Fev. 23, 2013.
_____. SQBS – Sistema de Queima de Biogás da Sadia. Sistema corporativo. Base de dados. Available from: <http://www.sqbs.webhi. com.br/>. Online. Accessed: jun, 2010 to sep, 2012.