ISSN: 1809-4430 (on-line)
_________________________ 1 UNESP/Jaboticabal – SP, Brasil.
2 Instituto Federal Goiano/Ceres - GO, Brasil. 3 Universidade Federal de Viçosa/Viçosa - MG, Brasil. *Corresponding author. E-mail: [email protected]
VARIATIONS ON THE EXPERTISE OF TWO ATTRIBUTES OF PHYSICAL SOIL DUE TO DIFFERENCES IN THE METHOD OF GLOBAL SATELLITE NAVIGATION
Doi:http://dx.doi.org/10.1590/1809-4430-Eng.Agric.v36n4p 696-705/2016
CRISTIANO ZERBATO1*, ARIEL M. COMPAGNON2, MURILO A. VOLTARELLI3,
DAVID L. ROSALEN1, CARLOS E. A. FURLANI1
ABSTRACT: The mechanical resistance to penetration when related to the water content is an indicator often used of soil compaction, the use of positioning methods for greater accuracy of this review is important. In this context, this study aimed to determine the variability of positioning methods provided by GPS receivers to determine the spatial behavior of physical attributes related to soil compaction. The study area is located in the municipality of Jaboticabal, around the latitude
21º15’22”S and longitude 48º18’58”W, being characterized with a clayey Oxisol. The variables
used as parameters of soil physical properties were the mechanical resistance to penetration and water content, using a sampling grid of 20 x 20 m, totaling 60 points. We used six models of GPS receivers: Garmin Etrex Vista, Garmin Etrex 30, Ashtech MM6, Trimble Nomad, Garmin Map 62 and Trimble R6, with all georeferenced points in the regular grid intersections. The georeferencing using GPS receivers (single point positioning and post-processed differential correction) interfered in characterizing the spatial variability of soil resistance to penetration, differently for some receivers to the water content attribute. Positioning methods with post-processed differential correction, using R6 and MM6 models, better define the management zones of soil resistance to penetration.
KEY WORDS: GPS, penetrometer, soil compaction, soil water content.
INTRODUCTION
The soil systematic sampling is an alternative that aims to identify the spatial variability of its properties within the precision agriculture context. Thus, the precision agriculture can apply the principles of geostatistics to characterize the spatial variability of the attributes that make part of the agricultural production factors, such as the mapping of compacted soil layers (GÜLSER & CANDEMIR, 2012).
The navigation GPS (Global Positioning System) receivers, operating in position by simple point, acquire measures with order planimetric accuracy of 3 to 10 meters, preventing many applications that require greater precision (SILVA JUNIOR et al., 2009). Therefore, methods to improve the accuracy of georeferencing samples can be used, such as errors modelling or differential corrections, which can decrease the spatial errors of the soil physical properties study, providing better accuracy of future operations in the production cycle of certain crops (OMRANI et al, 2013).
As examples of the GPS positioning use in navigation of agricultural machines we have BAIO & MORATELLI (2011) and OLIVEIRA & MOLIN (2011). Researches also use this technology to register and georeferencing of rural properties (ROSALEN, 2014a, 2014b).
coordinates from each sampling point, due to the GPS receivers of greater acc uracy, improve the decision-making when the aim is to work in tillage systems in variable rates (MILLAN et al., 2012).
Assuming that there is certain variability in the accuracy between methods and GPS receivers that can affect the subsequent agricultural operations, due to the soil physical attributes related to the compacted layer, we aimed in this study to determine the spatial variability of mechanical resistance to the soil penetration and the water content, comparing the GPS positioning methods.
MATERIAL AND METHODS
The studied area is located in the municipality of Jaboticabal-SP, Brazil, around the latitude
21º15’22”S and longitude 48º18’58”W, with average altitude of 570m. The climate is classified,
according to Köppen, as subtropical with dry winter (Cwa). The predominant soil is classified as clayey eutroferric Oxisol, but the experiment area was in fallow.
For the RP measurements, we used an electronic penetrometer coupled to a quadricycle built according to the ASABE S313.3 standard (ASABE, 2006). A Dutch auger was used for the WC sampling, and for its determination we used the gravimetric method as described by EMBRAPA (1997).
The RP and WC were evaluated in layer of 0.0 - 0.10 m, following a sampling grid of 60 points spaced in 20 m, with a total area of 1.8 ha. The spacing of 20 m was adopted on the basis of the accuracy (less than 15 m), stated by the manufacturer, for the Garmin Etrex Vista receiver operated in positioning method by Simple Point (GARMIN, 2005). The sampling grid was placed with stakes, using a measuring tape. Subsequently, the points were georeferenced, using the positioning method by Simple Point (Garmin Etrex Vista, Garmin Etrex 30, Garmin GPS Map 62 and Trimble Nomad Serie 800 receivers), post-processed differential positioning (Ashtech Mobile Mapper 6 - MM6 receiver) and post-processed semi-kinematic positioning (Trimble R6 receiver). For the post-processing, we used the Mobile Mapper Office software and Trimble Business Center (differential and relative post-processing, respectively)
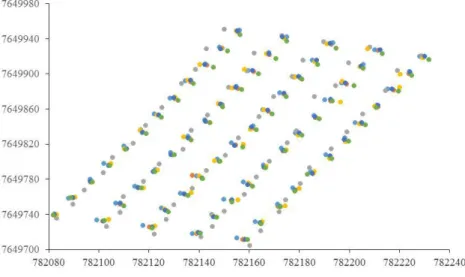
In the relative positioning, an elevation mask of 10° was used, static initialization of about 5 min and about 5s occupancy per sample point; we highlight that for all the georeferenced points, the fixing solution in post-processing was obtained. The Figure 1 shows the sampling scheme for the RP and the WC. We highlight the coordinate differences of the sampled points between the six used receivers.
The data were submitted to descriptive statistical analysis to determine the average, maximum and minimum values, coefficient of variation (CV), skewness and kurtosis coefficients. The attributes variability was classified according to the magnitude of the CV, as Pimentel-Gomes and Garcia (2002), being low for the CV value smaller than 10%; average, when between 10 and 20%; high, when between 20 and 30%, and very high, if higher than 30%.
To estimate the spatial dependence among samples and identify whether the changes were systematic or random, we used semivariograms models. The models selection was carried out based on the minor sum of the residue squares (SRS) and better determination coefficient (R2) being tested the spherical, exponential, Gaussian and linear model. The semivariograms were evaluated by the isolines method, observing isotropy in all adjusted models, indicating that the pattern of spatial variability structure is the same in all directions.
In the adjusted semivariograms were defined the following parameters: nugget effect (Co); level (Co + C) and reach of spatial dependence (a). The ratio between the nugget effect and the level, Co/ (Co + C), allowed the classification of the spatial dependence of the results. For the analysis of spatial dependence, we used the classification of CAMBARDELLA et al. (1994), which considers as strong spatial dependence the semivariograms that have nugget effect equal to 25% of the level; of moderate spatial dependence, when the nugget effect is between 25 and 75%, and weak spatial dependence, when the nugget effect is higher than 75%.
Subsequently, the estimation of experimental semivariograms and the theoretical models adjustment carried out the interpolation by kriging method and then preparation of maps, using specific programs (ROBERTSON, 2004). We opted for the kriging in blocks to generate maps with a more smoothed surface when compared to kriging specific. To investigate the similarity between the limits of the RP and WC maps of the soil using the coordinates acquired by GPS navigation, post-processed and in real time, the spatial correlation of the maps was carried out by the criteria employed by ROQUE et al. (2008).
RESULTS AND DISCUSSION
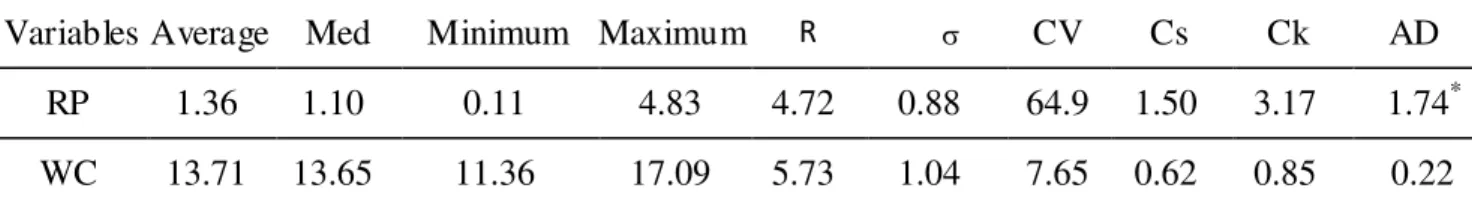
In Table 1 are shown the measures parameters of central tendency (average, median, minimum and maximum), dispersion measures (range, standard deviation, coefficient of variation), asymmetry measures (skewness and kurtosis coefficient) and the Anderson-Darling normality test for RP and WC.
TABLE 1. Descriptive statistical parameters for the soil mechanical resistance to penetration (MPa) and water content (%).
VariablesAverage Med Minimum Maximum R CV Cs Ck AD
RP 1.36 1.10 0.11 4.83 4.72 0.88 64.9 1.50 3.17 1.74*
WC 13.71 13.65 11.36 17.09 5.73 1.04 7.65 0.62 0.85 0.22
RP: The soil mechanical resistance to penetration; WC: water content; Med: median; R: range; standard deviation; CV: coefficient of variation (%); Cs: coefficient of skewness; Ck: coefficient of kurtosis; AD: value of the Anderson-Darling normality test. *Non-normal distribution of probability.
We observed that average, median, minimum and maximum values were quite distinct from each other, which indicates a high dispersion of remote data of the central position for the RP, in other words, the variation between these values shows that the average value diffe r from the sampled values (PIMENTEL-GOMES & GARCIA, 2002), differently from what happened for the WC.
classified as high or very high, which points to a high variability of the data, a contrary situation to what happened to the WC.
The skewness and kurtosis coefficients in relation to the RP also showed far from the average reference value (zero), also being an indicative of a non-symmetrical distribution of the data set, this information may be reflected also in the non-normal distribution of sampled values. According to MILLÁN et al. (2012), they found values with moderate coefficient of variation for the soil mechanical resistance to penetration when they evaluated the spatial distribution on a Vertisol, but this result shows a different condition of the coefficient of variation value found in this study.
ÖZGÖZ et al. (2012) studying the effects of spatial variability of soil physical properties, in relation to the water content, found moderate coefficients of variation and negative skewness coefficients, this last one can be considered as high, influencing the dispersion of data, a fact that does not occurred for this study due to the higher concentration of WC values around the average. The values distant from zero (reference value) for the RP of this study disagree with the values found by BOTTEGA et al., (2011) that evaluated the spatial variability of soil penetration resistance in a clayey dystroferric Oxisol.
Although these coefficients can be considered high for the water content in the soil, such asymmetry was not enough to make the distribution of non-normal data, a fact that can be confirmed by the Anderson–Darling probability frequency distribution test. In relation to the positive skewness coefficients, they represent that the data frequency distribution curve shows more elongated behaviour at right with information concentrated on the left. Similar results were found by VOLTARELLI et al., (2013) characterizing quality indicators in mechanized agricultural operations, in which the data variation is high. In the same way, the high kurtosis coefficients indicate the data distribution as being a curve denominated of leptokurtic, it is more elongated compared to the normal.
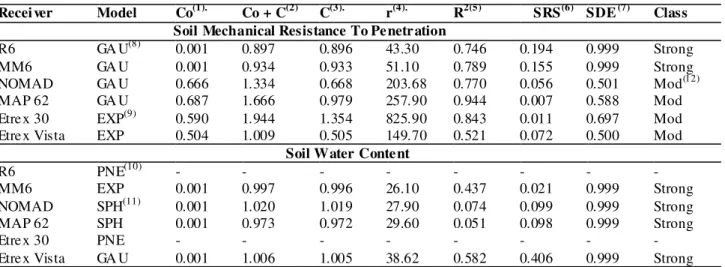
Through Table 2, we can observe the results of geostatistical analysis that helped in understanding and visualizing the behaviour of these physical properties in the studied area. Because of this, we can observe the differences between the three types of receivers used, and the RP and WC estimate, especially when comparing the adjusted models of semivariogram, showing uneven trends for different GPS receivers in the same sample area.
TABLE 2. Adjusted parameters to the semivariogram of the soil mechanical resistance to penetration and the water content for the positioning methods analysed.
Recei ver Model Co(1). Co + C(2) C(3). r(4). R2(5) SRS(6) SDE (7) Class
Soil Mechanical Resistance To Penetration
R6 GA U(8) 0.001 0.897 0.896 43.30 0.746 0.194 0.999 Strong
MM6 GA U 0.001 0.934 0.933 51.10 0.789 0.155 0.999 Strong
NOMAD GA U 0.666 1.334 0.668 203.68 0.770 0.056 0.501 Mod(12)
MAP 62 GA U 0.687 1.666 0.979 257.90 0.944 0.007 0.588 Mod
Etrex 30 EXP(9) 0.590 1.944 1.354 825.90 0.843 0.011 0.697 Mod
Etrex Vista EXP 0.504 1.009 0.505 149.70 0.521 0.072 0.500 Mod
Soil Water Content
R6 PNE(10) - - -
-MM6 EXP 0.001 0.997 0.996 26.10 0.437 0.021 0.999 Strong
NOMAD SPH(11) 0.001 1.020 1.019 27.90 0.074 0.099 0.999 Strong
MAP 62 SPH 0.001 0.973 0.972 29.60 0.051 0.098 0.999 Strong
Etrex 30 PNE - - -
-Etrex Vista GA U 0.001 1.006 1.005 38.62 0.582 0.406 0.999 Strong
(1): Nugget effect; (2): Level; (3): Variation; (4): Reach; (5): determination coefficient. (6): sum of squares error; (7): spatial dependence evaluator; (8): Gaussian model; (9): Exponential model; (10): Pure nugget effect; (11): Spherical Model; (12): Moderate.
When ROSALEN et al. (2011) studied the GPS receivers for the georeferencing of soil attributes spatial variability, they found spherical models using navigation and geodetic GPS for the resistance to penetration and exponential, using the same receivers for the WC in layers of 0-0.10m, these results are different from this study in which the navigation receivers showed e xponential and Gaussian model for the navigation GPS in relation to the RP.
On the other hand, the MM6, Nomad, GPS Map 62 and Etrex Vista receivers for the WC showed strong spatial dependence between their neighbouring points, while the R6 and the Etrex 30 did not show spatial dependence (pure nugget effect), and in these last receivers we could not find greater values than the distance of the sampling points, demonstrating the randomness of the results, without therefore necessarily using the geostatistics theory, but using the classical statistics. This result may indicate that the positioning quality obtained in georeferencing of samples interfered in the spatial distribution modelling of this variable, because in the relative processing with better quality and in the positioning by simple point with metric quality, using the receiver of declared worst accuracy, the spatial dependence was not obtained, while in the intermediate accuracies were obtained.
MARASCA et al. (2011) found similar results to this study, they studied the spatial variability of WC in no tillage system, in soybean crop, in which also reported no spatial dependence of such attribute using a sampling grid of 10 x 10 m. On the other hand, CAMPOS et al. (2012) evaluated the spatial variability of RP and WC in a Alitic Plinthic Haplic Cambisol cultivated with cassava and reported strong spatial dependence on the layer of 0-0.15 m. These results showed by these authors are similar to the ones found for this study, evaluating the same soil physical attributes depending on the different types of GPS receivers.
The semivariogram of the variables known and verified the spatial dependence among samples, we could interpolate values in any position in the study area using kriging, and, from these estimates we constructed contour maps for each variable.
(a) (b)
(c) (d)
(e) (f)
The R6 and MM6 models better define these areas, with values ranging up to 5 MPa, and may be set up the named "management zones" for future intervention in a soil decompression operation in variable ratewith greater accuracy. The possible differences between the R6 and MM6 receivers, in relation to the others, can be associated with greater accuracy of these, since they allow an average error of 0.02 m to 0.50 m, respectively, which is a different situation found for other positioning methods by simple point that can achieve average errors lower than 15 m.
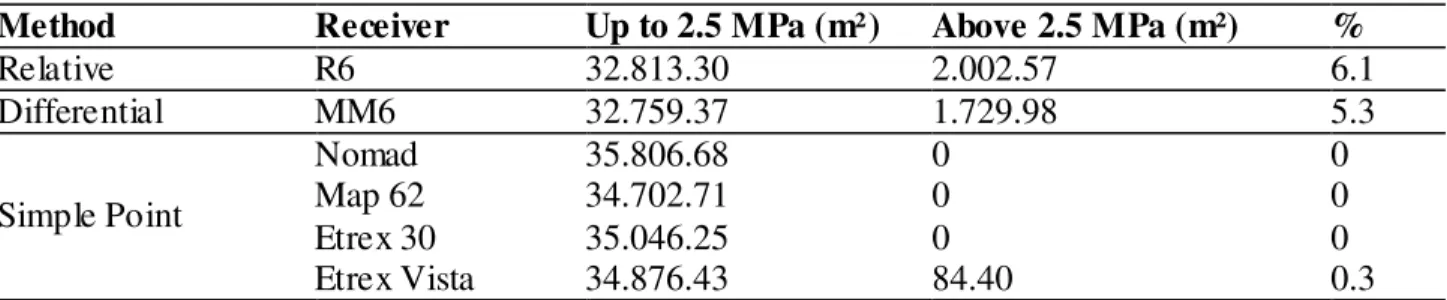
In Table 3, the areas below and above 2.5 MPa are shown values considered critical limits of RP for most of vegetables (SILVEIRA et al., 2010), for the positioning models studied. We highlight that in the quality of the relative positioning and differential positioning were identified areas with mechanical resistance above 2.5 MPa.
TABLE 3. Areas below and above 2.5 MPa for the soil mechanical resistance to penetration for the positioning methods studied.
Method Receiver Up to 2.5 MPa (m²) Above 2.5 MPa (m²) %
Relative R6 32.813.30 2.002.57 6.1
Differential MM6 32.759.37 1.729.98 5.3
Simple Point
Nomad 35.806.68 0 0
Map 62 34.702.71 0 0
Etrex 30 35.046.25 0 0
Etrex Vista 34.876.43 84.40 0.3
For the WC (Figures 3a, 3b, 3c and 3d), in general, there were no differences for the evaluated models, and the generated maps are quite similar, with values ranging between 10 and 18%. Comparing the information between the RP and WC charts, we observe that there was potential correlation when compared with each other, they are inversely proportional, wherein the bigger RP values are observed where the smaller WC values occur, and this last one is located on the West Southwest region of the maps.
(c) (d)
FIGURE 3. Kriging maps for the water content (%) for the receivers (a) MM6; (b) Nomad; (c) Map 62 and (d) Etrex Vista.
ROQUE et al. (2008) observed the same behaviour, where the areas that showed lower values of WC showed higher values of RP. BOTTEGA et al. (2011) state that the water amount found in the soil is closely linked to the values of RP, and therefore any change in the WC can dramatically change the RP.
Studies have shown that soil attributes generally occur in the second structural arrangement space with a feature size, which corresponds to the distance within which there is interdependence of the measured values, a fact that is revealed in the modelling and adjustment of the semivariogram (CORÁ & BELARDO, 2006). Therefore, we believe that the maps constructed by ordinary kriging, showed in this study, considering the spatial dependence of the attributes, show higher accuracy because such method allows estimating other locations in the plot in the study, and thus greater precision in the making and interpretation of maps.
CONCLUSIONS
The georeferencing of sample points using different positioning methods interfere with the characterization of the spatial variability of the soil mechanical resistance to penetration and the water content attribute.
The positioning methods with relative processing or differential processing define better the management areas of the soil mechanical resistance to penetration.
The soil mechanical resistance to penetration show spatial variability for the studied layer, with varied range for each GPS positioning method.
The positioning quality in the sample georeferencing can lead to the identification of non-existent spatial dependence.
REFERENCES
BAIO, F.R.R.; MORATELLI, R.F. Avaliação da acurácia no direcionamento com piloto automático e contraste da capacidade de campo operacional no plantio mecanizado da cana-de-açúcar. Engenharia Agrícola, Jaboticabal, v.31, n.2, p.367-375, 2011.
BOTTEGA, E.L.; BOTTEGA, S.P.; SILVA, A.S.; QUEIRO, D.M.; SOUZA, C.M.A.; RAFULL, L.Z.L. Variabilidade espacial da resistência do solo à penetração em um Latossolo Vermelho distroférrico. Revista Brasileira de Ciências Agrárias, Recife, v.6, n.2, p. 331-336, 2011. CAMBARDELLA, C.A.; MOORMAN, T.B.; NOVAK, J.M.; PARKIN, T.B.; KARLEN, D.L.; TURCO, R.F.; KONOPKA, A.E. Field-scale variability of soil properties in central Iowa soils. Soil Science Society of American Journal, Madison, v.58, n.5, p.1501-1511, 1994.
CAMPOS, M.C.C.; OLIVEIRA, I.A.O.; SANTOS, L.A.C.; AQUINO, R.E.; SOARES, M.D.R. Variabilidade espacial da resistência do solo à penetração e umidade em áreas cultivadas com mandioca na região de Humaitá, AM. Revista Agroambiente, Boa Vista, v. 6, n. 1, p. 09-16, 2012. CORÁ, J.E.; BERALDO, J.M.G. Variabilidade espacial de atributos do solo antes e após calagem e fosfatagem em doses variadas na cultura de cana-de-açúcar. Engenharia Agrícola, Jaboticabal, v.26, n.2, p.374-387, 2006.
EMBRAPA - EMPRESA BRASILEIRA DE PESQUISA AGROPECUÁRIA. Manual de métodos de análise de solo. 2.ed. Rio de Janeiro: Centro Nacional de Pesquisa de Solos, 1997. 212p.
FUENTES, R.L.; RICHART, A.; TAVARES FILHO, J.; GUIMARÃES, M.F.; FERREIRA, R.R.M. Evolution of physical properties of soils according to tillage systems on annual crops Semina: Ciências Agrárias, Londrina, v.27, n.2, p.205-220, 2006.
GARMIN. Owner’s manual and reference guide. Taipei: Garmin Corporation, 2005. 71 p. GÜLSER, C.; CANDEMIR, F. Changes in penetration resistance of a clay field with organic waste applications. Eurasian Journal of Soil Science, Samsun, v.1, n.1, p.16-21, 2012.
MALUF, H.J.G.M.; CAMPOS, S.C. Variabilidade espacial da resistência do so lo à penetração avaliada ao longo de um cultivo de milho. Revista Agrogeoambiental, Pouso Alegre, v. 4, n. 1, p. 67-72, 2012.
MARASCA, I.; OLIVEIRA, C.A.A.; GUIMARÃES, E.C.; CUNHA, J.P.A.R.; ASSIS, R.L.; PERIN, A.; MENEZES, L.A.S. Variabilidade espacial da resistência do solo à penetração e teor de água em sistema de plantio direto, na cultura da soja. Bioscience Journal, Uberlândia, v.27, n.2, p.239-246, 2011.
MILLAN, H.; TARQUÍS, A.M.; PÉREZ, L.D.; MATO, J.; GONZÁLEZ-POSADA, M. Spatial variability patterns of some Vertisol properties at a field scale using standardized data. Soil and Tillage Research, Amsterdam, v.120, p.76-84, 2012.
OLIVEIRA, T. C. A.; MOLIN, J.P. Uso de piloto automático na implantação de pomares de citros. Engenharia Agrícola, Jaboticabal, v.31, n.2, p.334-342, 2011.
OMRANI, A.; SHIEKHDAVOODI, M.J.; SHOMEILI, M. Spatial Distribution of Soil Penetration Resistance in Sugarcane Ratoon Fields. Journal Life Science Biomedicine, Erzurum City, v.3, n.5, p.328-334, 2013.
ÖZGÖZ, E.; GÜNAL, H.; ÖNEN, H.; BAYRAM, M.; ACIR, N. Effect of management on spatial and temporal distribution of soil physical properties. Journal of Agricultural Sciences, Toronto, v.18, p.77-91, 2012.
PIMENTEL-GOMES, F.; GARCIA, C.H. Estatística aplicada a expe rimentos agronô micos e florestais: exposição com exemplos e orientações para uso de aplicativos. Piracicaba: FEALQ, 2002. 309 p.
ROQUE, M.W.; MATSURAII, E.E.; SOUZA, Z.M.S.; BIZARI, D.R.; SOUZA, A.L. Correlação linear e espacial entre a resistência do solo ao penetrômetro e a produtividade do feijoeiro irrigado. Revista Brasileira de Ciência do Solo, Viçosa, MG, v.32, n.5, p. 1827-1835, 2008.
ROSALEN, D.L. Influence of distance, geometry and number of control stations on quality of local geodetic networks for the purpose of georeferencing of rural properties. Engenharia Agrícola, Jaboticabal, v.34, n.2, p.311-321, 2014 a.
ROSALEN, D.L. The impact of the law 10,267/2001 in the Brazilian rural registration. Engenharia Agrícola, Jaboticabal, v.34, n.2, p.372-384, 2014 b.
ROSALEN, D.L.; RODRIGUES, M.S.; CHIODEROLI, C.A.; BRANDÃO, F.J.C.; SIQUEIRA, D.S. GPS receivers for georeferencing of spatial variability of soil attributes. Engenharia Agrícola, Jaboticabal, v.31, n.6, p.1162-1169, 2011.
SILVA JUNIOR, C.A.; MEURER, I.; CARVALHO, L.A. Analysis of the accuracy of GPS receivers for navigation in territorial planimetry. Agrarian, Dourados, v. 2, n. 5, p. 21-31, 2009. SILVEIRA, D.C.; MELO FILHO, J.F.; SACRAMENTO, J.A.A.S.; SILVEIRA, E.C.P.
Relationship between the soil water content and root penetration resistance of a dystrocohesive yellow argissol in Bahia. Revista Brasileira Ciência do Solo, Viçosa, MG, v. 34, n. 3, p. 659-667, 2010.