http://www.uem.br/acta ISSN printed: 1806-2636 ISSN on-line: 1807-8672
Doi: 10.4025/actascianimsci.v35i4.18801
Feedlot performance, carcass characteristics and meat quality of
Nellore and Canchim bulls fed diets supplemented with vitamins
D and E
Samira Rodrigues Baldin1, Danilo Domingues Millen2*, Cyntia Ludovico Martins3, Angélica Simone Cravo Pereira4, Robson Sfaciotti Barducci1 and Mário de Beni Arrigoti1
1
Departamento de Melhoramento e Nutrição Animal, Universidade Estadual Paulista “Júlio de Mesquita Filho”, Botucatu, São Paulo, Brazil. 2Universidade Estadual Paulista “Júlio de Mesquita Filho”. Rod. Comte. Ribeiro de Barros, km 651, 17900-000, Dracena, São Paulo, Brazil. 3Departamento de Produção Animal, Universidade Estadual Paulista “Júlio de Mesquita Filho”, Botucatu, São Paulo, Brazil. 4Departamento de Nutrição e Produção Animal, Universidade de São Paulo, Pirassununga, São Paulo, Brazil. *Author for correspondence. E-mail: [email protected]
ABSTRACT. This experiment was conducted at Unesp feedlot facility, campus of Botucatu, and aimed to evaluate the supplementation of D and E vitamins on animal performance, carcass characteristics and meat quality of yearling bulls finished in feedlot. Thirty-six 7-mo-old yearling bulls, 18 Nellore (NEL) and 18 Canchim (CAC), with average initial body weight of 234.53 ± 22.15 and 248.13 ± 34.67 kg, respectively, were fed for 126 days. Nine NEL and nine CAC yearling bulls were daily supplemented with 1300 IU of vitamin E and 7.5 x 10⁶ IU of vitamin D3 for 67 days and 10 days before
slaughter, respectively. One day before slaughter, blood samples were collected for evaluation of Ca concentration. After chilling, Longissimus muscle (LM) samples were collected for analysis of shear force, myofibrillar fragmentation index, total lipids, D and E vitamins concentrations, and meat shelf
life. An increased level of plasma Ca
(p < 0.01) was observed due to vitamin supplementation, showing the action of vitamin D on the animal organism. However, there was no effect (p > 0.05) of vitamins D and E on feedlot performance, carcass characteristics and meat quality.
Keywords: calcium, color, pH, tenderness.
Desempenho, características de carcaça e carne de bovinos Nelore e Canchim, confinados
com dietas suplementadas com vitaminas D e E
RESUMO. O experimento foi conduzido no setor de confinamento da Unesp, campus de Botucatu, com o objetivo de avaliar a influência da suplementação das vitaminas D e E sobre o desempenho animal, características de carcaça e qualidade de carne de bovinos jovens confinados. Foram utilizados 36 machos inteiros, 18 Nelore (NEL) e 18 Canchim (CAC), de sete meses de idade com peso vivo inicial médio de 234,53 ± 22,15 e 248,13 ± 34,67 kg, respectivamente, os quais foram confinados por 126 dias. Nove animais NEL e nove CAC foram suplementados diariamente com 1300 UI de vitamina E e 7,5x10⁶ UI de vitamina D3 durante 67 e dez dias antes do abate, respectivamente. Um dia
antes do abate foram coletadas amostras de sangue para avaliação do cálcio plasmático. Na desossa, foram colhidas amostras do músculo Longissimus (LM) para análises como força de cisalhamento, índice de fragmentação miofibrilar, lipídeos totais, concentração de vitaminas D e E e tempo de prateleira. Foi observado aumento (p < 0,01) do nível de cálcio plasmático pela suplementação, o que indica atuação da vitamina D no organismo animal. No entanto, não houve efeito (p > 0,05) da suplementação de vitaminas D e E sobre o desempenho, características de carcaça e qualidade da carne.
Palavras-chave: cálcio, cor, pH, maciez.
Introduction
The intensive feedlot system of beef cattle to obtain faster capital turnover and, consequently, animals with better finishing and carcass standardization is a current reality in Brazil. In 2011
about 3.1 millions of cattle were finished in feedlots in Brazil (ANUALPEC,
Acta Scientiarum. Animal Sciences Maringá, v. 35, n. 4, p. 403-410, Oct.-Dec., 2013 beef meat exporter of the world, and that exported
1.24 million tons of beef for over 100 countries in 2012 (ANUALPEC, 2012), the feedlot system improves Brazilian export beef quality, mainly because the cattle is slaughtered at a younger age. However, the Brazilian beef quality still needs improvements to export to a greater variety of markets, and only the feedlot system itself cannot provide this quality because approximately 75% of feedlot cattle in Brazil are Nellore (NEL), a zebu cattle (MILLEN et al., 2009), which typically has less tender meat when compared to Bos taurus cattle (SILVEIRA et al., 2009). In addition, to be considered a high-quality meat, some factors like succulence, flavor, color, tenderness and durability are always taken into account. Thus, it is possible to significantly change beef attributes through feeding strategies; and supplementation with vitamins D and E, 10- and 67-days respectively, prior to slaughter (MONTGOMERY et al., 2004; CARNAGEY et al., 2008) may be an option to the challenge of obtaining higher quality meat. According to Millen et al. (2009), most feedlot systems in the country do not include any liposoluble vitamins to diets. Therefore, the addition of vitamin D may provide enough Ca to activate calcium-dependent proteases (µ- and m-calpain), which may accelerate the processes of meat maturation and tenderness (MONTGOMERY et al., 2004). Vitamin E protects MUFA, PUFA, and cholesterol against oxidative processes (SOUZA; SILVA, 2006), improving the appearance and durability of meat products in supermarket shelves.
On the other hand, meat quality improvement may also be related to genetic factors. Bianchini et al. (2007) utilized 8-mo-old bullocks from four distinct genetic groups: NEL, ½ Simmental vs. NEL, Simbrasil and Simmental. NEL and ½ Simmental vs. NEL bulls presented greater shear force (4.98 and 4.45 kg, respectively) when compared to cattle from the Simmental and Simbrasil genetic groups (3.13 and 3.33 kg, respectively). However, after seven days of ageing, no differences in tenderness were observed in Longissimus muscle (LM) between the genetic groups tested in the study. Regarding the feedlot performance, it is documented in the literature that cattle with more than 50% of Bos taurus genotype in their composition present better feedlot performance than NEL bulls (EUCLIDES FILHO et al., 2003; PACHECO et al., 2012).
Thus, the aim of this study was to evaluate the effect of genetic groups and supplementation of vitamins D and E on feedlot performance, carcass
characteristics and meat quality of NEL and Canchim (CAC) yearling bulls.
Material and methods
Local, animals, and management
This study was carried out at the São Paulo State University (UNESP) feedlot, Botucatu campus, Brazil. Thirty-six 7-mo-old yearling bulls from two genetic groups, 18 NEL and 18 CAC (⅝ Charolais vs. ⅜ NEL), with average initial body weight (BW) of 234.53 ± 22.15 and 248.13 ± 34.67 kg, respectively, were used. The cattle were kept in feedlot for a total of 126 days, including 21 days of adaptation to diets and facilities. In the beginning of the experiment, all animals were weighed, dewormed and vaccinated against viral and bacterial diseases (tetanus, bovine viral diarrhea virus, 7-way Clostridium sp.; Cattlemaster and Bovishield, Pfizer Animal Health, New York, USA).
Treatments and diets.
Cattle were randomly distributed into 36 pens (1 animal per pen). The experiment had a 2 x 2 factorial arrangement of treatments with nine replications, in which 9 NEL and 9 CAC bulls were supplemented with vitamins D and E. The utilized diets in this study were formulated based on the Cornell Net Carbohydrate Protein System 5.0.26 (CNCPS, 2000). Compositions of the experimental rations are presented in Table 1. Rations were weekly sampled to determine contents of DM, CP, NDF, ether extract, ashes, Ca and P, and evaluated according to Horwitz (2006). Physically effective NDF (peNDF) was calculated based on the model of the Penn State particle size separator: peFDN = pef x %NDF in diet, where pef indicates the physical effectiveness factor.
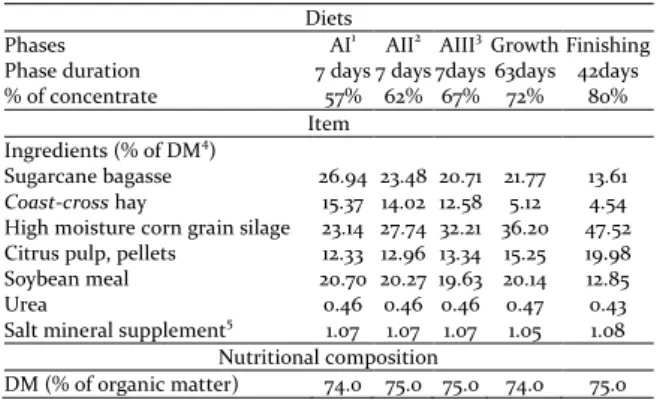
Table 1. Ingredients and nutritional composition of rations provided to Nellore and Canchim yearling bulls finished in feedlot.
Diets
Phases AI1 AII2 AIII3 Growth Finishing Phase duration 7 days 7 days 7days 63days 42days
% of concentrate 57% 62% 67% 72% 80%
Item Ingredients (% of DM4)
Sugarcane bagasse 26.94 23.48 20.71 21.77 13.61
Coast-cross hay 15.37 14.02 12.58 5.12 4.54 High moisture corn grain silage 23.14 27.74 32.21 36.20 47.52 Citrus pulp, pellets 12.33 12.96 13.34 15.25 19.98 Soybean meal 20.70 20.27 19.63 20.14 12.85
Urea 0.46 0.46 0.46 0.47 0.43
Salt mineral supplement5 1.07 1.07 1.07 1.05 1.08
Nutritional composition
CP (% of DM) 15.6 15.7 15.8 16.0 13.8 Ether extract (% of DM) 3.21 3.44 3.67 3.79 4.11 NDF (% of DM) 37.1 33.6 30.3 25.9 19.2 peNDF (% of DM)4 32.1 28.7 25.5 21.1 15.9
TDN (% of DM) 71.2 73.3 75.5 76.9 80.0 P (% of DM) 0.35 0.36 0.39 0.40 0.41 Ca (% of DM) 0.61 0.61 0.62 0.65 0.66
1AI: adaptation I; 2AII: adaptation II; 3AIII: adaptation III.4Physically effective neutral
detergent fiber. 5Supplement contained 30% of urea as a N source, as well as Ca, 26.7%; P,
5.3%; Na, 10.9%; S, 1.5%; Zn, 2,600 ppm; Mn, 1,300 ppm; Cu, 1,032 ppm; I, 45.0 ppm; Se, 15.0 ppm; Co, 154 ppm; Fe, 2500 ppm. Monensin was added at 1500 mg kg-1 of supplement.
Bulls were fed twice daily; in the morning (8:00 am) they received 40% of the total daily delivery and in the afternoon (3:00 pm) 60% of the total. Bulls were weighed in the beginning of the study and then every 21 days, after a 16-h solid fast to monitor daily BW gain. Dry matter intake (DMI) was measured every day by weighing the amount of provided ration and the refusals in the following day. Daily samples of total diet were collected to determine DM content for consequent calculation of daily intake expressed in kg of DM. The calculation of feed to gain ratio considered total DMI throughout the experiment on the total weight gain during 126 days. Sixty-seven days before slaughter, nine NEL and nine CAC bulls were daily supplemented with 1300 UI of vitamin E (Alpha Tocopherol Acetate -Mcassab®, São Paulo, São Paulo State, Brazil). Likewise, 10 days before slaughter, the same animals daily received 7.5 x 10⁶ UI of vitamin D each (Vitamin D3 - Mcassab®, São Paulo, São Paulo State, Brazil). Vitamins were mixed to 100 g of soybean meal, used as vehicle, and the mixture was poured in the diets immediately after the delivery to ensure their complete intake. The soybean meal amount used as vehicle was discounted from the total provided ration to avoid feed unbalance.
Samples collection and analysis
One day before slaughter, blood samples from each animal were collected in 10 mL vacuum tubes (Vaccutainer - Becton Dickinson, Franklin Lakes, NJ, USA) with Na heparin to assess the concentration of plasma Ca. Tubes were stored in containers with ice during collection, transported to the laboratory and immediately processed. Samples were centrifuged for 15 min. at a speed of 500 x G to separate plasma. Then, 4 mL of plasma were transferred to two 2-mL eppendorf tubes and stored at-20°C (EMMANUEL et al., 2008). Samples were analyzed afterwards by atomic absorption spectrometry to determine the concentration of plasma Ca. The cattle were slaughtered in a commercial slaughterhouse when their LM
subcutaneous fat thickness reached 4 mm, as assessed by ultrasound. Later, after verifying hot carcass weight (HCW), the initial pH was measured in the cold room of the slaughterhouse, and the final pH (pH24) was measured 24h later on the left carcasses between the 12th and 13th ribs of LM, using a digital pH meter (model DMPH-2, Digimed, São Paulo, São Paulo State, Brazil). Dressing percentage was calculated using the data of HCW and final BW obtained before loading the animals to the slaughterhouse. After 24-h chilling at 0ºC, seven 2.54-cm LM samples from between the 9th and 13th ribs of each animal were collected. Four samples were used to analyze shear force and myofibrillar fragmentation index: two at time zero (without ageing) and two after seven days of ageing.
For the ageing process, samples were vacuum-packaged individually and aged between 0°C and 2°C for 7 days, and then frozen at -20ºC for future analyses. The other two samples were vacuum-packaged individually and frozen in freezer at -20ºC for future analyses of total lipid contents and vitamins D and E in the meat. The last sample collected from each animal was individually vacuum-packaged for posterior evaluation of color and pH of meat exposed to simulate sales conditions, i.e., shelf life. Because the samples for shelf life analyses were neither aged nor frozen, they were analyzed right after the slaughter.
Samples were individually packed, identified, and arranged on polystyrene trays, then covered with polyvinyl chloride (PVC) film and displayed on a meat counter with ranging temperatures from 0ºC to 4ºC and controlled luminosity of 125 lux to simulate shelf life. At days 0 (P0), 1 (P1), 2 (P2), 3 (P3), 6 (P6) and 7 (P7) of exposure, PVC film was removed and samples were exposed to the environment for 20 - 30 min. for myoglobin oxygenation; then, color and pH were measured. Afterwards, samples were packaged again with PVC plastic film and placed back in the meat counter. The meat color was determined using a portable colorimeter (model MiniScan XE, Hunter Lab, Reston, USA), D65 light source, utilizing the CIELAB system scale (L*- chroma associated with luminosity ranging from 100 (white) to 0 (black), a* - chroma ranging from +60 [red] to -60 [green], and b* - chroma ranging from +60 [yellow] to -60 [blue]) according to Karamucki et al. (2006). Likewise, Hue angle (HA = tan-1(b*/a*) and Chroma (C = [a*2+b*2]1/2) were calculated according to Rentfrow
Acta Scientiarum. Animal Sciences Maringá, v. 35, n. 4, p. 403-410, Oct.-Dec., 2013 (0º = true red to 90º = true yellow). Chroma, or color
saturation, is a measurement of the vividness of color (higher values indicate a more vivid color). The equipment was calibrated using a white standard and a black one before the sample readings. For each measurement, the color measuring was done in three different regions of the sample, and their average was considered a determined value. For pH measurements, a pH meter coupled to a digital thermometer (model DMPH-2, Digimed, São Paulo, São Paulo State, Brazil) was used. For shear force analysis, it was used a Warner-Bratzler Shear Force device (GR Elec. Mfg. Co., Manhattan, KS, USA) and procedures were performed according to King et al. (2003). The myofibrillar fragmentation index (MFI) was determined according to the methodology described by Kerth et al. (2003). The percentage of total lipids was determined as recommended by Starke et al. (2010). The amount of vitamins D and E was determined by HPLC after hydrolysis and quantification using a UV-VIS detector (Jasco, Great Dunmow, Essex, England) according to Montgomery et al. (2004). The analysis behavior was the same for vitamins D and E because both are liposoluble vitamins.
Statistical analysis
The data referring to variables of performance, carcass characteristics, plasma Ca, contents of lipids, and vitamins D and E were examined in a 2 x 2 factorial arrangement through analysis of variance utilizing PROC GLM of SAS. The model included the effects of genetic groups (NEL and CAC), addition or not of vitamins D and E, and the interaction between them. Data related to shear force, MFI, and cooking losses, pH and color in LM were analyzed in a 2 x 2 factorial arrangement with repeated measures over time through analysis of variance using PROC Mixed of SAS. The model included the effects of genetic groups (NEL and CAC), addition or not of D and E vitamins, ageing (in the case of shear force, MFI and cooking losses), evaluation period (P0, P1, P2, P3, P6, P7 for pH and color) and the interaction between them. When the tested effects were significant for this model, the averages were compared utilizing contrasts through the CONTRAST option of SAS. The response measures, collected according to time, were subjected to 10 covariance structures: AR (1), ARH (1), ANTE (1), TOEP, TOEPH, CS, CSH, UN, UNR and HF. The covariance structure with the lowest value of Akaike Criterion for each variable was
chosen because it better accommodates the data matrix. Tests for normality and variance heterogeneity were made before the analysis of variance and, when needed, data were transformed. Tukey’s test was used to compare mean values, whenever necessary, and results were considered significant at p < 0.05.
Results and discussion
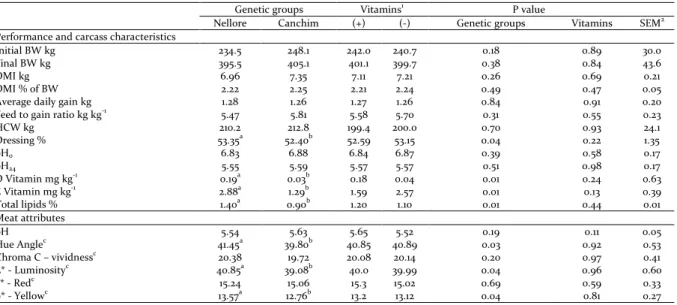
There was no effect (p > 0.05) of the supplementation of vitamins D and E on animal performance and carcass characteristics (Table 2). Likewise, no effect of the genetic group (p > 0.05) was observed on animal performance and carcass characteristics, except for dressing percentage (p < 0.05), and the contents of total lipids and vitamins D and E in LM, in which NEL bulls presented higher dressing with greater contents of lipids and vitamins D and E (Table 2). It is well documented (PACHECO et al., 2012) that NEL bulls present increased dressing percentage, since they are characterized by lighter leather, head, and gastrointestinal tract than Bos taurus breeds. Similarly, as NEL breed is considered smaller than CAC, NEL bulls may have started depositing fat earlier, which could explain the greater lipid content in the meat (MENEZES et al., 2005). Moreover, the concentration of the active vitamin D (1.25(OH)2D) in the plasma and in different tissues are likely to be greater in Bos indicus than in Bos taurus. This difference in the storage of 1.25(OH)2D in the tissue can be due to the genetic adaptation to sunlight environment by Bos indicus cattle when compared to Bos taurus. Therefore, Bos indicus animals presented more efficient metabolism to store active vitamin D (MONTGOMERY et al., 2004). On the other hand, it has not been explained yet why Nellore bulls presented greater concentration of E vitamin in LM. The greater intake of roughage ingredients through selection may increase the basal concentrations of vitamin E precursors, increasing its content in meat. However, although it had been observed that refusals in Nellore bulls feed bunkers basically consisted of concentrates, the ingredient selectivity was not measured in this study.
at approximately one year of age which may have collaborated to the absence of the supplementation effect because the animals not supplemented with vitamins D and E presented values that represent good quality meat for HA, L*, and chroma a*, chroma b*, and, chroma C according to Page et al. (2001). Likewise, no effect of the genetic group was detected (p > 0.05) on the value of pH, chroma C and chroma a* during the exposure of LM samples to simulated retail conditions; however, the effect of the genetic groups was observed on the values of HA (p = 0.03), luminosity (p = 0.04), and chroma b* (p = 0.04), in which NEL bulls presented meat with greater HA, L* and chroma b* than CAC bulls
(Table 2). Therefore, due to lower HA, L* and chroma b* values, LM samples from CAC bulls were closer to true red, as desired by consumers, than LM samples from NEL bulls.
The greater luminosity and lower HA values may be attributed to the tougher NEL bulls meat observed by MFI data obtained in this study when LM samples were not aged. In this case, LM samples from NEL bulls may have lost more water to surface due to the greater contraction of muscle myofibrils, reducing the capacity to retain internal water and making it less succulent and, consequently, harder.
Table 2. Performance, meat attributes and carcass characteristics of Nellore and Canchim yearling bulls supplemented or not with D and E vitamins.
Genetic groups Vitamins1 P value
Nellore Canchim (+) (-) Genetic groups Vitamins SEM2
Performance and carcass characteristics
Initial BW kg 234.5 248.1 242.0 240.7 0.18 0.89 30.0
Final BW kg 395.5 405.1 401.1 399.7 0.38 0.84 43.6
DMI kg 6.96 7.35 7.11 7.21 0.26 0.69 0.21
DMI % of BW 2.22 2.25 2.21 2.24 0.49 0.47 0.05
Average daily gain kg 1.28 1.26 1.27 1.26 0.84 0.91 0.20
Feed to gain ratio kg kg-1 5.47 5.81 5.58 5.70 0.31 0.55 0.23
HCW kg 210.2 212.8 199.4 200.0 0.70 0.93 24.1
Dressing % 53.35a 52.40b 52.59 53.15 0.04 0.22 1.35
pH0 6.83 6.88 6.84 6.87 0.39 0.58 0.17
pH24 5.55 5.59 5.57 5.57 0.51 0.98 0.17
D Vitamin mg kg-1 0.19a 0.03b 0.18 0.04 0.01 0.24 0.63
E Vitamin mg kg-1 2.88a 1.29b 1.59 2.57 0.01 0.13 0.39
Total lipids % 1.40a 0.90b 1.20 1.10 0.01 0.44 0.01
Meat attributes
pH 5.54 5.63 5.65 5.52 0.19 0.11 0.05
Hue Anglec 41.45a 39.80b 40.85 40.89 0.03 0.92 0.53
Chroma C – vividnessc 20.38 19.72 20.08 20.14 0.20 0.97 0.41
L* - Luminosityc 40.85a 39.08b 40.0 39.99 0.04 0.96 0.60
a* - Redc 15.24 15.06 15.3 15.02 0.69 0.59 0.33
b* - Yellowc 13.57a 12.76b 13.2 13.12 0.04 0.81 0.27
a,bFor the genetic group effect, averages with different superscript letter are significantly different (p < 0.05). cEffect of the evaluation period: days 0, 1, 2, 3, 6 and 7 (p < 0.05) shown in Table 4. 1Vitamins: (+) with vitamin supplementation; (-) without vitamin supplementation.2SEM: standard error of the mean.
Authors, such as Silveira et al. (2009), have reported increased shear force values and less vivid red color for LM samples of NEL bulls when compared to LM samples of Charolais bulls.
Table 3. Contrasts for the values of pH and color (Hue Angle, Chroma C, L*, a* and b*) measured at days zero (P0), one (P1), two (P2), three (P3), six (P6) and seven (P7) after the slaughter in LM of Canchim and Nellore yearling bulls exposed to simulated retail conditions.
Item pH Hue Angle Chroma C L* a* b* Periods ---Averages--- p0 5.54 40.62 20.05 40.34 15.21 13.04 p1 5.44 39.42 23.27 40.91 17.94 14.79 p2 5.50 40.39 22.72 41.06 17.29 14.72 p3 5.51 40.99 22.20 40.76 16.74 14.55 p6 5.70 44.74 17.44 38.92 12.35 12.25 p7 5.80 45.22 15.16 37.82 11.36 9.64 Contrasts ---Values of p--- p0 vs. p1 0.13 0.19 < 0.01 0.43 < 0.01 < 0.01 p0 vs. p2 0.57 0.92 < 0.01 0.31 < 0.01 < 0.01 p0 vs. p3 0.68 0.82 < 0.01 0.58 < 0.01 < 0.01 p0 vs. p6 0.02 < 0.01 < 0.01 0.04 < 0.01 0.04 p0 vs. p7 < 0.01 < 0.01 < 0.01 < 0.01 < 0.01 < 0.01
a,b
Contrasts differ significantly when p < 0.05.
Acta Scientiarum. Animal Sciences Maringá, v. 35, n. 4, p. 403-410, Oct.-Dec., 2013 acceptable, regardless of exposure time to
simulated retail conditions (PAGE et al., 2001). Likewise, the found values of L*, ranging from 37.82 and 41.06, are similar to those observed by Rentfrow et al. (2004), showing that the analyzed samples presented luminosity within the acceptable quality range as well as the HA values (PAGE et al., 2001). There were differences (p < 0.05) in all comparisons between day zero and the other days for the values found for chroma C, chroma a* and chroma b*. There was a considerable reduction in values of chroma C, L*, a* and b* at day six and day seven, as well as a significant increase in HA values and pH at the same days. This may have occurred due to the color oxidation process which reduced the values of L*, chroma C, chroma a* and chroma b*, making the meat present a more brownish color. Likewise, HA values indicated measurements at days six and seven were closer to true yellow than measures taken at days zero, one, two and three. According to Bloomberg et al. (2011), there is evidence that PVC vacuum-packed fresh meat exposed to light has approximately a seven-day shelf life, and after this period, the deterioration process starts, drastically changing its color. According to the results obtained in this study, from the sixth day of exposure to simulated retail conditions, the meat becomes inappropriate for consumption. For all analyzed meat attributes, only after the sixth and seventh exposure day, the variables pH, L*, chroma C, chroma a* and chroma b* presented significantly lower values than measured at day zero. According to Rentfrow et al. (2004), with time, myoglobin retains oxygen in the muscle and becomes less efficient. Therefore, the process to oxygenate deoxymyoglobin to oxymyoglobin may be slower, producing lower amounts of deoxymyoglobin, making the meat darker. Besides, from the sixth exposure day, samples presented unacceptable visual aspect for consumption due to the low values of chroma C, a* and b*, and, therefore, they were discarded and evaluations under simulated retail conditions were finished on the seventh day. When adopting day zero of pH and color measurements as the standard reference, samples of LM become inappropriate for human intake on the sixth day of exposure to simulated retail conditions, regardless of vitamin supplementation or breed.
In relation to meat tenderness, there was no effect (p > 0.05) of the supplementation of vitamins D and E on any of the studied variables (Table 4). Nevertheless, the effect of vitamin supplementation was observed (p = 0.04) in the concentration of plasma Ca in which the supplemented cattle
presented greater Ca content than non-supplemented animals. Montgomery et al. (2004) also reported that the increase of plasma Ca with D vitamin supplementation has not affected the shear force of LM. Vitamin D supplementation can be effective to improve meat tenderness when cattle are likely to present harder meat, not having an effect on animals that already produce tender meat (MONTGOMERY et al., 2004), as in our study that used yearling bulls with initial age of seven months and slaughter age of approximately one year. Similarly, the main effect of the genetic group was not observed (p > 0.05) on shear force, cooking losses and concentration of plasma Ca (Table 4). But an interaction effect (p = 0.04; pooled SEM = 2.47) between the genetic groups and ageing process was observed for the MFI, in which CAC bulls presented more tender meat than NEL bulls (65.04 and 54.12, respectively) when samples were not aged; however, after seven days of ageing, the meat tenderness of both breeds improved and the existing difference disappeared (73.10 and 71.09 for CAC and NEL bulls, respectively). Although NEL bulls presented greater concentrations of plasma Ca and D vitamin in LM, they presented less tender meat than CAC bulls when the meat was not aged. This result can be explained by the fact that Zebu cattle, like NEL, present greater concentrations of calpastatin, inhibiting calcium-dependent proteases (μ- and m-calpain) which are responsible for making meat tender (MONTGOMERY et al., 2004) when compared to CAC bulls. Thus, the seven days of ageing changed meat tenderness of NEL bulls more significantly than of CAC bulls. This may have occurred because Ca ion is a regulating agent of the contractile system, acting on the ageing process (CARNAGEY et al., 2008), influencing more expressively the meat ageing process of animals that are likely to present less tender meat like NEL bulls.
Table 4. Tenderness characteristics of LM and concentration of plasma Ca of Nellore and Canchim yearling bulls supplemented or not with vitamins D and E.
Genetic groups Vitamins1 Ageing2
Item Nellore Canchim (+) (-) 0 7 SEM3 Shear force kg 4.12 3.82 4.00 3.94 4.19a 3.76b 0.14 Cooking losses % 24.18 23.21 23.57 23.82 23.22 24.17 0.69 Myofibrillar
fragmentation indexc 62.61 69.07 63.87 67.82 59.5872.09 2.71
Plasma Ca mg L-1 172.2 169.9 189.7a 152.4b - - 26.5
a,bFor the effect of vitamins, averages with different superscript letters are significantly
different (p < 0.05). cInteraction effect between the genetic groups and maturation periods
(p = 0.04) 1Vitamins: (+) with vitamin supplementation; (-) without vitamin
supplementation.2Ageing period of 0 and 7 days. 3SEM: standard error of the means.
supplementation, the average values of shear force obtained in our study are within the acceptable range of tenderness, i.e., below 5 kg (BIANCHINI et al., 2007). On the other hand, according to Kerth et al. (2003), MFI equal to or greater than 60 indicate more tender meat, regardless of supplemented breed. In our study, only non-aged LM samples of NEL bulls had MFI lower than 60, suggesting that purebred NEL bulls’ meat have to be aged to reach satisfactory levels of tenderness. It is well documented in the literature that zebu cattle present less tender meat than cattle with 50% European genotype in their composition (ALVES et al., 2005); however, it seems that seven days of ageing is enough to eliminate this difference and improve tenderness of Zebu cattle meat.
The effect of ageing (p > 0.05) on cooking losses was not observed. However, according to the shear force values, LM samples were more tender when aged for seven days (Table 4). This is probably due to the calcium-dependent enzymes that caused a series of alterations in the muscle tissue, reducing meat hardness and gradually increasing its tenderness (PEDREIRA et al., 2003).
Conclusion
Although supplementation of vitamins D and E had increased Ca levels in plasma, it had not interfere with animal performance, carcass characteristics and meat quality of NEL and CAC yearling bulls finished in feedlot. Thus, it is not necessary to supplement vitamins D and E, regardless of breed, when cattle with average initial age of 7-mo-old are fed in feedlots.
When increasing dressing percentage is the main objective, NEL bulls should be used. On the other hand, when the main objective is obtaining more tender meat without ageing, with steaks showing color closer to true red, CAC bulls should be utilized.
References
ALVES, D. D.; GOES, R. H. T. B.; MANCIO, A. B. Maciez da carne bovina. Ciência Animal Brasileira, v. 6, n. 3, p. 135-149, 2005.
ANUALPEC. Anuário da Pecuária Brasileira. São Paulo: Instituto FNP; Agra FNP Pesquisas, 2012. BIANCHINI, W.; SILVEIRA, A. C.; JORGE, A. M.; ARRIGONI, M. D. B.; MARTINS, C. L.; RODRIGUES, E.; HADLICH, J. C.; ANDRIGHETTO, A. Efeito do grupo genético sobre as características de carcaça e maciez da carne fresca e maturada de bovinos superprecoces. Revista Brasileira de Zootecnia, v. 36,
n. 6, p. 2109-2117, 2007.
BLOOMBERG, B. D.; HILTON, G. G.; HANGER, K. G.; RICHARDS, C. J.; MORGAN, J. B.; VANOVERBEKE, D. L. Effects of vitamin E on color stability and palatability of strip loin steaks from cattle fed distillers grains. Journal of Animal Science, v. 89, n. 11, p. 3769-3782, 2011.
CARNAGEY, K. M.; HUFF-LONERGAN, E. J.; TRENKLE, A.; WERTZ-LUTZ, A. E.; HORST, R. L.; BEITZ, D. C. Use of 25-hydroxyvitamin D3 and vitamin
E to improve tenderness of beef from the longissimus dorsi of heifers. Journal of Animal Science, v. 86, n. 7, p. 1649-1657, 2008.
CNCPS-Cornell Net Carbohydrate and Protein System.
The net carbohydrate and protein system for evaluating herd nutrition and nutrients excretion. Version 5.0. Ithaca: USDA, 2000. p. 85-91.
EMMANUEL, D. G. V.; DUNN, S. M.; AMETAJ, B. N. Feeding high proportions of barley grain stimulates an inflammatory response in dairy cows. Journal of Animal Science, v. 91, n. 2, p. 606-614, 2008.
EUCLIDES FILHO, K.; FIGUEIREDO, G. R.; EUCLIDES, V. P. B.; SILVA, L. O. C.; ROCCO, V.; BARBOSA, R. A.; JUNQUEIRA, C. E. Desempenho de diferentes grupos genéticos de bovinos de corte em confinamento. Revista Brasileira de Zootecnia, v. 32, n. 5, p. 1114-1122, 2003. HORWITZ, W. Official methods of analysis of AOAC international. 18th ed. Arlington: AOAC, 2006.
IBGE-Instituto Brasileiro de Geografia e Estatística.
Abates de frangos e suínos e produção de leite e ovos crescem em 2011. 2012. Available from: <http://www.salade
imprensa.ibge.gov.br/noticias?view=noticia&id=1&busca= 1&idnoticia =2107>. Access on: Feb. 15, 2013.
KARAMUCKI, T.; MATGORZATA, J.; RYBARCZYC, A.; SZARUGA, R.; GARDZIELEWSKA, J.; SZYMKOUSKA, W. N. Relationship between CIE L*a*b* and CIE L*C*hscale color parameters determined when applying illuminant c and observer 2° and illuminant d65 and observer 10° and proximate chemical composition and quality traits of porcine longissimus lumborum
muscle. Polish Journal of Food and Nutrition Sciences, v. 15/56, n. 2, p. 129-135, 2006.
KERTH, K. R.; MONTGOMERY, J. L.; MORROW, K. J.; GALYEAN, M. L.; MILLER, M. F. Protein turnover and sensory traits of longissimus muscle from implanted and non-implanted heifers. Journal of Animal Science, v. 81, n. 7, p. 1728-1735, 2003.
KING. D. A.; DIKEMAN, M. E.; WHEELER, T. L.; KASTNER, C. L.; KOOHMARAIE, M. Chilling and cooking rates effects on some myofibrillar determinants of tenderness of beef. Journal of Animal Science, v. 81, n. 6, p. 1473-1481, 2003.
Acta Scientiarum. Animal Sciences Maringá, v. 35, n. 4, p. 403-410, Oct.-Dec., 2013 do cruzamento alternado entre as raças Charolês e
Nelore, terminados em confinamento. Revista Brasileira de Zootecnia, v. 34, n. 3, p. 946-956, 2005. MILLEN, D. D.; PACHECO, R. D. L.; ARRIGONI, M. D. B.; GALYEAN, M. L.; VASCONCELOS, J. T. A snapshot of management practices and nutritional recommendations used by feedlot nutritionists in Brazil. Journal of Animal Science, v. 89, n. 10, p. 3427-3439, 2009.
MONTGOMERY, J. L.; KING, M. B.; GENTRY, J. G.; BARHAM, A. R.; BARHA, M, B. L.; HILTON, G. G.; BLANTON, JR., J. R.; HORST, R. L.; GALYEAN, M. L.; MORROW, JR., K. J.; WESTER, D. B.; MILLER, M. F. Supplemental vitamin D3 concentration and biological type of steers. II. Tenderness, quality, and residues of beef.
Journal of Animal Science, v. 82, n. 7, p. 2092-2104, 2004.
PACHECO, R. D. L.; MILLEN, D. D.; DILORENZO, D.; MARTINS, C. L.; MARINO, C. T.; FOSSA, M. V.; BEIER, S. L.; DICOSTANZO, A.; RODRIGUES, P. H. M.; ARRIGONI, M. D. B. Effects of feeding a multivalent polyclonal antibody preparation on feedlot performance, carcass characteristics, rumenitis, and blood gas profile in Bos indicus biotypes yearling bulls.
Journal of Animal Science, v. 90, n. 6, p. 1898-1909, 2012.
PAGE, J. K.; WULF, D. M.; SCHWOTZER, T. R. A survey of beef muscle color and pH. Journal of Animal Science, v. 79, n. 3, p. 678-687, 2001.
PARRILI, M.; MATSUHARA, S. A.; ARRIGONI, M. D. B.; MARTINS, C. L.; MILLEN, D. D.; PACHECO, R. D. L.; SARTI, L. M. N.; BALDIN, S. R.; PARRA, F. S. Características produtivas de novilhas submetidas à restrição alimentar e dieta suplementada com vitaminas D e E. Pesquisa Agropecuária Brasileira, v. 46, n. 8, p. 920-927, 2011.
PEDREIRA, A. C. M. S.; LUCHIARI FILHO, A.; LEITE, V. B. O.; CARVALHO, M. H. Quality characteristics of Longissimus dorsi muscle from Bos indicus animals treated whit Vitamin D3. Scientia Agricola, v. 60, n. 4, p. 637-642, 2003.
RENTFROW, G.; LINVILLE, M. L.; STAHL, C. A.; OLSON, K. C.; BERG, E. P. The effects of the antioxidant lipoic acid on beef longissimus bloom time. Journal of Animal Science, v. 32, n. 10, p. 3034-3037, 2004.
SILVEIRA, M. F.; BRONDANI, I. L.; ARBOITTE, M. Z.; ALVES FILHO, D. C.; RESTLE, J.; PIZZUTI, L. A. D.; LUZ, T. R. R.; RETORE, M. Composição física e qualidade da carne de novilhos Charolais e Nelore que receberam diferentes proporções de concentrado na dieta. Arquivo Brasileiro de Medicina Veterinária e Zootecnia, v. 61, n. 2, p. 467-474, 2009.
SOUZA, V. L. F.; SILVA, R. S. S. F. Dietary vitamin E supplementation on cholesterol and cholesterol oxides of pig meat and cooked ham. Brazilian Archives of Biology and Technology, v. 49, n. 2, p. 197-205, 2006.
content in small liver biopsy samples in cattle. Journal of Animal Science, v. 88, n. 8, p. 2741-2750, 2010.
Received on October 9, 2012. Accepted on March 5, 2013.