Arq. Bras. Med. Vet. Zootec., v.67, n.6, p.1743-1750, 2015
Live performance, carcass quality, and economic assessment of over 100kg slaughtered pigs
[Desempenho, qualidade de carcaça e avaliação econômica de suínos abatidos acima de 100kg]
E.A. Oliveira1, T.M. Bertol2, A. Coldebela2, J.I. Santos Filho2, A.J. Scandolera3, M.B. Warpechowski3
1Aluno de pós-graduação Universidade Federal do Paraná Curitiba, PR ²EMBRAPA Suíno e Aves Concórdia, SC
3Universidade Federal do Paraná Curitiba, PR
ABSTRACT
Recent genetic improvement has developed pigs with maximum potential for protein deposit at higher weights; however, their optimal slaughter weight still needs to be determined. The objective of the study was to evaluate live performance, carcass traits, and economic viability of 417 Agroceres PIC pigs slaughtered with 100, 115, 130, and 145kg live weight. Pigs were reared in pens with 10-11 barrows and gilts each, offered a feed allowance of 2.8kg/pig/day until the following slaughter weights (SW): 99.65±0.82kg, 118.53±0.98kg, 133.97±1.17kg, and 143.90±1.24. There was no interaction between sex and SW (P>0.05). Backfat thickness, fat area, and loin eye area linearly increased with SW (P<0.001; R2: 70.12-77.44%), and carcass yield increased in a quadratic manner (P<0.001; R²=24.66%). Lean yield was not affected (P>0.05), and feed conversion ratio (R²=43.29%) linearly worsened with SW (P<0.001), but the effect of SW on live production cost (R$/kg) was quadratic, with the minimum point at 134.8kg. It was concluded that, under the applied management, increasing SW results in larger amount of lean tissue with no change in its yield and little effect on growth performance.
Keywords: carcass grading, feed restriction, heavy pigs, pork production
RESUMO
A evolução das linhagens sintéticas de suínos propiciou a obtenção de animais com potencial máximo de deposição proteica em pesos superiores; entretanto o peso ótimo de abate dessas linhagens não é conhecido. O objetivo do estudo foi avaliar o desempenho, características de carcaça e avaliação econômica de 417 suínos da linhagem Agroceres PIC abatidos com 100, 115, 130 e 145kg de peso vivo. Os suínos foram criados em baias com 10-11 machos ou fêmeas, com fornecimento programado de 2,8kg de ração por animal, por dia, a partir de 80kg até os pesos de abate (PA) de 99.65±0.82kg, 118.53±0.98kg, 133.97±1.17kg, e 143.90±1.24. Não houve interação entre sexo e PA (P>0,05). A espessura de toucinho, área de gordura e área de olho de lombo aumentaram linearmente com o PA (P<0,001; R² entre 70,12 e 77,44%), e o rendimento de carcaça aumentou de forma quadrática (P<0,001; R²=24,66%). A porcentagem de carne magra não foi afetada (P>0.05) e a conversão alimentar (R²=43,29%) apresentou discreta piora linear com o PA (P<0,001), mas o efeito sobre o custo de produção (R$/Kg) foi quadrático, com ponto de mínima aos 134,85kg. Conclui-se que, com o manejo utilizado, a elevação do PA resulta em aumento na quantidade de carne produzida sem alteração no seu rendimento e apresenta pouco efeito sobre o desempenho.
Palavras-chave: tipificação, consumo restrito, suíno pesado, produção de carne
INTRODUCTION
In Brazilian pork production, pigs slaughtered at weights higher than 130kg live weight are called “heavy hogs” (Brasil, 2000), since slaughter weight typically ranges between 90 and 120kg. There is a perception, in the pig industry, that heavier slaughter weights may increase carcass fat content and lower feed efficiency (Rosa et al., 2008). However, it has been shown that increasing slaughter weight has little effect on carcass and meat quality, as well as on live performance (Cisneros et al., 1996), particularly in genetic lines selected for high lean gain. In addition, increasing slaughter weight may reduce production costs and improve the efficiency of the production process (Piao et al., 2004).
When pigs from genetic lines with high feed intake reach approximately 100kg live weight, muscle accretion rate is reduced, but not fat deposition rate, resulting in a higher fat to lean ratio in the carcass (Bertol et al., 2001), which may explain the common perception that heavy pigs produce fatter carcasses. However, synthetic genetic lines produce carcasses with high lean content and low backfat thickness (Rosa et al., 2008), and proper feeding management may prevent excessive carcass fat deposition. Adequate feed restriction during the finishing phase allows adjustment of energy intake to achieve maximum protein accretion without excessive fat deposition in the carcass. Moreover, during the growing and finishing phases, cumulative production costs are diluted per kg of pig weight due to their high growth rate and feed efficiency coupled to the lower cost of feed during this phase. The association of these factors suggests that may be possible to increase production efficiency when pigs are slaughtered at heavier weights.
The objective of this study was to evaluate live performance, carcass traits and economic viability of pigs slaughtered with 100, 115, 130, and 145kg live weight fed 2.8kg feed per animal per day after reaching 80kg live weight.
MATERIALS AND METHODS
The experiment was carried out between 2009 and 2010 in two wean-to-finish farms located in the state of Paraná, Brazil. In total, 417 Agroceres PIC (207 sows and 210 barrows) were
evaluated. The protocol of this experiment was approved by the Committee of Ethics on Animal Use for Research of Embrapa Suínos e Aves (protocol n. 004/2010).
Pigs were housed by sex in pens containing 10 or 11 animals each, 125 (63 males and 62 females), 97 (48 males and 49 females), 98 (49 males and 49 females), and 97 (50 males and 47 females) in the 100, 115, 130, and 145kg slaughter groups, respectively. Pens had concrete floors, nipple drinkers, and natural ventilation was controlled using side curtains. A completely randomized block (farm) design and a 4 x 2 factorial arrangement was applied, consisting of four target slaughter weights (100, 115, 130, or 145kg) and two sexes (gilts or barrows), with ten replicates (pens) for live performance evaluation. The experiment started when pigs weighed 80± 0.40kg. Daily feed allowance was 2.8kg per animal divided in three meals. The feed contained 3,306kcal/kg metabolizable energy, 14.79% crude protein, 0.57% calcium, 0.34% total phosphorus, 0.24% available phosphorus, 0.87% total lysine, and 0.74% digestible lysine. Feedstuffs were ground corn (77.5%), soybean meal (19.4%), L-lysine (0.077%), and a commercial vitamin and mineral supplement (3%).
In the beginning of the experiment, pigs were individually weighed and identified by numbered ear tags. Pigs were slaughtered based on live weight meanstandard deviation, and a daily weight gain estimate of 0.8kg/day for the sets of 100, 115, 130, and 145kg live weight. The same procedures were performed in both farms. Feed was weekly weighed and bagged in order to obtain precise feed allowance per pen. In the second farm, pens were split in two during the experiment, and therefore, each pen housed 5-6 instead of 10-12 pigs. Animals were transported to the packing plant in the morning in one farm and in the evening in the second farm after six hours of feed fasting. The packing plant was 80 km distant from the farms, and transport time was of approximately 2h 30min. On the farm, eight hours before transport, the groups weighed 99.65± 0.82kg, 118.53± 0.98kg, 133.97± 1.17kg, and 143.90± 1.24kg, after eight hours of feed fasting and water ad libitum.
were then eviscerated, inspected, and cut by the center of the vertebral column in the caudal-cranial direction. Carcasses with the head were weighed to obtain hot carcass weight. After 12 hours of chilling at approximately 4°C, carcasses were again weighed to determine cold carcass weight.
A cut was made between the last thoracic vertebrae and the first lumbar vertebra of the left half carcass to estimate the fat area, loin eye area, backfat thickness and loin depth, which were calculated by the software program Rhinoceros® 4.0 (Robert Mcneel and Associates, 2007) using loin eye and fat area images scanned with a scale. The borders used for fat area determination were according to the Brazilian Method of Pig Carcass Grading System (ABCS, 1973). Loin depth and backfat thickness were estimate 6 cm from the midline.
Carcass yield was calculated by dividing hot carcass weight by live weight multiplied by 100. Lean percentage (LP) was calculated according to the equation: LP = 58.408 – (0.5886 * backfat thickness) + (0.1739 * muscle thickness) – (0.0189 * hot carcass weight), according to Guidoni et al. (2007). Loin eye area and fat area values refer only to one farm (n=247) with six replicates (pens) of 60 (28 males and 32 females), 62 (29 males and 33 females), 63 (31 males and 32 females) and 62 (32 males and 30 females) animals for the groups slaughtered with 100, 115, 130, and 145kg, respectively.
The economic evaluation was based on the calculation of the production cost per pig weight at slaughter, using variable cost, depreciation, and fixed cost estimates as described in Santos Filho & Talamini (2014). The technological coefficients not collected in the experiment were taken from Martins et al. (2012).
Data were submitted for analysis of variance using the GLM procedure of SAS statistical package (SAS Institute INC, 2011), considering the qualitative effects of slaughter weight, sex, farm, and interaction between sex and slaughter weight. Polynomial contrasts of the first and second order were tested. As the observed average slaughter weight was slightly different from the targeted slaughter weight, the observed average live weight at slaughter was used in the statistical analysis as independent variables in the
polynomial contrasts and in the analysis of regression. Production cost was statistically analyzed by polynomial analysis of regression of the second order using the cost values calculated according to average slaughter weights.
RESULTS AND DISCUSSION
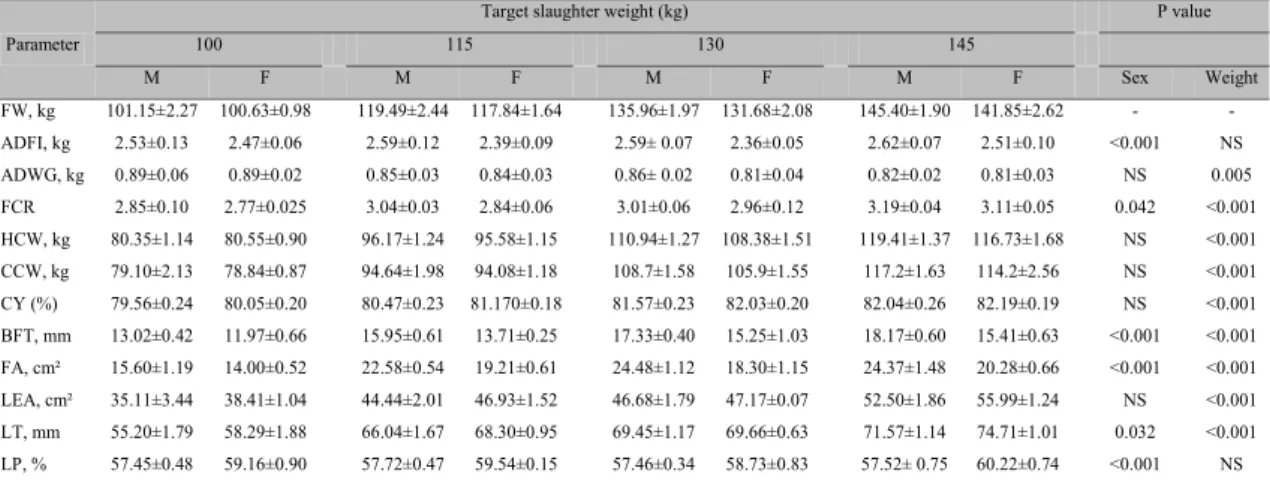
There was no interaction (P>0.05) between sex and slaughter weight for any of the analyzed parameters. Performance and carcass traits means and effects of sex and slaughter weight on live performance and carcass quality are shown in Tab. 1, and the regression parameters are presented in Tab. 2.
Males presented higher daily feed intake (P<0.001), as also observed by other authors (Latorre et al., 2004; Piao et al., 2004; Peinado et al., 2008), which was expected due to the lack of testicular steroid hormone production in barrows. However, there was no influence of sex on daily weight gain (P>0.05). Feed conversion ratio was better in females, in agreement with the findings of Latorre et al. (2004), but not with Cisneros et al. (1996), who did not observe any effect of sex, slaughter weight, or genotype on the feed conversion ratio of pigs slaughtered between 100 and 160kg fed 0.79% lysine. The better feed efficiency observed in gilts is due to the higher daily energy intake of the barrows: at 100kg, barrows consumed 5,986 kcal and gilts 5,788 kcal, and at 145kg barrows consumed 5,690 kcal and gilts 5,327 kcal/day.
There was no influence of slaughter weight on daily average feed intake (P>0.05), which is expected due to the fixed feed allowance adopted during the experimental period. However, other authors also did not find any effect of slaughter weight on feed intake even when no feed restriction was applied (Latorre et al., 2004; Latorre et al., 2008; Peinado et al., 2008).
Piao et al. (2004), on the other hand, did not observe any influence of slaughter weight on weight gain. Feed conversion ratio worsened as slaughter weight increased (P<0.001), which was also observed by other authors (Piao et al., 2004; Latorre et al., 2008; Peinado et al., 2008).
At 80kg live weight, energy requirement for maintenance was estimated as 3,377kcal/day, which increased to 3,861; 4,198; 4,519; and 4,825kcal/day for slaughter weights of 100, 115, 130, and 145, respectively (using 243,6kcal/kg0.60 metabolic body weight, according to Noblet et al., 1999). Because
maintenance energy requirement increased and feed allowance was kept at the same level, the amount of energy supply above maintenance requirements decreased. Therefore, fixed feed allowance explains the influence of slaughter weight on weight gain. The worsening of feed conversion ratio may be attributed to the increase in energy requirement for maintenance and pigs’ growth rate, in which maximum protein deposition in high growth rate genetic lines is reached when animals weigh approximately 100kg. After reaching this weight, there is a tendency towardsfat accumulation (Bertol et al., 2001).
Table 1. Means and standard errors of the effect of sex on live performance parameters and carcass traits of pigs slaughtered between 100 and 145 kg
Parameter
Target slaughter weight (kg) P value
100 115 130 145
M F M F M F M F Sex Weight
FW, kg 101.15±2.27 100.63±0.98 119.49±2.44 117.84±1.64 135.96±1.97 131.68±2.08 145.40±1.90 141.85±2.62 - - ADFI, kg 2.53±0.13 2.47±0.06 2.59±0.12 2.39±0.09 2.59± 0.07 2.36±0.05 2.62±0.07 2.51±0.10 <0.001 NS ADWG, kg 0.89±0.06 0.89±0.02 0.85±0.03 0.84±0.03 0.86± 0.02 0.81±0.04 0.82±0.02 0.81±0.03 NS 0.005 FCR 2.85±0.10 2.77±0.025 3.04±0.03 2.84±0.06 3.01±0.06 2.96±0.12 3.19±0.04 3.11±0.05 0.042 <0.001 HCW, kg 80.35±1.14 80.55±0.90 96.17±1.24 95.58±1.15 110.94±1.27 108.38±1.51 119.41±1.37 116.73±1.68 NS <0.001 CCW, kg 79.10±2.13 78.84±0.87 94.64±1.98 94.08±1.18 108.7±1.58 105.9±1.55 117.2±1.63 114.2±2.56 NS <0.001 CY (%) 79.56±0.24 80.05±0.20 80.47±0.23 81.170±0.18 81.57±0.23 82.03±0.20 82.04±0.26 82.19±0.19 NS <0.001 BFT, mm 13.02±0.42 11.97±0.66 15.95±0.61 13.71±0.25 17.33±0.40 15.25±1.03 18.17±0.60 15.41±0.63 <0.001 <0.001 FA, cm² 15.60±1.19 14.00±0.52 22.58±0.54 19.21±0.61 24.48±1.12 18.30±1.15 24.37±1.48 20.28±0.66 <0.001 <0.001 LEA, cm² 35.11±3.44 38.41±1.04 44.44±2.01 46.93±1.52 46.68±1.79 47.17±0.07 52.50±1.86 55.99±1.24 NS <0.001 LT, mm 55.20±1.79 58.29±1.88 66.04±1.67 68.30±0.95 69.45±1.17 69.66±0.63 71.57±1.14 74.71±1.01 0.032 <0.001 LP, % 57.45±0.48 59.16±0.90 57.72±0.47 59.54±0.15 57.46±0.34 58.73±0.83 57.52± 0.75 60.22±0.74 <0.001 NS
M =male; F = female; FW = final weight; ADFI = average daily feed intake; ADWG = average daily weight gain; FCR = feed conversion ratio; HCW = hot carcass weight; CCW = cold carcass weight; CY = carcass yield; BFT = backfat thickness; FA = fat area; LEA = loin eye area; LT = loin thickness; LP = lean percentage.
Table 2. Parameters of the polynomial analysis of regression of live performance parameters and carcass traits of pigs slaughtered between 100 and 145kg
Dependent variable
Parameter estimates Pr>F
R2 Residual
error
Intercept Linear Quadratic Linear Quadratic
Males Females
ADFI, kg - - - - NS NS - -
ADWG, kg 0.999 0.999 -0.001 - 0.0015 NS 61.67 0.05
FCR 2.158 2.070 0.007 - <0.001 NS 43.29 0.15
HCW, kg -13.354 -13.354 0.981 -0.0005 <0.001 0.04 98.67 1.96
CCW, kg -7.382 -7.382 0.857 - <0.001 NS 99.67 0.86
CY (%) 65.921 65.921 0.205 -0.0006 <0.001 <0.001 24.66 1.56
BFT, mm 3.899 2.111 0.097 - <0.001 NS 70.12 1.34
FA, cm² 0.905 -2.426 0.164 - <0.001 NS 77.44 1.96
LEA, cm² 2.252 2.252 0.348 - <0.001 NS 75.99 3.52
LT, mm -73.946 -71.232 1.931 -0.006 0.001 0.004 86.83 2.63
LP, % - - - - NS NS - -
In general, the influence of slaughter weight on performance was moderate and the obtained effects were weak, possibly because the pigs used in the experiment derived from commercial genetic lines selected for lean deposition and also due to the restricted feed allowance. These results suggest that, under the conditions and the weight range used in this experiment, slaughter weight has little influence on live performance.
There was no effect of sex (P>0.05) on hot carcass weight, cold carcass weight, carcass yield, and loin eye area. The lack of influence of sex on carcass yield was also observed by other authors (Cisneros et al., 1996; Piao et al., 2004; Correa et al., 2006; Latorre et al., 2008; Peinado et al., 2008). Some studies reported greater loin eye area in females (Martin et al., 1980; Cisneros et al., 1996; Piao et al., 2004), which may be partially explained by genotype. Using pigs of the same genetic type as those of the present study, Rosa et al. (2008) did not find any effect of sex on the loin eye area of pigs slaughtered at 45, 69, 96, and 124kg.
Greater backfat thickness in barrows (P<0.001) observed in the present study were largely reported in literature (Latorre et al., 2004; Piao et al., 2004; Latorre et al., 2008; Peinado et al., 2008). This effect, as well as larger fat area, is expected because barrows present higher feed intake than gilts (Costa et al., 2005) and do not produce testicular steroids, therefore deposit more adipose tissue. As one of the parameters used to calculate lean percentage is backfat thickness, higher values were obtained in gilts (P<0.001). This was also reported by Piao et al. (2004), who evaluated [Landrace x Yorkshire] x Duroc pigs slaughtered with 100-130kg.
Despite the quadratic effect of slaughter weight on hot carcass weight (P<0.05), with the maximum point obtained with pigs slaughtered at 145kg, the behavior of the curve was similar to the linear effect. Cisneros et al. (1996) reported a linear increase of 0.808kg in hot carcass weight for each kg increase in slaughter weight. The linear increase obtained in cold carcass weight (0.857) were greater than those observed by Cisneros et al. (1996), of 0.794kg per kg of increase in live weight.
The maximum point of carcass yield was obtained when pigs weighed approximately
145kg at slaughter, with an average value of 82.11% for barrows and gilts (P<0.001). Literature reports linear increase in carcass yields ranging between 0.03 and 0.086% per kg of slaughter weight increase (Irgang and Protas, 1986; Cisneros et al., 1996; Latorre et al., 2004; Latorre et al., 2008) in pigs slaughtered between 80 and 160kg. The viscera growth rate is proportionally lower than carcass growth rate (Gu et al., 1992) and it indicates an increase of commercial value per slaughtered pig, as offal have low market value.
There was a linear increase in backfat thickness (P<0.001). However, the obtained value (0.097) was lower than those described in literature, which ranged between 0.11 and 0.24 mm per kg of slaughter weight increase (Irgang and Protas, 1986, Cisneros et al., 1996; Dutra Jr. et al., 2001; Latorre et al., 2004; Latorre et al., 2008). The restricted feed allowance reduced energy intake above maintenance requirements, thereby promoting lower fat deposition compared with other studies. In addition, the pig genotype selected for high lean deposition in the present experiment also contributed to the lower backfat thickness values observed.
The increase in fat area (P<0.001) observed with increasing slaughter weight in this study (0.164cm2) was nearly half than that reported by Irgang and Protas (1986), which was of 0.242cm2 (R²=80.4%) in Landrace x Large White crossbred pigs slaughtered between 80 and 140kg. There was a quadratic effect (P<0.001) of slaughter weight on loin thickness, with maximum point obtained in pigs slaughtered at approximately 145kg (71.57mm for barrows and 74.71mm for gilts).
The linear increase in loin eye area (0.348cm², P<0.001) observed in this study was similar to that observed by Dutra Jr. et al. (2001), who reported a gain of 0.370cm² per kg of slaughter weight increase (R²=98%) in pigs from a high growth rate genetic line slaughtered between 50 and 120kg. On the other hand, Cisneros et al. (1996) observed lower values, of 0.183cm² per kg of slaughter weight increase.
restriction, as studied by Fraga et al. (2008a). The authors observed that the increase in levels of qualitative restriction produced an increase of lean meat in pigs slaughtered with 128kg.
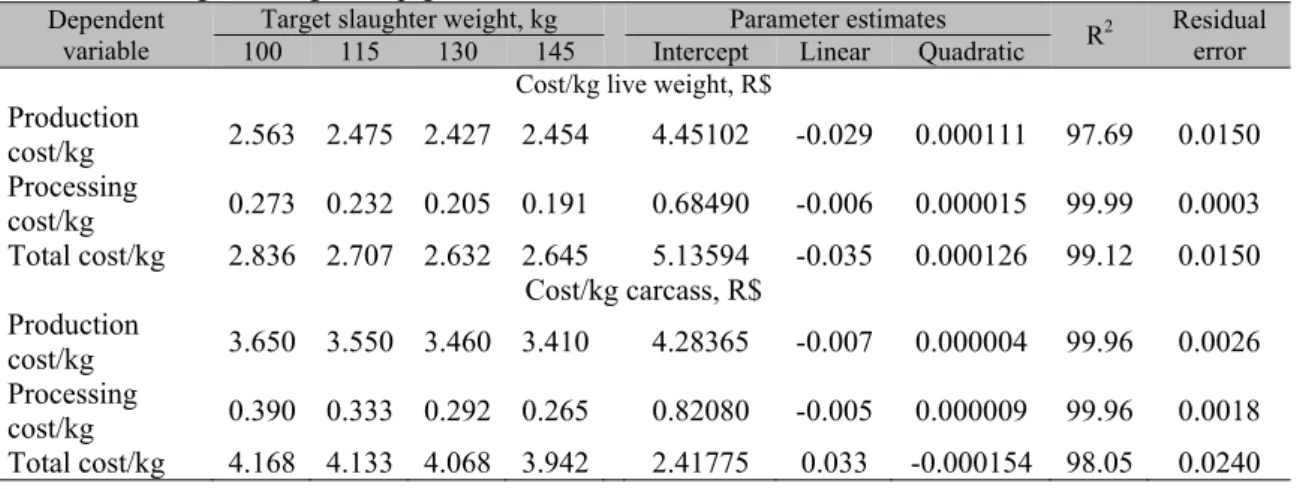
Calculated live production costs were 2.56, 2.47, 2.43, and 2.45 R$/kg live weight for average slaughter weights of 99.65±0.82kg, 118.53±0.98kg, 133.97±1.17kg, and 143.90±1.24kg, respectively, presenting a quadratic behavior (P<0.001) with minimum point estimated at 134.8kg (Tab. 3). Considering that the cost at the typical slaughter weight of 100kg was the highest, this indicates that increasing slaughter weight may be economically interesting for the producer. Consistent results were obtained by Pinheiro et al. (1983) and Santos Filho et al. (2001), concluding that the typical slaughter weight may not provide maximum profitability.
In addition to lower live production costs, heavier slaughter weights also reduce processing costs (Tab. 3). According to estimates of Embrapa Suínos e Aves, live cost represents 65% of the total production costs in large-scale processing systems. The increase in slaughter weight significantly reduces processing costs because, using the same amount of resources, it is possible to increase the volume of meat produced. Also, heavier slaughter weights also increase carcass yield, which additionally reduces cost per kg of carcass. Considering a processing cost of R$ 27.50 per pig, total production cost (live + processing costs) was
initially reduced to 134.8kg of SW, which was the point of minimal cost; however, from this point on it increased to 145kg SW. Nevertheless, when estimating carcass production cost, the cost per kg was reduced up to the heaviest slaughter weight due to the increase in carcass yield.
Although the effect of increasing slaughter weight on production costs is evident, this is not the case of revenues. Compared to further-processed products, heavier slaughter weights, and consequently heavier carcasses and higher total meat volume, may increase revenues. However, the rejection of consumers of larger cuts must be taken into consideration. Other factors also should be taken into account, such as problems with the handling of heavy carcasses in the processing plants, and the size and quality of cuts destined for further processing or to be sold fresh.
Piao et al. (2004) worked with pigs slaughtered with 100, 110, 120, and 130kg and obtained higher net revenues when pigs were slaughtered with 110 and 120kg live weight. It should be mentioned, however, that these authors did not apply feed restriction, which considerably increased feeding costs of pigs slaughtered with 130kg, thereby reducing their net revenue. The effect of feed restriction on revenues was studied by Fraga et al. (2008b), who described 0.5-2.8% increases in net revenue in pigs submitted to qualitative feed restriction of 0, 5, 10, 15 and 20 %.
Table 3. Live production cost and processing cost per kg of live weight and per kg of carcass weight as a function of slaughter weights of pigs
Dependent
variable 100 Target slaughter weight, kg 115 130 145 Intercept Parameter estimates Linear Quadratic R2 Residual error Cost/kg live weight, R$
Production
cost/kg 2.563 2.475 2.427 2.454 4.45102 -0.029 0.000111 97.69 0.0150 Processing
cost/kg 0.273 0.232 0.205 0.191 0.68490 -0.006 0.000015 99.99 0.0003 Total cost/kg 2.836 2.707 2.632 2.645 5.13594 -0.035 0.000126 99.12 0.0150
Cost/kg carcass, R$ Production
cost/kg 3.650 3.550 3.460 3.410 4.28365 -0.007 0.000004 99.96 0.0026 Processing
CONCLUSIONS
Increasing slaughter weight above 100kg under the applied feed restriction program, moderately impaired growth performance but it increased the amount of meat produced with no change in its yield up to 145kg live weight. The lowest live production cost was obtained when pigs were slaughtered with 134.8kg but the carcass production cost reduced up to the heaviest slaughter weight. The slaughter weight that determines the economically optimal point for the entire production chain may vary according to the growth performance, meat yield, price of inputs, sales price and to the acceptance of the product by the consumers.
ACKNOWLEDGEMENTS
Partially supported by CAPES-PNPD and CAPES-COFECUB 687/10 projects. The first author thanks CAPES and Fundação Araucaria for supporting his postgraduate program.
REFERENCES
BERTOL, T.M.; LUDKE, J.V.; BELLAVER, C. Efeito do peso do suíno em terminação ao início da restrição alimentar sobre o desempenho e a qualidade da carcaça. Rev. Bras. Zootec., v.30, p.417-424, 2001.
BRASIL. Ministério da Agricultura, Pecuária e Abastecimento. Instrução Normativa nº 22, de 31 de julho de 2000. Regulamento Técnico de Identidade e Qualidade do Presunto Tipo Parma. Diário Oficial [da República Federativa do Brasil], Brasília, DF, 03 ago. 2000. Seção 1, p.15-28.
CISNEROS, F.; ELLIS, M.; MCKEITH, F.F. et al. Influence of slaughter weight on growth and carcass characteristics, commercial cutting and curing yields, and meat quality of barrows and gilts from two genotypes. J. Anim. Sci., v.74, p.925-933, 1996.
CORREA, J.A.; FAUCITANO, L.; LAFOREST, J.J. et al. Effects of slaughter weight on carcass composition and meat quality in pigs of two different growth rates. Meat Sci., v.72, p.91-99, 2006.
COSTA, M.C.R.; SILVA, C.A.; PINHEIRO, J.W. et al. Utilização da torta de girassol na alimentação de suínos nas fases de crescimento e terminação: efeitos no desempenho e nas características de carcaça. Rev. Bras. Zootec., v.24, p. 1581-1588, 2005.
DUTRA JR., W.M.; FERREIRA, A.S.; TAROUCO, J.U. et al. Estimativa de rendimentos de cortes comerciais e de tecidos de suínos em diferentes pesos de abate pela técnica de ultra-sonografia em Tempo Real. Rev. Bras. Zootec., v.30, p.1243-1250, 2001.
FRAGA, A.L., THOMAZ, M.C., KRONKA, R.N. et al. Restrição alimentar qualitativa para suínos com elevado peso de abate. Rev. Bras. Zootec., v.37, p.869-875, 2008a.
FRAGA, A.L., THOMAZ, M.C., MARTINS, M.I.E.G. et al. Avaliação econômica do uso da restrição alimentar qualitativa para suínos com elevado peso de abate. Rev. Bras. Zootec., v.37, p.1050-1054, 2008b.
GU, Y.; SCHINCKEL, A.P.; MARTIN, T.G. Growth, development, and carcass composition in five genotypes of swine. J. Anim. Sci., v.70, p.1719-1729, 1992.
GUIDONI, A.L.; DALLACOSTA, O.A.; BERTOL, T.M. Preditores e predição do peso, porcentagem e quantidade de carne de carcaça suínas e suas partes. Concórdia: Embrapa Suínos e Aves, 2007. 70p. (Relatório Técnico).
IRGANG, R.; PROTAS, J.F.S. Peso ótimo de abate de suínos. II. Resultados de carcaça. Pesqui. Agropecu. Bras., v.21, p.1337-1345, 1986.
LATORRE, M.A.; LÁZARO, R.; VALENCIA, D.G. et al. The effects of gender and slaughter weight on the growth performance, carcass traits, and meat quality characteristics of heavy pigs. J. Anim. Sci., v.82, p.526-533, 2004.
MARTINS, F.M.; SANTOS FILHO, J.I.; SANDI, A.J. et al. Coeficientes técnicos para o cálculo do custo de produção de suínos. Concórdia: Embrapa Suínos e Aves, 2012. 36p. (Comunicado Tecnico, 506).
MÉTODO brasileiro de classificação de carcaças. Estrela: ABCS, 1973, 17p.
NOBLET, J.; KAREGE, C.; DUBOIS, S.; VAN MILGEN, J. Metabolic utilization of energy and maintenance requirements in growing pigs: effects of sex and genotype. J. Anim. Sci., v.77, p.1208-1216, 1999.
PEINADO, J.; MEDEL, P.; FUENTETAJA, A.; MATEOS, G.G. Influence of sex and castration of females on growth performance and carcass and meat quality of heavy pigs destined for dry-cured industry. J. Anim. Sci., v.86, p.1410-1417, 2008.
PIAO, J.R.; TIAN, J.Z.; KIM, B.G. et al. Effects of sex and market weight on performance, carcass characteristics and pork quality of market hogs. Asian Australas. J. Anim. Sci., v.17, p.1452-1458, 2004.
PINHEIRO, A.C.A.; PROTAS, J.F.S.; IRGANG, R. A função de produção e a relação de preços insumo-produto, como determinantes do peso ótimo de abate de suínos. Rev. Econ. Sociol. Rural, v.3, p.371-379, 1983.
RHINOCEROS. versão 4.0. Seatle: McNeel North America, 2007.
ROSA, A.F; GOMES, J.D.F.; MARTELLI, M.R. et al. Características de carcaça de suínos de três linhagens genéticas em diferentes idades ao abate. Cienc. Rural, v.38, p. 1718-1724, 2008. SANTOS FILHO, J.I.; PINHEIRO, A.A.C.; BERTOL, T.M.; LUDKE, J.V. Avanço tecnológico e alteração no peso ótimo de abate de suínos. Concórdia: Embrapa/CNPSA, 2001.
Disponível em:
<www.cnpsa.embrapa.br/sgc/sgc_artigos/artigos _o8t704c.html/>. Acessado em: 29 ago. 2011. SANTOS FILHO, J.I.; TALAMINI, D.J.D. Custo de produção de frangos: teoria, prática e implicações. In: MACARI, M.; MENDES, A.A.; MENTEN, J.F.M.; NÄÄS, I.A. (Eds.). Produção de frangos de corte. 2.ed. Campinas: FACTA, 2014. p.495-516.