(Annals of the Brazilian Academy of Sciences)
Printed version ISSN 0001-3765 / Online version ISSN 1678-2690 www.scielo.br/aabc
Assessment of the scientific-technological production in molecular biology
in Brazil (1996-2007): the contribution of genomics programs
ROGÉRIO MENEGHINI1,2,3 and ESTÊVÃO C. GAMBA2 1SciELO/Fundação de Apoio à Universidade Federal de São Paulo/UNIFESP
Rua Dr. Diogo de Faria, 1087, 8◦andar, cj. 801, Vila Clementino, 04037-003 São Paulo, SP, Brasil
2Departmento de Informática Médica, Universidade Federal de São Paulo/UNIFESP Rua Botucatu, 862, 04023-901 São Paulo, SP, Brasil
3Fundação de Apoio à Universidade Federal de São Paulo/FapUNIFESP
Rua Dr. Diogo de Faria, 1087, 8◦andar, cj. 801, Vila Clementino, 04037-003 São Paulo, SP, Brasil
Manuscript received on July 8, 2010; accepted for publication on December 1, 2010
ABSTRACT
Several genome sequencing programs were launched in Brazil by the end of the nineties and the early 2000s. The most important initiatives were supported by the ONSA program (http://watson.fapesp.br/onsa/Genoma3.htm) and aimed at gaining domain in genomic technology and bringing molecular biology to the state of art. Two main sets of data were collected in the 1996-2007 period to evaluate the results of these genome programs: the scientific production (Scopus and Web of Science databases) and the register of patents (US Patent and Trademark Office), both related to the progress of molecular biology along this period. In regard to the former, Brazil took a great leap in com-parison to 17 other developed and developing countries, being only surpassed by China. As to the register of patents in the area of molecular biology, Brazil’s performance lags far behind most of the countries focused in the present study, confirming the Brazilian long-standing tendency of poor achievements in technological innovations when com-pared with scientific production. Possible solutions to surpass this inequality are discussed.
Key words:science assessment, genomics, scientometrics, molecular biology.
INTRODUCTION
Molecular biology of the gene is an area of contempo-rary science that permeates several other areas of life sciences. Its concepts and methods have been, for histor-ical reasons, slowly absorbed by the Brazilian Scientific community. For example, in the period of 1965-1975 the ISI-Thomson Reuters database registered 24 articles published in Brazil in this area, involving approximately ten groups (search for key words expression described below). The authors belonged mainly to the areas of cytology and biochemistry, and the tendency was for a more descriptive study. In the same period, the United States published 6439 articles and a great number of
Correspondence to: Rogério Meneghini E-mail: rogerio.meneghini@scielo.org
them came from laboratories with competent groups in genetics, microbiology, virology and enzymology, which were the truly propelling areas of studies in mo-lecular biology of the gene (Judson 1979). The lack of research groups in Brazil with proficiency in these areas was certainly a decisive factor for the slow progress of molecular biology in the following decades.
state of São Paulo, in view that it was the first one to launch these programs through the ONSA-FAPESP initiative (http://watson.fapesp.br/onsa/Genoma3.htm). In defense of the implementation of the ONSA geno-mics programs, there was the proposal of rescuing mo-lecular biology (Perez 2002), maybe more important than genome sequencings themselves. The success of the latter is evident through the publications that they originated. What is less clear is how much such ef-fort meant in terms of a molecular biology advance in Brazil. The recovery of information related to the national scientific production shows that the molecu-lar biology area has achieved a very meaningful growth in Brazil. The fact that countries that had not launched genomics programs did not reach such leaps in molecu-lar biology publications reinforces the assumption that Brazilian genomic programs (Simpson et al. 2000, Silva et al. 2002, Brazilian Genome Project Consortium et al. 2003) were fundamental for this progress. However, no technological spin off developments occurred parallel-ing the scientific progress and, therefore, the great im-pulse in molecular biology had no impact in terms of technological innovations.
METHODOLOGY
In order to retrieve scientific publications related to the molecular biology area, the SCOPUS database has been used. It was selected for its large coverage of high-impact journals in life sciences. The use of ISI-Thomson Reuters database was impaired due to the limited results displayed on-line. For example, it does not supply figures that outnumber 100,000 articles (case of the USA and China annual production). However, in one specific case, the SCOPUS and ISI-Thomson Reuters databases results were compared.
In order to recover such results, 1996 was adopted as the initial year, for that is the beginning of the Sco-pus database operational year and because the Brazil-ian genome programs were launched in the end of this decade. Data compilation occurred in August, 2008.
The expression “RNA OR DNA OR (MOLECU-LAR BIOLOGY) OR PCR” was employed for the search of texts that had at least one of these key-words. This search strategy was defined due to the fact that it is extremely comprehensive when compared to a great
number of alternative expressions that have been tested. The results were distributed according to their authors’ origin, which was sub-divided into four country groups: Latin-American countries (Argentina, Brazil, Chile and Mexico), developed countries (Germany, United States, United Kingdom, Japan, France and Canada); Asian and African emerging countries (South Africa, China, South Korea and India); and East European countries (Poland, Hungary and the Czech Republic). Finally, the results related to the scientific production in molecular biology in each of these countries were compared to the total sci-entific production in order to find clues for the progress of molecular biology research in each country.
In order to assess the scientific production impact on technological innovation, the registration of patents at the American United States Patent and Trademark Office (USPTO) was used. The covered period was also from 1996 to 2007.
TOTAL SCIENTIFIC PRODUCTION GROWTH AND MOLECULAR BIOLOGY GROWTH IN BRAZIL,
IN CONNECTION TO THE INTERNATIONAL SCIENTIFIC PRODUCTION (1996-2007)
BRAZIL IN THECONTEXT OFLATIN-AMERICAN
COUNTRIES
Brazil occupies the leading position in the Latin-Amer-ican context, where the scientific production growth rate in the period from 1996 to 2007 is considered. Accord-ing to Table I, the Brazilian scientific production in this period increased 236%, followed by the production of Chile, Mexico and Argentina, which showed increases of 170%, 103% and 75%, respectively.
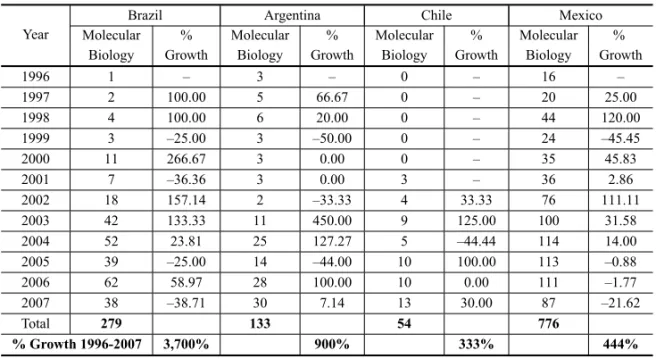
When the scientific production growth rate in mo-lecular biology is analyzed, Brazil also holds the first place in the rank, with an even more dramatic increase of 434% in the 1996-2007 period, followed by Chile, Argentina and Mexico, with increases of 228%, 202% and 160%, respectively (Table II).
BRAZIL INCOMPARISON WITHDEVELOPEDCOUNTRIES
TABLE I
Growth of total scientific production in Brazil, Mexico, Argentina and Chile, on SCOPUS database (1996-2007).
Year Brazil Mexico Argentina Chile
Total % Growth Total % Growth Total % Growth Total % Growth
1996 8,593 – 6,447 – 4,077 – 1,736 –
1997 10,289 19.74 6,915 7.26 4,603 12.90 1,866 7.49
1998 11,413 10.92 7,240 4.70 4,656 1.15 1,804 –3.32
1999 12.391 8.57 7,631 5.40 4,902 5.28 2,040 13.08
2000 13,388 8.05 7,713 1.07 5,212 6.32 2,034 –0.29
2001 13,698 2.32 7,901 2.44 5,211 –0.02 2,109 3.69
2002 15,804 15.37 8,538 8.06 5,514 5.81 2,528 19.87
2003 18,099 14.52 10,049 17.70 5,878 6.60 3,035 20.06
2004 20,252 11.90 11,272 12.17 6,019 2.40 3,285 8.24
2005 22,499 11.10 12,615 11.91 6,299 4.65 3,682 12.09
2006 27,376 21.68 13,630 8.05 6,894 9.45 4,504 22.32
2007 28,841 5.35 13,070 –4.11 7,150 3.71 4,684 4.00
Total 202,643 113,021 66,415 33,307
% Growth 1996-2007 236% 103% 75% 170%
TABLE II
Growth of scientific production in molecular biology in Brazil, Mexico, Argentina and Chile, on SCOPUS database (1996-2007).
Year
Brazil Mexico Argentina Chile
Molec. % Molec. % Molec. % Molec. %
Biology Growth Biology Growth Biology Growth Biology Growth
1996 361 – 303 – 197 – 82 –
1997 410 13.57 352 16.17 220 11.68 75 –8.54
1998 571 39.27 359 1.99 246 11.82 93 24.00
1999 653 14.36 387 7.80 231 –6.10 116 24.73
2000 763 16.85 430 11.11 293 26.84 121 4.31
2001 721 –5.50 457 6.28 352 20.14 131 8.26
2002 948 31.48 495 8.32 389 10.51 145 10.69
2003 1,203 26.90 649 31.11 456 17.22 202 39.31
2004 1,349 12.14 647 –0.31 464 1.75 228 12.87
2005 1,397 3.56 749 15.77 475 2.37 243 6.58
2006 1,749 25.20 778 3.87 545 14.74 257 5.76
2007 1,928 10.23 787 1.16 595 9.17 269 4.67
Total 12,053 6,393 4,463 1,962
% Growth 1996-2007 434% 160% 202% 228%
236%, followed by Canada with 54%, United Kingdom with 42%, Germany with 38%, France with 35%, Japan with 16% and the United States with 12% (Table III).
In molecular biology, the Brazilian growth of 434% (Table II) is even more highlighted when com-pared to developed countries: Germany with 62%, Canada with 57%, United Kingdom with 40%, Japan with 35%, France with 27% and the United States with 20% (Table IV).
BRAZIL IN THESCENERY OFRAPIDLY
DEVELOPINGCOUNTRIES
Brazil holds the first place in previous ranks of scientific production, but here it falls to third place. At any rate, Chinese, South Korean and Brazilian predominance in science growth all over the world is evident.
If we compare the Brazilian scientific production in molecular biology to the production of developing countries, we may observe that Brazil holds the sec-ond place in the rank with a total of 434%, presenting lower results than China, which has reached an increase of 1243% (Table VI). South Korea is behind Brazil in this area, with 354%, followed by India with 324% and South Africa with 175%.
BRAZIL ANDEASTEUROPEANCOUNTRIES
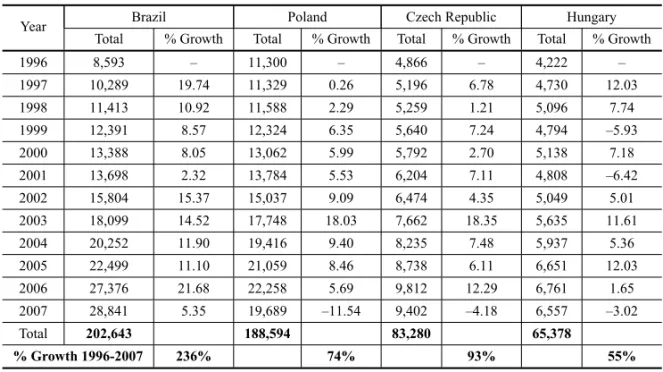
When compared to East European countries, the Brazil-ian scientific production growth reached 236%, more than the double increase presented by the Czech Re-public, with 93%. After it comes Poland with 74% and Hungary with 55% (Table VII).
In molecular biology, the difference between Brazil and East European countries decreased, but its produc-tion growth remains more expressive than the growth presented by Poland, the Czech Republic and Hungary (Table VIII).
TOTAL AND MOLECULAR BIOLOGY SCIENTIFIC PRODUCTION GROWTHS IN THE STATE OF SÃO PAULO
(SCOPUS AND ISI DATABASES)
São Paulo was the pioneering state in genome projects through the ONSA program of FAPESP. A network was organized for this purpose, which encompassed over one hundred scientists from more than forty in-stitutions of the São Paulo State (Simpson et al. 2000; Silva et al. 2002, Brazilian Genome Project Consortium et al. 2003). With the aim of focusing the state of São Paulo production, it was chosen to compare publication data from Scopus and ISI-Thomson Reuters databases in this case. Here, besides the expression “RNA OR DNA OR (MOLECULAR BIOLOGY) OR PCR”, the origin (SÃO PAULO or SP and BRASIL or BRAZIL) was also considered in the searches.
In order to view all the data obtained in SCOPUS and ISI databases, the results were presented in charts placed side by side. As it has already been mentioned above, the non-use of the ISI database for studies with
countries was due to the fact that the standard database available at the Internet does not allow for definition of figures that outnumber 100,000 (e.g., the USA and China annual production).
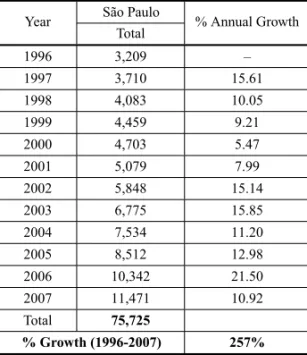
The scientific production evolution in the state of São Paulo recovered from the SCOPUS database showed an increase of 257% in the 1996-2007 period (Table IX). In the ISI database, the increase was of 218% (Table X). The increase of 257% was a little higher than the Brazilian increase (236%) in the same period (SCOPUS database, Table I).
In molecular biology, the scientific production in the state of São Paulo had expressive increases of 515% on the SCOPUS database (Table XI) and of 468% on the ISI database (Table XII). Therefore, the SCOPUS database reveals that, in this area, the São Paulo scientific production increase was 19% higher than the Brazilian one (Table II).
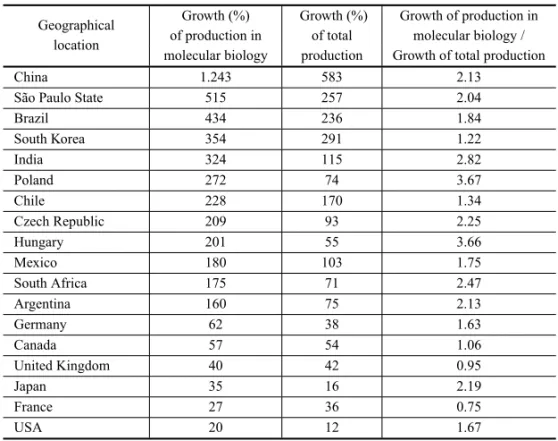
Table XIII provides a summary chart of the total scientific production and in molecular biology, com-paring Brazil, the state of São Paulo and 16 selected countries. China, as we have already seen, has had an impressive increase of 1,243% in molecular biology in the 1996-2007 period. In 1995, China defined the Bio-Technology area as its priority number 1 in the National Plan for High Technology, among the 7 areas that had been selected as priorities (Zhangliang and Li-Jia 1997). Resources and efforts were higher than the ones from any other emerging country, and this fact may explain the great progress they reached in this area.
The Brazilian growth in molecular biology is also impressive (434%), reaching the second place among the countries in the present study. The state of São Paulo was highlighted in Table XIII due to its pioneer-ing genome sequencpioneer-ing programs that have certainly influenced the advance of molecular biology, being higher than the Brazilian average (515%). It is difficult to find another explanation for the advances of molecu-lar biology in Brazil and, more specifically, in the state of São Paulo.
TABLE V
Growth of scientific production of Brazil and Asian and African emerging countries, on SCOPUS database (1996-2007).
Year China India South Korea Brazil South Africa
Total % Growth Total % Growth Total % Growth Total % Growth Total % Growth
1996 28,484 – 20,490 – 9,745 – 8,593 – 4,172 –
1997 31,236 9.66 21,058 2.77 11,933 22.45 10,289 19.74 4,237 1.56
1998 36,463 16.73 21,698 3.04 12,647 5.98 11,413 10.92 4,362 2.95
1999 37,632 3.21 22,846 5.29 14,665 15.96 12,391 8.57 4,514 3.48
2000 45,852 21.84 23,284 1.92 16,532 12.73 13,388 8.05 4,381 –2.95
2001 60,936 32.90 24,280 4.28 18,557 12.25 13,698 2.32 4,473 2.10
2002 62,256 2.17 25,990 7.04 19,651 5.90 15,804 15.37 4,980 11.33
2003 74,896 20.30 29,972 15.32 24,777 26.09 18,099 14.52 5,329 7.01 2004 111,274 48.57 32,311 7.80 29,126 17.55 20,252 11.90 5,899 10.70 2005 157,893 41.90 36,403 12.66 33,767 15.93 22,499 11.10 6,474 9.75 2006 181,041 14.66 40,981 12.58 37,324 10.53 27,376 21.68 7,152 10.47
2007 194,436 7.40 44,135 7.70 38,073 2.01 28,841 5.35 7,148 –0.06
Total 1,022,399 343,448 266,797 202,643 63,121
% Growth 1996-2007 583% 115% 291% 236% 71%
TABLE VI
Growth of scientific production in molecular biology of Brazil and Asian and African developing countries, on SCOPUS database (1996-2007).
Year
China India South Korea Brazil South Africa
Molec. % Molec. % Molec. % Molec. % Molec. %
Biology Growth Biology Growth Biology Growth Biology Growth Biology Growth
1996 794 – 548 – 677 – 361 – 172 –
1997 994 25.19 563 2.74 766 13.15 410 13.57 189 9.88
1998 1,400 40.85 669 18.83 966 26.11 571 39.27 196 3.70
1999 1,795 28.21 692 3.44 1,070 10.77 653 14.36 212 8.16
2000 2,528 40.84 780 12.72 1,249 16.73 763 16.85 256 20.75
2001 3,168 25.32 941 20.64 1,436 14.97 721 –5.50 282 10.16
2002 4,116 29.92 1,097 16.58 1,550 7.94 948 31.48 291 3.19
2003 5,683 38.07 1,346 22.70 2,070 33.55 1,203 26.90 367 26.12
2004 7,336 29.09 1,528 13.52 2,336 12.85 1,349 12.14 367 0.00
2005 8,883 21.09 1,830 19.76 2,761 18.19 1,397 3.56 422 14.99
2006 9,979 12.34 2,125 16.12 2,927 6.01 1,749 25.20 471 11.61
2007 10,666 6.88 2,323 9.32 3,072 4.95 1,928 10.23 473 0.42
Total 57,342 14,442 20,880 12,053 3,698
% Growth 1996-2007 1243% 324% 354% 434% 175%
impulse in technological innovation, holding the fourth place in the world in deposits of patents in the US Patent Office, only behind the USA, Japan and Germany. How-ever, as opposed to China and Brazil, there was not any special effort in the molecular biology and bio-techno-logy areas, and the investments were primordially aimed to the engineering, physics and chemistry areas.
se-TABLE VII
Growth of scientific production in Brazil and East European countries on SCOPUS database (1996-2007).
Year Brazil Poland Czech Republic Hungary
Total % Growth Total % Growth Total % Growth Total % Growth
1996 8,593 – 11,300 – 4,866 – 4,222 –
1997 10,289 19.74 11,329 0.26 5,196 6.78 4,730 12.03
1998 11,413 10.92 11,588 2.29 5,259 1.21 5,096 7.74
1999 12,391 8.57 12,324 6.35 5,640 7.24 4,794 –5.93
2000 13,388 8.05 13,062 5.99 5,792 2.70 5,138 7.18
2001 13,698 2.32 13,784 5.53 6,204 7.11 4,808 –6.42
2002 15,804 15.37 15,037 9.09 6,474 4.35 5,049 5.01
2003 18,099 14.52 17,748 18.03 7,662 18.35 5,635 11.61
2004 20,252 11.90 19,416 9.40 8,235 7.48 5,937 5.36
2005 22,499 11.10 21,059 8.46 8,738 6.11 6,651 12.03
2006 27,376 21.68 22,258 5.69 9,812 12.29 6,761 1.65
2007 28,841 5.35 19,689 –11.54 9,402 –4.18 6,557 –3.02
Total 202,643 188,594 83,280 65,378
% Growth 1996-2007 236% 74% 93% 55%
TABLE VIII
Growth of scientific production in molecular biology – Brazil and East European countries; on SCOPUS database (1996-2007).
Year Brazil Poland Czech Republic Hungary
BM % Growth BM % Growth BM % Growth BM % Growth
1996 361 – 318 – 247 – 187 –
1997 410 13.57 470 47.80 241 –2.43 249 33.16
1998 571 39.27 501 6.60 264 9.54 296 18.88
1999 653 14.36 593 18.36 303 14.77 313 5.74
2000 763 16.85 612 3.20 353 16.50 330 5.43
2001 721 –5.50 766 25.16 404 14.45 305 –7.58
2002 948 31.48 851 11.10 451 11.63 357 17.05
2003 1,203 26.90 1,055 23.97 565 25.28 466 30.53
2004 1,349 12.14 1,115 5.69 630 11.50 491 5.36
2005 1,397 3.56 1,238 11.03 623 –1.11 530 7.94
2006 1,749 25.20 1,316 6.30 720 15.57 554 4.53
2007 1,928 10.23 1,182 –10.18 764 6.11 563 1.62
Total 12,053 10,017 5,565 4,641
% Growth 1996-2007 434% 272% 209% 201%
quencing greatest efforts, including the human genome. This may be considered as a very important event to-wards this trend, once sequencings raised questions that opened a new world for the molecular biology: new genes, their functions, expressions (transcriptomic and proteomic techniques), cloning, and structure-function correlation in proteins, among others.
TABLE IX
Growth of scientific production in the state of São Paulo on SCOPUS database (1996-2007).
Year São Paulo % Annual Growth Total
1996 3,209 –
1997 3,710 15.61
1998 4,083 10.05
1999 4,459 9.21
2000 4,703 5.47
2001 5,079 7.99
2002 5,848 15.14
2003 6,775 15.85
2004 7,534 11.20
2005 8,512 12.98
2006 10,342 21.50
2007 11,471 10.92
Total 75,725
% Growth (1996-2007) 257%
TABLE X
Growth of scientific production in the state of São Paulo on ISI database (1996-2007).
Year São Paulo % Annual Growth Total
1996 3,717 –
1997 4,359 17.27
1998 5,004 14.80
1999 5,864 17.19
2000 6,173 5.27
2001 6,474 4.88
2002 7,750 19.71
2003 8,987 15.96
2004 9,302 3.51
2005 10,501 12.89
2006 10,580 0.75
2007 11,810 11.63
Total 90,521
% Growth 1996-2007 218%
PATENTS GROWTH ANALYSIS
It would be expected that the outstanding growth of Brazilian scientific production in molecular biology from 1996 to 2007 had been followed by an expressive increase in technological innovations in this field. This possible effect was investigated through an assessment to the number of patents registration at the United States Patent and Trademark Office (USPTO).
TABLE XI
Growth of scientific production in molecular biology in the state of São Paulo on
SCOPUS database (1996-2007).
Year São Paulo % Annual Growth BM
1996 151 –
1997 180 19.21
1998 243 35.00
1999 275 13.17
2000 303 10.18
2001 317 4.62
2002 408 28.71
2003 509 24.75
2004 615 20.83
2005 639 3.90
2006 812 27.07
2007 929 14.41
Total 5,381
% (Growth 1996-2007) 515%
TABLE XII
Growth of scientific production in molecular biology in the state of São Paulo on
ISI database (1996-2007).
Year São Paulo % Annual Growth BM
1996 139 –
1997 191 37.41
1998 248 29.84
1999 288 16.13
2000 290 0.69
2001 339 16.90
2002 396 16.81
2003 496 25.25
2004 522 5.24
2005 577 10.54
2006 722 25.13
2007 789 9.28
Total 4,997
% Growth 1996-2007 468%
PATENTSREGISTRATION: BRAZIL IN THECONTEXT OF
LATIN-AMERICANCOUNTRIES
TABLE XIII
Growth of scientific production in molecular biology and total scientific produc-tion of countries and the state of São Paulo on SCOPUS database (1996-2007).
Geographical Growth (%) Growth (%) Growth of production in location of production in of total molecular biology /
molecular biology production Growth of total production
China 1.243 583 2.13
São Paulo State 515 257 2.04
Brazil 434 236 1.84
South Korea 354 291 1.22
India 324 115 2.82
Poland 272 74 3.67
Chile 228 170 1.34
Czech Republic 209 93 2.25
Hungary 201 55 3.66
Mexico 180 103 1.75
South Africa 175 71 2.47
Argentina 160 75 2.13
Germany 62 38 1.63
Canada 57 54 1.06
United Kingdom 40 42 0.95
Japan 35 16 2.19
France 27 36 0.75
USA 20 12 1.67
TABLE XIV
Growth of patent registration in Brazil and in Latin American countries (USPTO patent database, 1996-2007).
Year Brazil Argentina Chile Mexico
Total % Growth Total % Growth Total % Growth Total % Growth
1996 93 – 36 – 5 – 369 –
1997 76 –18.28 36 0.00 8 60.00 360 –2.44
1998 114 50.00 54 50.00 22 175.00 557 54.72
1999 130 14.04 61 12.96 15 –31.82 541 –2.87
2000 134 3.08 72 18.03 16 6.67 554 2.40
2001 204 52.24 96 33.33 28 75.00 735 32.67
2002 301 47.55 140 45.83 41 46.43 1,023 39.18
2003 476 58.14 179 27.86 51 24.39 1,329 29.91
2004 508 6.72 196 9.50 74 45.10 1,368 2.93
2005 408 –19.69 154 –21.43 61 –17.57 1,196 –12.57
2006 553 35.54 188 22.08 70 14.75 1,553 29.85
2007 432 –21.88 166 –11.70 82 17.14 1,243 –19.96
Total 3,429 1,378 473 10,828
% Growth 1996-2007 365% 361% 1,540% 237%
with 361% and Mexico with 237%. It is important to emphasize that what is being discussed is an increase in percentage, not in absolute numbers of patents. These results may be checked in Table XIV, where the Brazil-ian modest numbers may be observed at the USPTO patent database in the 1996-2007 period: the Brazilian
number of patents is 3,429, whereas the Mexican one reaches 10,828.
TABLE XV
Growth of patent registration in molecular biology in Brazil and in Latin American countries (USPTO patent database, 1996-2007).
Year
Brazil Argentina Chile Mexico
Molecular % Molecular % Molecular % Molecular %
Biology Growth Biology Growth Biology Growth Biology Growth
1996 1 – 3 – 0 – 16 –
1997 2 100.00 5 66.67 0 – 20 25.00
1998 4 100.00 6 20.00 0 – 44 120.00
1999 3 –25.00 3 –50.00 0 – 24 –45.45
2000 11 266.67 3 0.00 0 – 35 45.83
2001 7 –36.36 3 0.00 3 – 36 2.86
2002 18 157.14 2 –33.33 4 33.33 76 111.11
2003 42 133.33 11 450.00 9 125.00 100 31.58
2004 52 23.81 25 127.27 5 –44.44 114 14.00
2005 39 –25.00 14 –44.00 10 100.00 113 –0.88
2006 62 58.97 28 100.00 10 0.00 111 –1.77
2007 38 –38.71 30 7.14 13 30.00 87 –21.62
Total 279 133 54 776
% Growth 1996-2007 3,700% 900% 333% 444%
and Chile with 333% (Table XV). However, despite this increase, the number of patents (Table XV) is still of little significance, 279, less than half the Mexican amount, which is 776.
PATENTSREGISTRATION: COMPARISONBETWEEN
BRAZIL ANDDEVELOPEDCOUNTRIES
Taking into account the period of 1996-2007 Brazil stands very weakly when compared to developed coun-tries, as far as the number of patents is concerned. Its growth of 365%, followed by the developed countries that presented a growth rate within the range of 295%, is very low if the aspiration is to reverse the great differ-ence that separates Brazil from these countries, concern-ing the number of patents that were recorded at USPTO (Table XVI).
Brazil’s number of patents shows a more expressive growth in molecular biology when compared to devel-oped countries (Table XVII). However, the same argu-ments prevail: the increase rate of patent records should have been much higher in order to diminish the great dis-tance that separates Brazil from the developed countries.
PATENTREGISTRATION: BRAZIL IN THESETTING OF
RAPIDLYEMERGINGCOUNTRIES
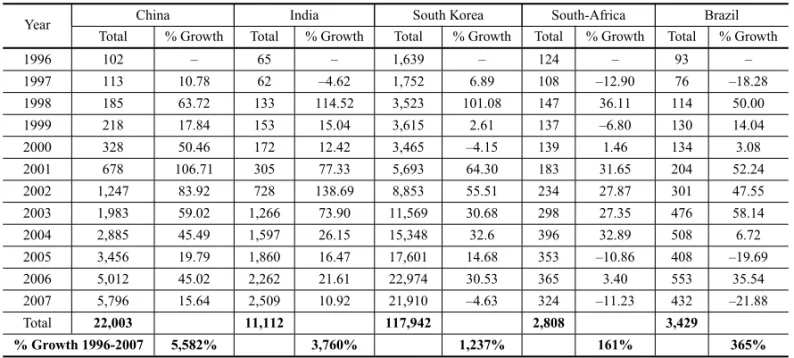
The growth of the total of patents in China is higher than in any other country, including the developed countries.
The Chinese growth was of 5,582%, followed by India with a growth of 3,760%, South Korea with 1,237%, Brazil with 365% and South Africa with 161% (Table XVIII).
When the molecular biology patent registration is compared in the same setting, Brazil appears in the third place, with a growth of 3,700%, higher than South Korea and South Africa (Table XIX). China and India have presented an overwhelming growth in the number of patent records in molecular biology of 5,275% and 4,540%, respectively.
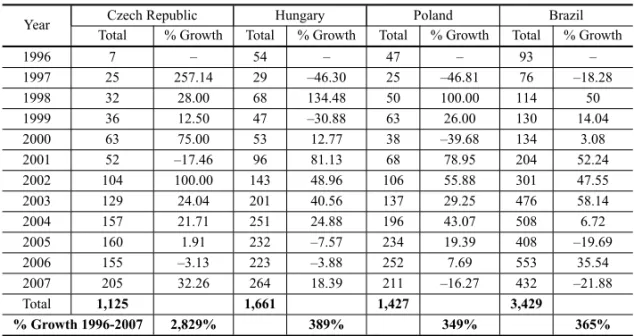
PATENTREGISTRATION: BRAZIL ANDEASTEUROPEAN
COUNTRIES
The growth of patent registrations in the Czech Repub-lic in all areas is 2,829%, the highest among East Eu-ropean countries (Table XX). It is followed by Hungary with 389%, Brazil 365% and Poland 349%. However, Table XX also shows that the number of patent regis-tered is low in East European countries, even lower than in Brazil.
TABLE XVIII
Growth of patent registration in Brazil and in rapidly emerging countries (USPTO patent database, 1996-2007).
Year China India South Korea South-Africa Brazil
Total % Growth Total % Growth Total % Growth Total % Growth Total % Growth
1996 102 – 65 – 1,639 – 124 – 93 –
1997 113 10.78 62 –4.62 1,752 6.89 108 –12.90 76 –18.28
1998 185 63.72 133 114.52 3,523 101.08 147 36.11 114 50.00
1999 218 17.84 153 15.04 3,615 2.61 137 –6.80 130 14.04
2000 328 50.46 172 12.42 3,465 –4.15 139 1.46 134 3.08
2001 678 106.71 305 77.33 5,693 64.30 183 31.65 204 52.24
2002 1,247 83.92 728 138.69 8,853 55.51 234 27.87 301 47.55
2003 1,983 59.02 1,266 73.90 11,569 30.68 298 27.35 476 58.14
2004 2,885 45.49 1,597 26.15 15,348 32.6 396 32.89 508 6.72
2005 3,456 19.79 1,860 16.47 17,601 14.68 353 –10.86 408 –19.69
2006 5,012 45.02 2,262 21.61 22,974 30.53 365 3.40 553 35.54
2007 5,796 15.64 2,509 10.92 21,910 –4.63 324 –11.23 432 –21.88
Total 22,003 11,112 117,942 2,808 3,429
% Growth 1996-2007 5,582% 3,760% 1,237% 161% 365%
TABLE XIX
Growth of patent registration in molecular biology in Brazil and rapidly emerging countries (USPTO patent database 1996-2007).
Year
China India South Korea South-Africa Brazil
Molec % Molec % Molec % Molec % Molec %
Biol Growth Biol Growth Biol Growth Biol Growth Biol Growth
1996 4 – 5 – 17 – 2 – 1 –
1997 7 75.00 7 40.00 24 41.18 1 –50.00 2 100.00
1998 12 71.43 20 185.71 32 33.33 1 0.00 4 100.00
1999 16 33.33 11 –45.00 39 21.88 2 100.00 3 –25.00
2000 10 –37.50 18 63.64 40 2.56 6 200.00 11 266.67
2001 30 200.00 33 83.33 80 100.00 6 0.00 7 –36.36
2002 57 90.00 100 203.03 132 65.00 11 83.33 18 157.14
2003 108 89.47 167 67.00 271 105.30 18 63.64 42 133.33
2004 170 57.41 126 –24.55 319 17.71 15 –16.67 52 23.81
2005 155 –8.82 160 26.98 365 14.42 7 –53.33 39 –25.00
2006 212 36.77 175 9.38 463 26.85 12 71.43 62 58.97
2007 215 1.42 232 32.57 439 –5.18 12 0.00 38 –38.71
Total 996 1,054 2,221 93 279
% Growth 1996-2007 5,275% 4,540% 2,482% 500% 3,700%
PATENTREGISTRATION: SÃOPAULO INCOMPARISON WITHBRAZIL
As opposed to what happens with the scientific produc-tion measured by publicaproduc-tions, in which São Paulo State reached approximately 37% of the national production in the 1996-2007 period, according to the Scopus data-base (Tables I and IX), the total number of patents regis-tered in the same period is lower in comparison with the
national rate: 34% (Table XXII). Such unfavorable per-formance is surprising for a state with the most dynamic industrial sector in Brazil.
TABLE XX
Growth of patent registration in Brazil and in developing East European countries (USPTO patent database 1996-2007).
Year Czech Republic Hungary Poland Brazil
Total % Growth Total % Growth Total % Growth Total % Growth
1996 7 – 54 – 47 – 93 –
1997 25 257.14 29 –46.30 25 –46.81 76 –18.28
1998 32 28.00 68 134.48 50 100.00 114 50
1999 36 12.50 47 –30.88 63 26.00 130 14.04
2000 63 75.00 53 12.77 38 –39.68 134 3.08
2001 52 –17.46 96 81.13 68 78.95 204 52.24
2002 104 100.00 143 48.96 106 55.88 301 47.55
2003 129 24.04 201 40.56 137 29.25 476 58.14
2004 157 21.71 251 24.88 196 43.07 508 6.72
2005 160 1.91 232 –7.57 234 19.39 408 –19.69
2006 155 –3.13 223 –3.88 252 7.69 553 35.54
2007 205 32.26 264 18.39 211 –16.27 432 –21.88
Total 1,125 1,661 1,427 3,429
% Growth 1996-2007 2,829% 389% 349% 365%
TABLE XXI
Growth of patent registration in molecular biology in Brazil and in developing East European countries (USPTO patent database 1996-2007).
Year Czech Republic Hungary Poland Brazil
Molec % Molec % Molec % Molec %
Biol Growth Biol Growth Biol Growth Biol Growth
1996 – 2 – 3 – 1 –
1997 8 – 2 0 4 33.33 2 100
1998 6 –25.00 7 250 4 0.00 4 100
1999 6 0.00 8 14.29 8 100.00 3 –25
2000 4 –33.33 6 –25.00 1 –87.50 11 266.67
2001 8 100.00 11 83.33 8 700.00 7 –36.36
2002 11 37.50 13 18.18 12 50.00 18 157.14
2003 17 54.55 31 138.46 13 833 42 133.33
2004 19 11.76 27 –12.90 18 38.46 52 23.81
2005 18 –5.26 34 25.93 24 33.33 39 –25
2006 26 44.44 31 –8.82 22 –8.33 62 58.97
2007 17 –34.62 23 –25.81 19 –13.64 38 –38.71
Total 140 195 136 279
% Growth 1996-2007 113% 1,050% 533% 3,700%
PATENTREGISTRATION INRELATION TO
SCIENTIFICPRODUCTION
For most of the countries, the knowledge production (scientific publications) has a strong correlation with patents registration and with technological innovations (Acs et al. 2002). Despite a strong correlation between economic development and scientific and technological production has been shown (Ribeiro et al. 2006), there are strong cultural deviations concerning knowledge
coun-TABLE XXII
Growth of patent registration in São Paulo State in comparison with Brazil (USPTO patent
database 1996-2007).
Year São Paulo State Brazil Total % Growth Total % Growth
1996 35 – 93 –
1997 32 –8.57 76 –18.28
1998 39 21.88 114 50.00
1999 40 2.56 130 14.04
2000 42 5.00 134 3.08
2001 59 40.48 204 52.24
2002 83 40.68 301 47.55
2003 175 110.84 476 58.14
2004 164 –6.29 508 6.72
2005 130 –20.73 408 –19.69
2006 196 50.77 553 35.54
2007 166 –15.31 432 –21.88
Total 1161 3,429
% Growth 1996-2007 374% 365%
TABLE XXIII
Growth of patent registration in molecular biology in São Paulo State in comparison with Brazil
(USPTO patent database 1996-2007).
Year São Paulo State Brazil BM % Growth BM % Growth
1996 0 – 1 –
1997 1 – 2 100.00
1998 0 – 4 100.00
1999 0 – 3 –25.00
2000 2 – 11 266.67
2001 1 –50.00 7 –36.36
2002 4 300.00 18 157.14
2003 8 100.00 42 133.33
2004 9 12.50 52 23.81
2005 11 22.22 39 –25.00
2006 21 90.91 62 58.97
2007 9 –56.14 38 –38.71
Total 66 279
% Growth 1996-2007 350% 3,700%
tries and São Paulo State. Among these countries are: China, three Latin American countries including Brazil, three East European countries and South Africa. China may be considered an exception because, despite present-ing a strong technological innovation profile, it had not been followed by a proportional growth in the number of patents. In fact, China adopted a bi-directionally alien-ated position for procedures of patents deposits, either by ignoring the respect for technologies that registered
patents in foreign countries or by disdaining registra-tions of its own innovaregistra-tions. However, there have been great changes in China lately, with an explosion of patents registrations (Hu and Jefferson 2008) due to large exter-nal investments in the Chinese economy and consequent changes in intellectual property legislations. The period covered by the current research considers only part of such happenings in China, whose results should strongly influence this country position in the following years.
Mexico achieved a position closer to developed countries in the patents/scientific production correlation. The fact of being geographically close to the United States and also the presence of American industries pro-ducing innovations in Mexico certainly have weighted significantly in this context.
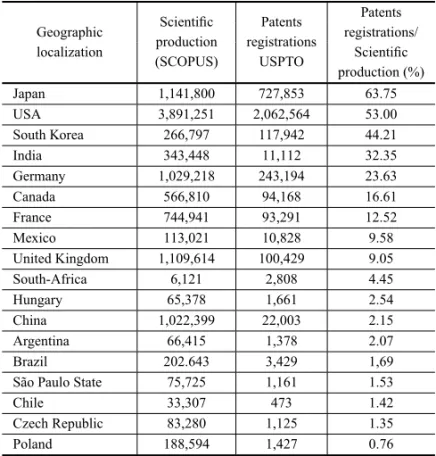
Positions are not meaningfully changed in the mo-lecular biology area as shown in Table XXV. Japan was in the first position concerning patents registration nor-malized by scientific articles in overall fields of science, but it currently reaches the third position in the molec-ular biology area, being replaced by USA in the first position. India, which occupies the fourth position con-cerning all fields of sciences, falls down to the ninth po-sition in molecular biology. Korea, with its recognized effort for technological innovation, changes from posi-tion 3 to 7 in Tables XXV. It is amazing that São Paulo State is so badly positioned in the area of molecular bio-logy. In fact, some companies emerged in this state as a result of its own genome program with the perspective of innovation, mainly in the agricultural area. However, up to the moment, this has not been translated into a growth of patent registrations at USPTO.
FINAL CONSIDERATIONS
Fol-TABLE XXIV
Scientific production according to the SCOPUS database and patent registration on USPTO database covering all
fields of science and technology (1996-2007).
Scientific Patents Patents Geographic
production registrations registrations/ localization
(SCOPUS) USPTO Scientific production (%)
Japan 1,141,800 727,853 63.75
USA 3,891,251 2,062,564 53.00
South Korea 266,797 117,942 44.21
India 343,448 11,112 32.35
Germany 1,029,218 243,194 23.63
Canada 566,810 94,168 16.61
France 744,941 93,291 12.52
Mexico 113,021 10,828 9.58
United Kingdom 1,109,614 100,429 9.05
South-Africa 6,121 2,808 4.45
Hungary 65,378 1,661 2.54
China 1,022,399 22,003 2.15
Argentina 66,415 1,378 2.07
Brazil 202.643 3,429 1,69
São Paulo State 75,725 1,161 1.53
Chile 33,307 473 1.42
Czech Republic 83,280 1,125 1.35
Poland 188,594 1,427 0.76
TABLE XXV
Scientific production according to the SCOPUS database and patent registration on USPTO database covering
molecular biology (1996-2007).
Scientific Patents Patents Geographic
production registrations registrations/ localization
(SCOPUS) USPTO Scientific production (%)
USA 393,986 147,206 37.36
Canada 45,077 8,060 17.88
Japan 122,809 16,134 13.14
Germany 90,101 11,546 12.81
United Kingdom 85,802 9,786 11.41
Mexico 6,393 776 11.19
South Korea 20,880 2,221 10.64
France 66,662 6,890 10.34
India 14,442 1,054 7.30
Hungary 4,641 195 4.20
Argentina 4,463 133 2.98
Chile 1,962 54 2.75
Czech Republic 5,565 140 2.52
South-Africa 3,698 93 2.51
Brazil 12,053 279 2.31
China 57,342 996 1.74
Poland 10,017 136 1.36
lowing this point of view, it should be the private sector role to achieve advances in technological innovations. This is undoubtedly the prevailing model in developed countries.
The effort to have expression in specific areas generates positive results, as shown in the case of ge-nomic programs. A wel-organized and well-conducted network, with realistic resources, allowed Brazil and the state of São Paulo to achieve a dramatic expansion in scientific publications, only subdued by China.
Such fact surely constitutes a necessary leap which, however, is not sufficient for a significant rise of the technological innovation process in the area of mo-lecular biology.
ACKNOWLEDGMENTS
This work was supported by a grant of the Fundação de Amparo à Pesquisa do Estado de São Paulo (FAPESP), Brazil, number 06/56462-9. ECG holds a fellowship for post-graduation studies from Coordenação de Aper-feiçoamento de Pessoal de Nível Superior (CAPES), Brazil. No conflict of interest has been foreseen in the present article.
RESUMO
Vários programas de sequenciamento de genoma foram lan-çados no Brasil no final da década de noventa e início da década de 2000. As mais importantes iniciativas foram sus-tentadas pelo programa ONSA (http://watson.fapesp.br/onsa/ Genoma3.htm) e visavam o domínio da tecnologia genômica e o progresso da biologia molecular para o estado da arte desta disciplina. Dois principais conjuntos de dados foram coleta-dos no período de 1996-2007 para avaliar os resultacoleta-dos destes programas de genômica: a produção científica (bases de dados SCOPUS e o registro de patentes (US Patent and Trademark Office), ambos relacionados com o progresso de biologia molecular ao longo deste período. Em relação ao primeiro o Brasil de um grande passo em comparação a 17 outros países desenvolvidos e em desenvolvimento, sendo apenas superado pela China. Com relação ao registro de patentes na área de biologia molecular, o desempenho do Brasil fica bem atrás en-tre os países focados no presente estudo, confirmando a per-durável tendência de pobres conquistas em inovação tecnoló-gica, quando comparado com produção científica. São discu-tidas as possíveis soluções para superar este desequilíbrio.
Palavras-chave: avaliação de ciência, genômica, cienciome-tria, biologia molecular.
REFERENCES
ACS CJ, ANSELIN L AND VARGA A. 2002. Patents and innovation counts as measures of regional production of new knowledge. Research Policy 31: 1069–1085. BRAZILIAN GENOME PROJECT CONSORTIUM + 110
AUTHORS. 2003. The complete genome sequence of
Chromobacterium violaceum reveals remarkable and exploitable bacterial adaptability. Proceedings of the Nationall Academy of Sciences 100: 11660–11665. BRITOCRUZCH. 2005. Reforma de estratégia. Folha de São
Paulo, pág. 3, 22 de fevereiro.
GALEMBECKF. 2007. Jornal de Ciência, 10 de julho de 2007. http://www.jornaldaciencia.org.br/Detalhe.jsp?id=48604. GUINETJ. 2009. http://www.agencia.fapesp.br/materia/
10936/busca-global.htm.
HARVEYMANDMCMEEKINA. 2005. Brazilian genomics and bioinformatics: instituting new innovation pathways in a global context. Economy and Society 34: 634–658. HUAGANDJEFFERSONGH. 2008. A great wall of patents:
What is behind China’s recent patent explosion? J Dev Econ 90: 57–68.
JUDSON HF. 1979. The eighth day of creation; makers of the revolution in biology. Simon and Schuster, New York. PEREZJF. 2002. Pesquisa: a construção de novos
paradig-mas. São Paulo Perspectiva 16: 30–35.
RIBEIROLC, RUIZ RM, ALBUQUERQUE EM ANDBER -NARDES AT. 2006. Science in the Developing World: Running Twice as Fast? Computing in Science and Engi-neering 8: 81–87.
SILVA ACR, FERRO JA, REINACH FC + 62 AUTHORS. 2002. Comparison of the genomes of twoXanthomonas
pathogens with different host specificities. Nature 417: 459–463.
SIMPSONAJG, REINACHFC, ARRUDAP + 113AUTHORS. 2000. The genome sequence of the plant pathogen Xyl-lela fastidiosa. Nature 406: 151–156.
WILLIAMSLKANDMCGUIRESJJ. 2001. http://www.isnie.org/ISNIE05/Papers05/ Williams_McGuire.PDF.
ZANOTTOED. 2002. Scientific and technological develop-ment in Brazil. The widening gap. Scientometrics 55: 411–419.