http://www.uem.br/acta ISSN printed: 1806-2636 ISSN on-line: 1807-8672
Doi: 10.4025/actascianimsci.v38i3.31247
Acta Scientiarum. Animal Sciences Maringá, v. 38, n. 3, p. 267-274, July-Sept., 2016
Carcass yield, sensory analysis and meat quality of broilers fed
canola meal
Priscila de Oliveira Moraes1*, Liliane Novelini2, Jaqueline Schneider Lemes2, Marco Aurélio Ziemann dos Santos2, Cláudio Martin Pereira de Pereira2 and Eduardo Gonçalves Xavier2
1
Universidade Federal do Rio Grande do Sul, Avenida Bento Gonçalves, 9500, 91540-000, Porto Alegre, Rio Grande do Sul, Brazil. 2Faculdade de Agronomia, Universidade Federal de Pelotas, Capão do Leão, Rio Grande do Sul, Brazil. *Author for correspondence. E-mail:
ABSTRACT. This study aimed to evaluate the effect of dietary levels of canola meal on carcass yield, fatty acids profile, physical characteristics, chemical and sensory composition of breast meat of broilers. A total of 300 one-day-old, both sexes, Cobb broilers were assigned to a completely randomized design with five treatments and six replicates of ten birds each. Birds were given 0, 25, 50, 75 and 100% canola meal in place of soybean meal in the diet. After 42 days, four birds per replicate were slaughtered to analyze the carcass yield and the breast was used for analysis of fatty acid profile, sensory analysis and chemical and physical composition. The fatty acid profile was influenced by increasing levels of canola meal, decreasing (p < 0.05) the content of saturated fatty acids and linoleic acid, and increasing (p < 0.05) the content of linolenic acid. In the sensory analysis, the residual flavor became stronger (p > 0.05) with 100% replacement and the hardness decreased (p < 0.05). Canola meal can replace soybean meal up to the level of 25% without affecting carcass yield and chemical, instrumental and sensory analysis of meat.
Keywords: fatty acids, nutrition, poultry, trained panel.
Rendimento de carcaça, análise sensorial e qualidade da carne de frangos alimentados
com farelo de canola
RESUMO. O objetivo deste estudo foi avaliar o efeito de níveis de farelo de canola na dieta de frangos de corte sobre o rendimento de cortes, perfil de ácidos graxos, características físicas, composição química e sensorial da carne do peito. Foram utilizados 300 frangos, de ambos os sexos, da linhagem Cobb, distribuídos em um delineamento inteiramente casualizado, com cinco tratamentos e seis repetições com dez aves por unidade experimental. As aves foram alimentadas com 0, 25, 50, 75 e 100% de substituição do farelo de soja pelo de canola na dieta. Após 42 dias, quatro aves por repetição foram abatidas para analisar o rendimento de carcaça e o peito foi utilizado para análise do perfil de ácidos graxos, sensorial e composição química e física. O perfil de ácidos graxos foi influenciado (p < 0,05) pelo aumento do farelo de canola, diminuindo (p < 0,05) o teor de ácidos graxos saturados e o ácido linoleico e promoveu o aumento (p < 0,05) do ácido linolênico. Na análise sensorial, o sabor residual aumentou (p < 0,05) com a substituição de 100% e a dureza diminuiu (p < 0,05). O farelo de canola pode substituir o farelo soja até o nível de 25% sem afetar o rendimento de carcaça e composição química, instrumental e sensorial da carne.
Palavras-chave: ácidos graxos, nutrição, aves, painel treinado.
Introduction
The use of canola meal derived from double zero, low-glucosinolate, and low-erucic acid varieties of rapeseed in monogastric animal nutrition is limited due to the low energy content available and the presence of anti-nutritional factors, including glucosinolates, sinapine, phytate and dietary fiber components, such as tannins or non-starch polysaccharides (Khajali & Slominski, 2012). Although the canola meal has protein content ranging from 34 to 38%, it has an amino acid profile similar to that of soybean meal. Studies on canola
meal between 150 and 200 g kg-1 in the diet for
broilers reported no adverse effects on the performance (Ahmad, Mirza, & Ahmad, 2007). The replacement of soybean meal with canola meal could reduce the cost of animal feed for the farmer, if there is no impact on the performance and physical characteristics of meat.
Canola has a high α-linolenic acid content and monounsaturated fatty acids, such as oleic acid. Mikulski, Jankowski, Zdunczyk, Juskiewicz, and Slominski (2012) observed lower concentration of saturated fatty acids and an increase in unsaturated fatty acids in meat of male turkeys fed 120 to 180 g kg-1 canola meal.
According to Franzoi, Siewerdt, Rutz, Brum, and Gomes (2000), the use of canola meal does not alter the body weight, carcass weight, or the amount of edible tissues produced and results in increased carcass quality. On the other hand, Mikulski et al. (2012) observed that an inclusion of 180 g kg-1
increases the cooking loss, reduces shear force and yellow color intensity in breast meat.
Sañudo, Enser, and Campo (2000) claimed that the appearance, tenderness, juiciness and flavor are the main factors that lead the consumer to approve or not the product. Meat sensory evaluation provides a preference profile of the consumer market and therefore ensures the quality of a more satisfactory product.
The objective of this study was to evaluate the yield of cuts, fatty acid profile, and the physical, chemical and sensory composition of breast meat from broilers fed diets containing canola meal.
Material and methods
The procedures of this experiment complied with the Brazilian guidelines for the scientific use of animals (Federal Act Number 11,794 as of October 8, 2008) and the experimental protocol of this project was approved by the Ethics Committee on
Animal Experimentation of the Federal University of Pelotas under number 805.
Animals, experimental design and diets
Three-hundred one-day-old mixed chicks (males and females) of Cobb 500 strain were used. Birds were previously vaccinated in the hatchery against Marek's and Gumboro diseases. Ten birds were allotted per pen during 42 experimental days. A completely randomized design was used, with five treatments and six replications, totaling 30 experimental units.
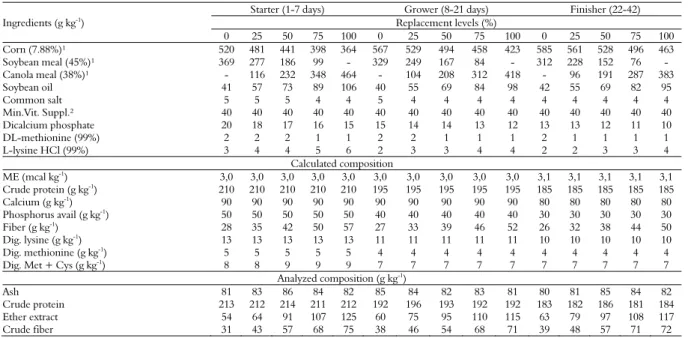
The experimental diets were formulated to meet the nutritional requirements of each stage of development, according to the recommendations of Rostagno et al. (2011), starter (1-7 days), grower (8-21 days) and finisher (22-42 days) diets were used (Table 1). Five levels of canola meal (0, 25, 50, 75 and 100%) were tested in the place of soybean meal. Diets were analyzed for crude protein (CP), ether extract (EE), crude fiber (CF), crude ash (CA), following methodology described by AOAC International (Association of Official Analytical Chemists [AOAC], 2000).
Cutting yield, chemical composition and fatty acid profile
At the end of 42 days, after six hours of fasting, broilers were individually weighed and slaughtered. After gutting and removal of the head and paws, birds were weighed to obtain the carcass yield (CY) using the formula: CY = [(carcass weight/body weight)*100].
Table 1. Composition and calculated analysis of experimental diets (as-fed basis).
Ingredients (g kg-1)
Starter (1-7 days) Grower (8-21 days) Finisher (22-42) Replacement levels (%)
0 25 50 75 100 0 25 50 75 100 0 25 50 75 100
Corn (7.88%)¹ 520 481 441 398 364 567 529 494 458 423 585 561 528 496 463
Soybean meal (45%)¹ 369 277 186 99 - 329 249 167 84 - 312 228 152 76 -
Canola meal (38%)¹ - 116 232 348 464 - 104 208 312 418 - 96 191 287 383
Soybean oil 41 57 73 89 106 40 55 69 84 98 42 55 69 82 95
Common salt 5 5 5 4 4 5 4 4 4 4 4 4 4 4 4
Min.Vit. Suppl.² 40 40 40 40 40 40 40 40 40 40 40 40 40 40 40
Dicalcium phosphate 20 18 17 16 15 15 14 14 13 12 13 13 12 11 10
DL-methionine (99%) 2 2 2 1 1 2 2 1 1 1 2 1 1 1 1
L-lysine HCl (99%) 3 4 4 5 6 2 3 3 4 4 2 2 3 3 4
Calculated composition ME (mcal kg-1
) 3,0 3,0 3,0 3,0 3,0 3,0 3,0 3,0 3,0 3,0 3,1 3,1 3,1 3,1 3,1
Crude protein (g kg-1) 210 210 210 210 210 195 195 195 195 195 185 185 185 185 185
Calcium (g kg-1
) 90 90 90 90 90 90 90 90 90 90 80 80 80 80 80
Phosphorus avail (g kg-1) 50 50 50 50 50 40 40 40 40 40 30 30 30 30 30
Fiber (g kg-1) 28 35 42 50 57 27 33 39 46 52 26 32 38 44 50
Dig. lysine (g kg-1
) 13 13 13 13 13 11 11 11 11 11 10 10 10 10 10
Dig. methionine (g kg-1) 5 5 5 5 5 4 4 4 4 4 4 4 4 4 4
Dig. Met + Cys (g kg-1) 8 8 9 9 9 7 7 7 7 7 7 7 7 7 7
Analyzed composition (g kg-1)
Ash 81 83 86 84 82 85 84 82 83 81 80 81 85 84 82
Crude protein 213 212 214 211 212 192 196 193 192 192 183 182 186 181 184
Ether extract 54 64 91 107 125 60 75 95 110 115 63 79 97 108 117
Crude fiber 31 43 57 68 75 38 46 54 68 71 39 48 57 71 72
1Crude protein; 2Composition per kilogram of product: zinc: 1,000; manganese: 1,250; zinc bacitracin: 637.50; iron: 750; and iodine: 18.20 mg; vitamin E: 200 IU; vitamin B1: 17;
Acta Scientiarum. Animal Sciences Maringá, v. 38, n. 3, p. 267-274, July-Sept., 2016 Cuts of breast with skin, legs (thigh and
drumstick) and wings with skin were made. In order to evaluate the cut yields, it was taken into consideration the carcass weight, using the following formula: yield = [(cut weight/carcass weight)*100]. After the slaughter, the four legs (thigh and drumstick) and a skinless breast per treatment were identified and frozen for the analysis of chemical composition and fatty acid profile. In addition, 20 breasts were used per treatment for the physical and sensory analysis.
For chemical analysis, legs and breasts were thawed, crushed and pre-dried in a forced air oven at 55°C for 72 hours. After, they were ground for analysis of dry matter, moisture, ash, protein and ether extract, according to the methodology described by Association of Official Analytical Chemists (AOAC, 2000).
As for the analysis of fatty acids, 6 g of fresh breast per treatment were weighed for the extraction of lipids by the method of Bligh and Dyer (1959) and esterified according to the method of Li, Yang, Wang, and Tian (2006). Samples were analyzed by gas chromatography using Shimadzu chromatograph GC-2010, with AOC-20i auto-injector (Shimadzu) and SPTM 2560 column (capillary column Supelco) with dimensions of 100 m x 0.25 mm I.D. x 0.2 μm. The standard used was the Frame Mix 100 m SP-2560 from Supelco, with 1μL injection and 100:1 split, for the detection of up to 37 fatty acids. Diets were also analyzed for fatty acid profile following the methodology described for meat.
Physical and sensory characteristics
For both analyses, 20 boneless breasts without skin per treatment were used, the right side separated for physical analysis and the left side for sensory analysis. Half of the ‘pectoralis major’ muscle was intended for physical analysis remaining under refrigeration for up to 48 hours after the slaughter. For the sensory analysis, samples were frozen.
After 24 hours of slaughter, color was determined using a Chroma Meter CR-310 colorimeter (Minolta, Osaka, Japan) by the system L*, a*, b*, where L* = luminosity, a* = red color intensity, b* = yellow color intensity. The evaluation was done in three different parts of the pectoralis major muscle, in order to obtain an average value. With the average of each parameter, chroma (color saturation) and the Hue-Angle (Angle tonality) were calculated using the respective Equation 1:
C = √(a*+b*) and H = arctg b*/a* (1)
The other evaluations were performed 48 hours after slaughter. For the analysis of water retention capacity, it was used the pressure method described by Delezie, Swennen, Buyse, and Decuypere (2007). The resulting meat sample was weighed again using a digital scale to calculate the water loss. The results were expressed as the amount of water retained, relative to the initial sample weight.
In order to evaluate the shear force, samples were wrapped in aluminum foil and roasted until reaching an internal temperature of 85ºC. Next, smaller samples were cut parallel to the muscle fibers with the aid of a pourer with diameter of 1.2 cm2. The shear force was recorded using Instron
equipment coupled to a Warner-Bratzler accessory, which measured the force (kgf cm-2) required to
break the fiber of the samples.
With respect to the sensory analysis, nine aides were trained to compose the panel. Over five sessions, 12 replicates per treatment were evaluated. At each session, breasts were thawed under refrigeration at 4°C, for 24 hours, wrapped in foil and roasted in electric grill (Black & Decker, Model GS 1600, Brazil) pre heated up to an internal temperature between 82 and 85°C. After that, they were cut parallel to the muscle fibers, in 1.5 cm3
encoded with three digit numbers and served at a temperature of 60°C. Samples were analyzed in individual cabins. The assessor received four dishes per session, and each dish was composed of different treatments encoded, so that the assessor would not know what each one was. Samples were evaluated in the sequence that they were arranged on the plate, according to the following attributes: color intensity, characteristic odor, fat and strange flavor, regarding flavor: characteristic, strange and residual flavor, hardness, juiciness, fibrousness and overall acceptance. Each assessor would mark the intensity of each attribute using a structured scale of 9 cm, anchored at the ends, to the left by the term ‘weak’ and to the right by the term ‘strong’ (Stone & Sidel, 1998).
Statistical analysis
Data were subjected to analysis of variance with the following Equation 2:
Yij = μ + Ti + εij (2)
where:
Yij = observation,
μ = population average,
Ti = diet effect (i = 1 to 5), and
A polynomial regression analysis was used to predict the effect of the inclusion levels of canola meal in the diet on the parameters of part yields, fatty acid profile, and physical and chemical composition of the breast meat. Data were analyzed using the REG procedure of the SAS software (Statistical Analysis System [SAS], 2002); the polynomial regression models were selected based on the significance of the regression coefficients (p < 0.05) and on the value of the coefficient of determination. The maximum of the curve corresponding to the quadratic effect was then calculated for the variables observed. As for the evaluation of the sensory analysis, data were subjected to analysis of variance (ANOVA-GLM) and means were compared by the Tukey test at 5%.
Results and discussion
Cut yields, chemical composition and fatty acid profile
Body weight of broilers decreased linearly (p < 0.05) as increased the level of substitution of soybean meal by canola meal in the diet (Table 2). Canola meal, when compared to soybean meal, has several anti-nutritional factors such as tannins, non-starch polysaccharides, phytic acid, glucosinolates and sinapine (Khajali & Slominski, 2012). The reduction in body weight of broilers with increasing levels of canola meal in the diet may have occurred due to this combination of factors. Carcass, legs and wings yields were not affected (p > 0.05) by the replacement of dietary soybean meal with canola meal. Only the breast yield showed the same response of the weight of chickens (Table 2). Lysine is directly related to protein synthesis in breast muscle, and even though, lysine availability is lower in canola meal. Thus, linear reduction in breast yield was found with increasing levels of canola meal, which was likely attributed to the reduced availability of lysine in canola meal. Khajali, Saedi, and Slominski (2011) and Gopinger, Xavier, Lemes, Moraes, and Elias (2014) also observed that broiler carcass and breast yield was significantly reduced when dietary soybean meal was substituted with canola meal.
Crude protein of the leg presented a quadratic response (p < 0.05), increasing up to the level of 40% of substitution of soybean meal with canola meal in the diet (Table 3). The lipid content in the leg, in turn, also showed a quadratic response, however decreasing at the level of 26% and increasing later. For the breast, only the lipid content showed difference (p < 0.05), being observed a quadratic response similar to that of leg, with a reduction at the level of 30.75% substitution
of soybean meal with canola meal, increasing later. Other variables of the chemical composition of the leg and breast were not affected by the treatments.
Table 2. Carcass and cuts weight and yield of broilers fed diets containing canola meal.
Variables Replacement levels (%) SEM *p value
0 25 50 75 100 L1 Q
Body weight (g) 2577 2623 2550 2504 2386 72.80 0.0245 0.0443 Carcass weight (g) 1880 1876 1843 1700 1796 63.24 0.0062 0.0340 Carcass yield (%) 77.63 77.98 78.77 74.42 76.11 1.34 0.1137 0.1497 Breast weight (g) 705.75 658.00 621.87 571.25 557.50 28.02 0.0017 0.0104 Breast yield (%) 35.77 35.15 33.72 33.62 31.11 0.70 0.0288 0.0476 Leg weight (g) 238.75 250.00 235.42 211.25 235.00 16.46 0.4378 0.3966 Leg yield (%) 12.67 12.59 12.78 12.39 13.13 0.49 0.6242 0.6078 Wing weight (g) 97.50 95.00 98.22 91.25 97.50 4.60 0.9201 0.9054 Wing yield (%) 5.19 4.80 5.32 5.38 5.39 0.11 0.4316 0.5123 *p value = significance level at α = 0.05 by the fitted regression equation. 1L and
Q - linear and quadratic effects, concerning the replacement levels. Fitted equation for: Body weight = 2632.11 - 2.031x (r2 = 0.97); Carcass weight = 1932 – 2.76x; breast
weight = 658.09 - 1.345x (r2 = 0.75); breast yield = 36.95 - 1.025x (r2 = 0.81).
Table 3. Proximate composition of leg (thigh + drumstick) and breast of broilers fed canola meal.
Variables (g kg-1) Replacement levels (%) SEM *
p value
0 25 50 75 100 L1 Q
Leg (thigh + drumstick)
DM 266.2 240.6 244.1 266.6 258.2 0.90 0.2875 0.2465 MT 733.8 759.4 730.8 733.3 741.6 1.18 0.4343 0.2356
AH 9.8 9.2 9.7 10.0 10.3 0.04 0.9101 0.7698
CP 189.2 193.0 198.9 193.2 172.3 0.39 0.0789 <.0001
LD 61.0 62.6 61.5 63.5 76.0 0.26 0.0240 0.0038
Breast
DM 238.5 222.8 229.1 239.4 235.8 0.39 0.2197 0.3456 MT 761.5 777.1 770.8 760.5 764.2 0.39 0.1390 0.4589
AH 9.1 9.9 9.5 10.1 9.8 0.04 0.0836 0.0765
CP 226.5 222.4 241.0 243.8 230.1 0.62 0.1405 0.3484
LD 24.3 24.2 21.6 24.6 28.7 0.10 0.0640 0.0004
DM: dry matter. MT: moisture. AH: ash. CP: crude protein. LD: lipids. Values expressed in natural base. *p value = significance level at α = 0.05 by the fitted
regression equation. 1L and Q - linear and quadratic effects, concerning the replacement
levels. Fitted regression equations for CP (leg) = 187 + 0.563x - 0.007x2
(r2
= 0.92). LD (leg) = 62.297 - 0.161x + 0.003x2 (r2 = 0.89). LD (breast) = 24.84 - 0.123x +
0.002x2 (r2 = 0.86). Values expressed in natural base.
Results of the chemical composition of the meat differ in part from those found by Mikulski et al. (2012), who detected no significant difference for any variable of the proximate composition in the breast meat of turkeys fed diets containing levels of canola meal. Similarly, studies performed by Stanaćev et al. (2013) evaluated the canola meal in the diet of broiler chickens, and also observed no statistical difference for the contents of dry matter, moisture, ash, crude protein and lipids in the meat of birds at 42 days of age, which also differed from the results obtained herein.
Acta Scientiarum. Animal Sciences Maringá, v. 38, n. 3, p. 267-274, July-Sept., 2016 to Duarte, Lara, Baião, Cançado, and Teixeira
(2010), there is an extra-caloric effect of the oil added to the diet, referring to the highest net energy of the diet, since the deposition of lipids in birds is more efficient, when using the dietary fat, than the synthesis of fatty acids and glycerol from precursors of acetyl-CoA, the lipogenesis.
In Table 4, it is possible to observe that the canola meal showed a lower n-6:n-3 ratio, when compared to the soybean meal. It is also possible to notice that, as the canola meal was added to the diet, there was a tendency to decrease the n-6: n-3 ratio in the experimental diets. Although canola meal has a higher concentration of unsaturated fatty acids, its addition at increasing levels did not influence the composition of the other diets.
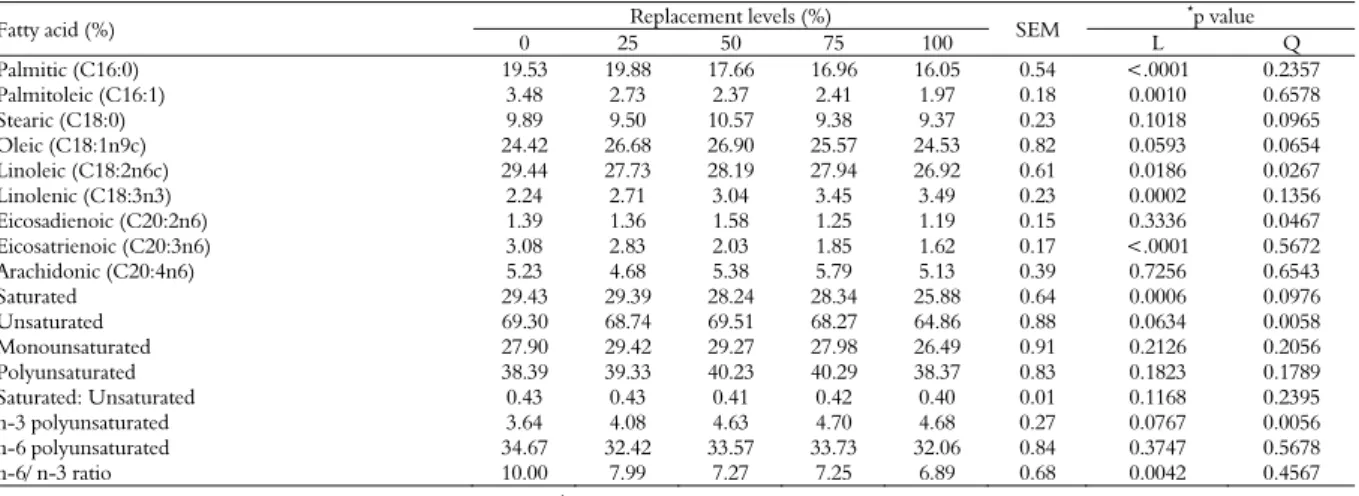
Palmitic, palmitoleic, linoleic and eicosatrienoic fatty acids were affected by the increase in levels of canola meal in the diet, decreasing linearly as the levels of canola meal increased in the diet. On the other hand, linolenic fatty acid increased linearly with increasing levels of canola meal (p < 0.01).
The replacement of meals provided a decreasing linear effect (p = 0.006) in the total saturated fatty acids and a quadratic effect (p = 0.0058) in the total unsaturated, which increased up to 28.17% substitution of soybean meal with canola meal. Fatty acids of the n-3 family, in turn, showed a quadratic response (p = 0.0056), increasing their concentration up to the level of 67% canola meal in the diet and decreasing subsequently. The n-6: n-3 ratio decreased linearly (p < 0.01) with increasing substitution of soybean meal with canola meal (Table 5).
These results corroborate those obtained by Mikulski et al. (2012), who analyzed the profile of fatty acids of breast of turkeys fed increasing levels of canola meal in the diet and found significantly lower levels of saturated fatty acids, such as myristic acid (C14:0) and palmitic acid (C16:0), and significantly higher concentrations of oleic acid (C18:1) and polyunsaturated fatty acids, including linoleic (C18:2) and linolenic (C18:3) acids.
Table 4. Dietary fatty acid profile.
Fatty acid Soybean meal Canola meal Replacement levels (%)
0 25 50 75 100
Palmitic (C16:0) 18.17 10.45 23.24 21.13 21.67 20.47 21.50
Palmitoleic (C16:1) - 7.75 - - - 1.00 0.75
Stearic (C18:0) 6.40 4.55 6.58 6.70 8.48 7.23 6.97
Oleic (C18:1n9c) 19.89 48.49 35.51 37.19 37.28 40.92 39.61
Linoleic (C18:2n6c) 48.36 26.22 29.47 27.95 23.47 24.74 23.72
Linolenic (C18:3n3) 7.35 7.38 2.07 2.19 2.17 2.27 2.83
Eicosanoic (C20:0) 0.00 1.55 1.67 1.31 1.51 1.66 1.35
Behenic (C22:0) 0.00 0.00 1.71 1.24 1.87 1.45 1.47
Tetracosanoic (C24:0) 0.00 0.00 0.00 1.22 1.19 0.98 0.94
Saturated 6.40 6.10 9.97 10.47 13.06 11.06 10.99
Unsaturated 75.61 82.09 67.05 67.33 62.92 67.93 66.16
n-3 polyunsaturated 7.35 7.38 2.07 2.19 2.17 2.27 2.83
n-6 polyunsaturated 48.36 26.22 29.47 27.95 23.47 24.74 23.72
n-6/ n-3 ratio 6.58 3.55 14.27 12.76 10.83 10.90 8.39
Table 5. Fatty acid profile of the breast of broilers fed canola meal.
Fatty acid (%) Replacement levels (%) SEM
*p value
0 25 50 75 100 L Q
Palmitic (C16:0) 19.53 19.88 17.66 16.96 16.05 0.54 <.0001 0.2357
Palmitoleic (C16:1) 3.48 2.73 2.37 2.41 1.97 0.18 0.0010 0.6578
Stearic (C18:0) 9.89 9.50 10.57 9.38 9.37 0.23 0.1018 0.0965
Oleic (C18:1n9c) 24.42 26.68 26.90 25.57 24.53 0.82 0.0593 0.0654
Linoleic (C18:2n6c) 29.44 27.73 28.19 27.94 26.92 0.61 0.0186 0.0267
Linolenic (C18:3n3) 2.24 2.71 3.04 3.45 3.49 0.23 0.0002 0.1356
Eicosadienoic (C20:2n6) 1.39 1.36 1.58 1.25 1.19 0.15 0.3336 0.0467
Eicosatrienoic (C20:3n6) 3.08 2.83 2.03 1.85 1.62 0.17 <.0001 0.5672
Arachidonic (C20:4n6) 5.23 4.68 5.38 5.79 5.13 0.39 0.7256 0.6543
Saturated 29.43 29.39 28.24 28.34 25.88 0.64 0.0006 0.0976
Unsaturated 69.30 68.74 69.51 68.27 64.86 0.88 0.0634 0.0058
Monounsaturated 27.90 29.42 29.27 27.98 26.49 0.91 0.2126 0.2056
Polyunsaturated 38.39 39.33 40.23 40.29 38.37 0.83 0.1823 0.1789
Saturated: Unsaturated 0.43 0.43 0.41 0.42 0.40 0.01 0.1168 0.2395
n-3 polyunsaturated 3.64 4.08 4.63 4.70 4.68 0.27 0.0767 0.0056
n-6 polyunsaturated 34.67 32.42 33.57 33.73 32.06 0.84 0.3747 0.5678
n-6/ n-3 ratio 10.00 7.99 7.27 7.25 6.89 0.68 0.0042 0.4567
*p value = significance level at α = 0.05 by the fitted regression equation. 1L and Q - linear and quadratic effects, concerning the replacement levels. Fitted regression equation for:
It should also be noted that an increase in the canola meal content of the experimental diets was accompanied by a considerable increase in the soybean oil content, leading to an increase (p < 0.05) in the concentrations of linoleic acid. In agreement with Mikulski et al. (2012), it is possible to alter the lipid profile of broiler chicken meat through the type of lipid added to the diet.
However, meat products high in polyunsaturated fatty acids would be characterized as tender and therefore of lower quality. Polyunsaturated fatty acids can indirectly influence the collagen synthesis. The integrity of the collagen cross-links is related to the meat texture. Moreover, polyunsaturated fatty acids are more susceptible to lipid oxidation, and increasing levels in the meat make it more susceptible to oxidation as well (Mikulski, Jankowski, Zdunczyk, Juskiewicz, & Slominski, 2012).
Physical and Sensory characteristics
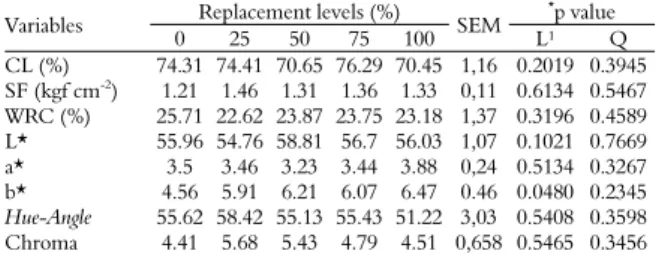
In this study, the characteristics of water retention capacity (WRC), shear force (SF), cooking loss (CL), L* (luminosity), a* (red color intensity), chroma (saturation) and Hue-Angle (tonality) of the breast meat were also not affected by the treatments. Only the variable b* (yellow color intensity) responded to the increase in levels of canola meal with an increasing linear regression equation (p = 0.048), as shown in Table 6.
Table 6. Physical characteristics of the breast meat of broilers fed canola meal.
Variables Replacement levels (%) SEM
*p value
0 25 50 75 100 L¹ Q
CL (%) 74.31 74.41 70.65 76.29 70.45 1,16 0.2019 0.3945 SF (kgf cm-2) 1.21 1.46 1.31 1.36 1.33 0,11 0.6134 0.5467 WRC (%) 25.71 22.62 23.87 23.75 23.18 1,37 0.3196 0.4589 L* 55.96 54.76 58.81 56.7 56.03 1,07 0.1021 0.7669 a* 3.5 3.46 3.23 3.44 3.88 0,24 0.5134 0.3267 b* 4.56 5.91 6.21 6.07 6.47 0.46 0.0480 0.2345
Hue-Angle 55.62 58.42 55.13 55.43 51.22 3,03 0.5408 0.3598 Chroma 4.41 5.68 5.43 4.79 4.51 0,658 0.5465 0.3456
CL: cooking loss; SF: shear force; WRC: water retention capacity;
*
p value = significance level at α = 0.05 by the fitted regression equation. 1
L and Q - linear and quadratic effects, concerning the replacement levels Fitted regression equation for b*: y = 5.048 + 0.0159x (r2 = 0.71).
Our findings do not corroborate those registered by Mikulski et al. (2012), who observed that the increase of canola meal led to an increase in cooking loss and a decrease in shear force, differing from the results of the present study. The fatty acid profile may influence the meat tenderness by means of different factors, including the part of the body where it is located, which could have a physical effect on the separation of the muscle fibers, starting the softening process by opening the muscular structure (Wood et al., 2003).
The average values found for chroma and Hue-Angle in this experiment are similar to those presented by Bianchi, Petracci, and Cavani (2006) for the Cobb line. These results corroborate those found by Mikulski et al. (2012), who obtained an increase in the intensity of yellow color (b* parameter) in the breast of broilers fed higher levels of canola meal in the diet. The color of the parameter b* varies according to the content of corn in the diet, which contains substances called xanthophylls, which confers yellow-orange color and are fat soluble (Silva, Albino, & Godoi, 2000). In the present experiment, at all stages, as the level of replacement of soybean meal with canola meal increased, also decreased the levels of corn in the diet as a consequence of a higher oil content required to maintain all treatments isoenergetic, as previously mentioned. As the pigmenting substances of the diet are fat-soluble, even with the reduced amount of corn in the diet, the increase in oil content may have facilitated the absorption of these substances, thereby, increasing the yellow intensity in the chicken breast (Mikulski et al., 2012).
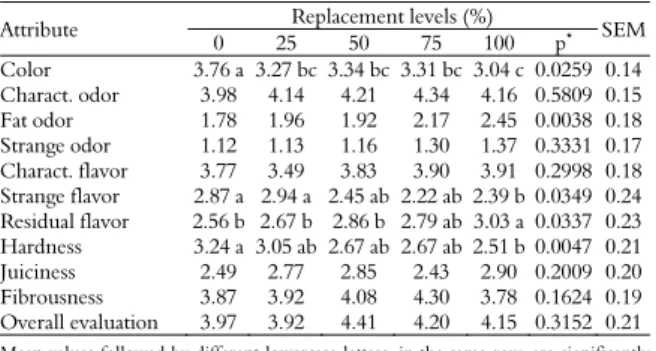
The replacement of soybean meal with canola meal in the diet for broiler chickens had no influence on the characteristic odor, strange odor, characteristic flavor, juiciness, fibrousness and overall evaluation. However, the averages of some attributes, such as color, fat odor, strange flavor and residual flavor were significantly different (p < 0.05) between the control and the treatment with 100% replacement of soybean meal with canola meal. It was also observed that the treatments with 25 and 50% substitution did not differ from the control treatment for these variables. The treatment with 75% substitution was similar to that with 100% substitution for the same variables. For the hardness, the control treatment differed from the treatments with 75 and 100% substitution.
Breast of chicken fed the treatment containing higher levels of canola showed more intense color than those of chickens that received the control treatment. This corroborates the results found in the instrumental analysis of the breast, resulting in a reduced intensity of yellow color as soybean meal was replaced with canola meal. Moreover, the consumer (Mikulski et al., 2012) does not desire this characteristic.
Acta Scientiarum. Animal Sciences Maringá, v. 38, n. 3, p. 267-274, July-Sept., 2016 those of birds fed the control diet, in relation to
these variables. However, the meat of chickens that fed diet containing 75% substitution was similar to that of birds that received a diet with 100% substitution for the aforementioned variables. Increased perception of these variables on the sensory attributes is undesirable for meat quality of the meat.
Table 7. Sensory characteristics of the breast meat of broilers fed canola meal.
Attribute Replacement levels (%) SEM
0 25 50 75 100 p*
Color 3.76 a 3.27 bc 3.34 bc 3.31 bc 3.04 c 0.0259 0.14 Charact. odor 3.98 4.14 4.21 4.34 4.16 0.5809 0.15 Fat odor 1.78 1.96 1.92 2.17 2.45 0.0038 0.18 Strange odor 1.12 1.13 1.16 1.30 1.37 0.3331 0.17 Charact. flavor 3.77 3.49 3.83 3.90 3.91 0.2998 0.18 Strange flavor 2.87 a 2.94 a 2.45 ab 2.22 ab 2.39 b 0.0349 0.24 Residual flavor 2.56 b 2.67 b 2.86 b 2.79 ab 3.03 a 0.0337 0.23 Hardness 3.24 a 3.05 ab 2.67 ab 2.67 ab 2.51 b 0.0047 0.21 Juiciness 2.49 2.77 2.85 2.43 2.90 0.2009 0.20 Fibrousness 3.87 3.92 4.08 4.30 3.78 0.1624 0.19 Overall evaluation 3.97 3.92 4.41 4.20 4.15 0.3152 0.21
Mean values followed by different lowercase letters, in the same row, are significantly different by Tukey’s test at α = 0.05.
The perception of taste can be associated with the ‘flavor’ that, according to Osório, Osório, and Sañudo (2009) is the set of smell and taste impressions caused at the moment of the consumption. The terminology ‘flavor’ encompasses the odor of food, linked to the existence of volatile compounds and to flavor, which have their origin in soluble substances. Yet according to the authors, ‘flavor’ is perceived at the moment of consumption, being developed before the introduction of the food in the mouth, during the chewing and during and after the swallowing, mutually influencing the other organoleptic characteristics, especially juiciness and texture-hardness, determining at the end, among all of them, the sensory acceptance by the consumer.
Wood et al. (2003) states that the most recognized difference in the flavor of poultry meat should result from differences in the lipid components. In the present experiment, the results of the proximate analysis of the breast meat of birds showed that there was an increase in the lipid content at 42 days of age, as the level of canola in the diet increased. This increase in the lipid content may have generated the differences in the organoleptic characteristics of the meat, influencing the ‘flavor’ of the food. Furthermore, the increase in the lipid content may also have influenced the perception of hardness of the meat, causing the meat with higher content of lipids to be considered softer by the trained panel, in this case, treatments with 50, 75 and 100% replacement of soybean meal with canola meal. According to Wood et al. (2003), the effect of
fatty acids on the tenderness is due to the different melting points of the individual fatty acids, especially the stearic and linoleic.
An importance of the sensory characteristics is observed at distinct moments. While the breast meat color is associated with the acceptability upon the acquisition of the product, the tenderness influences the overall acceptance during the tasting of the different culinary recipes of chicken meat.
Conclusion
Soybean meal can be replaced with canola meal at levels up to 25% of the total diet without affecting the carcass yield, proximate composition, fatty acid profile, instrumental or sensory characteristics of the meat from broilers.
References
Ahmad, G., Mirza, M. A., & Ahmad, Z. A. (2007). Comparative bioefficacy of lysine from L-lysine sulfate in basal diets containing graded levels of canola meal for female broiler chickens. Poultry Science, 86(3), 525-530.
Association of Official Analytical Chemists. (2000). Official methods of analysis (13th ed.). Arlington, TX: AOAC International.
Bianchi, M., Petracci, M., & Cavani, P. (2006). The influence of genotype, market live weight, transportation, and holding conditions prior to slaughter on broiler breast meat color. Poultry Science, 85(1), 123-128.
Bligh, E. G., & Dyer, W. J. (1959). A rapid method of total lipid extraction and purification. Canadian Journal of Biochemistry and Physiology, 37(2), 911-917.
Delezie, E., Swennen, Q., Buyse, J., & Decuypere, E. (2007). The effect of feed withdrawal and crating density in transit on metabolism and meat quality of broilers at slaughter weight. Poultry Science, 86(7), 1414-1423.
Duarte, F. D., Lara, L. J. C., Baião, N. C., Cançado, S. V., & Teixeira, J. L. (2010). Efeito da inclusão de diferentes fontes lipídicas em dietas para frangos de corte sobre o desempenho, rendimento e composição da carcaça. Arquivo Brasileiro de Medicina Veterinária e Zootecnia, 62(2), 439-444.
Franzoi, E. E., Siewerdt, F., Rutz, F., Brum, P. A. R., & Gomes, P. C. (2000). Composição de carcaça de frangos de corte alimentados com farelo de canola.
Ciência Rural, 30(2), 337-342.
Gopinger, E., Xavier, E. G., Lemes, J. S., Moraes, P. O., & Elias, M. O. (2014). Carcass yield and meat quality in broilers fed with canola meal. British Poultry Science, 55(6), 817-823.
Khajali, F., Saedi, M., & Slominski, B. A. (2011) The effect of low chloride and high bicarbonate diets on growth, blood parameters, and pulmonary hypertensive response in broiler chickens reared at high altitude. Archiv fur Geflugelkunde, 75(3), 235-238. Li, C., Yang, H., Wang, L., & Tian, S. (2006). Application
of gas chromatography in research of biodiesel processing. Chinese Journal of Chromatography, 24(5), 524-528.
Mikulski, D., Jankowski, J., Zdunczyk, Z., Juskiewicz, J., & Slominski, B. (2012). The effect of different dietary levels of rapeseed meal on growth performance, carcass traits, and meat quality in turkeys. Poultry Science, 91(1), 215-223.
Oliveira Neto, A. R., Oliveira, R. F. M., Donzele, J. L., Rostagno, H. S., Ferreira, R. A., & Carmo, H. M. (2000). Níveis de energia metabolizável para frangos de corte no período de 22 a 42 dias de idade mantidos em ambiente termoneutro. Revista Brasileira de Zootecnia, 29(4), 1132-1140.
Osório, J. C. S., Osório, M. T. M., & Sañudo, C. (2009). Características sensoriais da carne ovina. Brazilian Journal of Veterinary Research and Animal Science, 38(1), 292-300.
Rostagno, H. S., Albino, L. F. T., Donzele, J. L., Gomes, P. C., Oliveira, R. F., Lopes, D. C., … Euclides, R. (2011). Tabelas brasileiras para aves e suínos: composição de alimentos e exigências nutricionais (3th ed.). Viçosa, MG: DZO.
Sañudo, C., Enser, M. E., & Campo, M. M. (2000). Fatty acid composition and sensory characteristic of lamb carcasses from Britain and Spain. Meat Science, 54(4), 339-346.
Silva, J. H. V., Albino, L. F. T., & Godoi, M. J. S. (2000). Efeito do extrato de urucum na pigmentação da gema dos ovos. Brazilian Journal of Veterinary Research and Animal Science, 29(5), 1435-1439.
Stanaćev, V., Milić, S., Marjanović, A., Stanaćev, V., Milošević, N., & Puvača, N. (2013). Rapeseed meal in non-ruminant nutrition. Macedonian Veterinary Review, 3(1), 69-73.
Statistical Analysis System. (2002). SAS user’s guide: statistics. Cary, NC: SAS Institute Inc.
Stone, H., & Sidel, J. L. (1998). Quantitative descriptive analysis: developments, applications and the future.
Food Technology, 52(3), 48-52.
Wood, J., Richardson, R., Nute, G., Fisher, A., Campo, V., Kasapidou, E., … Enser, M. (2003). Effects of fatty acids on meat quality: A review. Meat Science, 66(1), 21-36.
Received on March 7, 2016. Accepted on April 27, 2016.
License information: This is an open-access article distributed under the terms of the Creative Commons Attribution License, which permits unrestricted use, distribution, and reproduction in any medium, provided the original work is properly cited.