Free choice profiling, acceptance...
613
FREE CHOICE PROFILING, ACCEPTANCE AND PURCHASE
INTENTION IN THE EVALUATION OF DIFFERENT
BISCUIT FORMULATIONS
Perfil livre, aceitação e intenção de compra na avaliação de diferentes formulações de biscoitos
Dayane Angélica Machado dos Santos1, Juliana da Silva Tomé Lobo1, Lidiane Medella Araújo1, Rosires Deliza2, Paulo Sérgio Marcellini3
ABSTRACT
The increased demand for differentiated and health-oriented food has driven the development of bakery products with specific
nutritional and sensory characteristics. The aim of this study was to compare four different biscuits: two commercial (sugar-free and
gluten-free) and two experimental formulations (standard and source of extra fiber). The cookie with added fiber had passion fruit albedo and pumpkin peel added to its formulation, as well as reduced wheat flour contentcompared with the standard formulation. These alterations aimed to achieveboth nutritional and economic benefits.The Free Choice Profiling methodology was used, and the data were subjected to Generalized Procrustes Analysis. The analysis was performed separately by attribute classes (appearance,
aroma, flavor and texture).The percentage of variance explained in the first dimension was 87.6%for texture, and the sum of the
first two dimensions was greater than 90% for all four attributes.Both experimental formulations were characterized as having
a yellowish color, flattened appearance, passion fruit aroma, natural aroma, passion fruit flavor, passion fruit residual flavor, soft
texture and compact texture. Therefore, the addition of byproducts in the standard formulation did not qualitatively change the
characteristic attributes. The products were also evaluated on a 9-point hedonic scale, and the data were statistically evaluated by
analysis of variance (ANOVA).When compared by affective analysis, the formulation with added fiber and the commercial biscuits
showed no significant difference regarding flavor and intent to purchase. Thus, the cookie developed herein has promising market potential, and it presents additional benefits due to its economic and nutritional appeal.
Index terms: Sensory analysis; product development; bakery products.
RESUMO
O aumento da demanda por alimentos diferenciados e voltados para a saúde tem impulsionado o desenvolvimento de produtos
de panificação, com características nutricionais e sensoriais peculiares. Neste estudo, objetivou-se comparar diferentes biscoitos, dois comerciais (dietético e sem glúten) e duas formulações experimentais (uma fonte de fibra e a outra, padrão). O biscoito fonte de fibra foi acrescido de albedo de maracujá e casca de abóbora e reduzido de farinha de trigo em relação ao padrão, visando a benefícios nutricionais e econômicos. A metodologia de Perfil Livre foi utilizada e os dados do Perfilforam submetidos à Análise Procrustes
Generalizada.A análise foi realizada separadamente por classe de atributos (aparência, aroma, sabor e textura).A porcentagem de
variância explicada da primeira dimensão foi de 87,6% para a textura, e a soma das duas primeiras dimensões foi superior a 90% para os quatro atributos. Ambas as formulações desenvolvidas evidenciaram as características: cor amarelada, aparência achatada, aroma de maracujá, aroma natural, sabor maracujá, sabor de maracujá residual, textura macia e textura compacta. Portanto, a adição de subprodutos na formulação padrão não alterou seus atributos característicos, qualitativamente. Os produtos também foram avaliados afetivamente, por meio de uma escala hedônica de 9 pontos, e os dados foram estatisticamente avaliados por análise de variância
(ANOVA).A formulação fonte de fibra e as comerciais não apresentaram diferença significativa em relação ao sabor e intenção de
compra. Assim, o biscoito desenvolvido tem um potencial de mercado promissor, além de apresentar benefícios adicionais, por seu
apelo econômico e nutricional.
Termos para indexação: Análise sensorial; desenvolvimento de produtos; produtos de padaria.
1Universidade Federal do Estado do Rio de Janeiro/UNIRIO – Departamento de Tecnologia dos Alimentos – Rio de Janeiro – RJ – Brasil 2Empresa Brasileira de Pesquisa Agropecuária/EMBRAPA – Agroindústria de Alimentos – Rio de Janeiro – RJ – Brasil
3Universidade Federal do Estado do Rio de Janeiro/UNIRIO – Departamento de Tecnologia dos Alimentos – Avenida Pasteur – n. 296 – 3° andar –
Urca – 22290-180 – Rio de Janeiro – RJ – Brasil – [email protected] Received in february 12, 2015 and approved in october 5, 2015
INTRODUCTION
Cookies are products with recognized commercial success, which is partly due to the diversity of formulations available on the market, and Brazil is the second largest
biscuit producer (Associação Nacional de Biscoitos-ANIB, 2013). Moreover, according to Villemejaneet al.
facilitated an increase in fiber content and antioxidant capacity. However, different levels of added peel resulted in differences in product acceptance.
Furthermore, understanding which attributes are responsible for the acceptance of a product is essential for the development of new formulations. Quantitative descriptive analysis is an example of a conventional profiling technique (Deliza; Macfie; Hedderley, 2005; Chollet et al., 2011). Ferreira et al. (2009), for example,
performed QDA of gluten free cookies prepared with sorghum flour.
Additionally, the hypothesis that consumers are able to accurately describe products is becoming increasingly accepted within the sensory science community (Varela; Ares, 2012), thus expanding the use of Free Choice Profiling. One advantage of this method is that the assessors, who are untrained, can be regarded as representative of naive consumers (Richter et al., 2010;
Chollet et al., 2011).
FCP has recently been employed for the profiling of many different products, including dry-cured ham (Guàrdia et al., 2010) and honey (Vit; Deliza; Pérez, 2011).
In fact, there have been studies that used FCP to investigate the sensory properties of cookies. Mareti, Grossmann and Benassi (2010) developed biscuits with potential hypocholesterolemic properties by combining defatted soy flour and oat bran as a partial substitute for wheat flour, and they evaluated the product sensory characteristics by FCP. This work evaluates the sensory characteristics of a novel cookie fiber source. The key ingredient used in this new formulation was a mixed flour composed of passion fruit albedo and pumpkin peel to replace part of the wheat flour. The albedo is considered a soluble fiber source, which can promote positive effects on glycemic regulation and serum lipid profile when ingested (Zeraik et al., 2010); however, it is typically discarded during the industrial production of juices. Moreover, in addition to fiber, pumpkin peel contains carotenes, which are active components that have antioxidant function and are precursors to vitamin A(Veronezi; Jorge, 2011).
Therefore, a nutritionally improved formulation with added by-products and greater economic viability was compared to other formulations by the research presented herein. The quality of this developed product was analyzed in a broader perspective by studying the sensory attributes of a product, together with its acceptance, which is essential from a technological standpoint. Thus, the aim of this study was to profile four different formulations of cookies using FCP to identify the main sensory attributes of the formulation containing the developed fiber source.
MATERIAL AND METHODS Material
Four samples of biscuits were used in this study: two experimental formulations, the cookie made with byproducts (1) and a standard cookie (2), and two commercial brands purchased at natural food stores, a gluten-free cookie with passion fruit (3) and a sugar-free passion fruit biscuit (4).
To formulate cookies 1 and 2, the following ingredients were used: wheat flour (223.2 g), refined sugar (100 g), margarine tablets (67.5 g) and baking powder (5 g). In addition to these ingredients, passion fruit albedo and pumpkin peel were added to formulation 1 by replacing 14% of the wheat flour with 8% albedo and 6% pumpkin peel flours. Passion fruit juice was also added to both formulations, 60 ml (formulation 1) and 50 ml (formulation 2), for hydration of the dough. The experimental formulations (1 and 2) were divided into 12 g portions and molded into a disc format using a fork.
The commercial biscuits were chosen based on their similarity to the formulated samples, which was determined by checking the labels of the only products available in the local market that mentioned the ingredients “pumpkin” and “passion”, key components of the developed product. According to the information on the label, the descriptions of the commercial products are as follows:
- “Cookie with passion fruit” without gluten. Ingredients: rice flour, corn starch, cassava starch, brown sugar, potato starch, crystal sugar, palm fat, molasses, soy flour, egg powder, sodium bicarbonate, ammonium bicarbonate, salt and aroma identical to natural passion fruit. Serving Size - 14 g (1 unit).
- “Biscuit of passion fruit” (sugar free). Ingredients: wheat flour enriched with iron and folic acid, corn starch, margarine, dried whole egg and passion fruit juice, and flavoring identical to natural passion fruit. Serving Size - 9 g (average of 3 µnits).
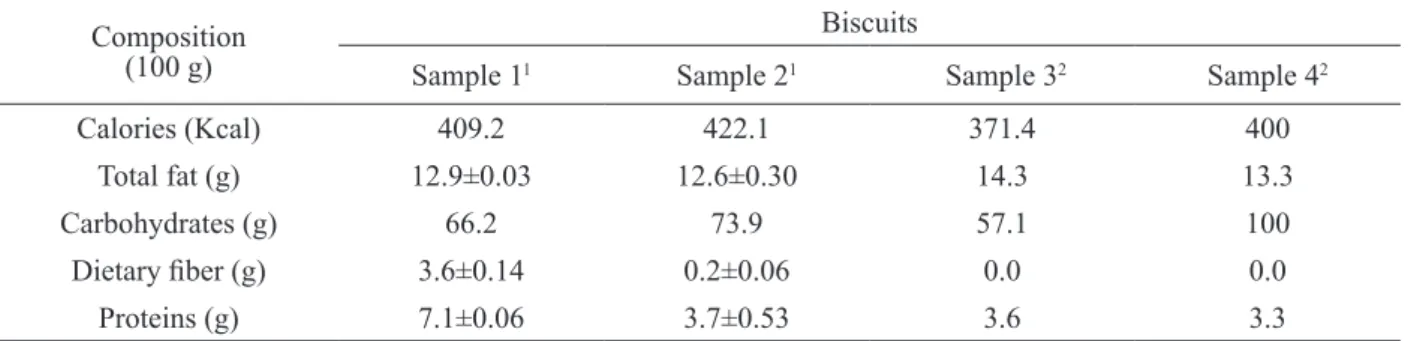
Table 1: Nutritional information for the samples.
Composition (100 g)
Biscuits
Sample 11 Sample 21 Sample 32 Sample 42
Calories (Kcal) 409.2 422.1 371.4 400
Total fat (g) 12.9±0.03 12.6±0.30 14.3 13.3
Carbohydrates (g) 66.2 73.9 57.1 100
Dietary fiber (g) 3.6±0.14 0.2±0.06 0.0 0.0
Proteins (g) 7.1±0.06 3.7±0.53 3.6 3.3
1Chemical determinations; 2Nutrition Facts.
The fiber content of the optimized formulation (Sample 1) is superior to the other formulations, and a value of 3.6 g% allows classification of the developed product as a “fiber source” according to Brazilian law (Brasil, 2012). Additionally, the total protein in formulation 1 is nearly double the content present in the other samples.
Free choice profile
Panelist selection. A group of administrative staff and students was recruited from the university. They met the following inclusion criteria: completed high school; absence of flu or of any degree of gluten intolerance; and age less than 65 but greater than 18 years. The sensory capacity of the assessors was verified to detect disabilities and to check their sensory keenness, as recommended by Aparicio, Medina and Rosales (2007) in their study utilizing FCP. In the present study, to select participants, triangular tests were applied using samples that were significantly different with a probability greater than 95% (Oliveira; Benassi, 2010). This same method was also applied to discriminate the samples used in the selection test for candidates (Zenebon et al.,2008). The two test
samples used originated from the standard formulation, and the sugar concentration was varied until a degree of difference was detectable by triangular test with 30 panelists. The samples used for the selection of panelists exhibited significant difference at the level of 0.1%, as determined by discriminatory test, and had 70% and 110% of the sugar contained in the standard formulation. Each assessor performed the test in triplicate on the same day with a 15 minute break between sessions. We accepted assessors who had three consecutive hits in these tests using the two samples with predetermined difference.
Glossary development. The attribute terms for the evaluation of the samples were developed by the panel using the Repertory Grid Method, which has been applied in previous research (González-Tomás; Costell,
2006; Richter et al., 2010). The assessors were requested
to record the similarities and differences between a pair of samples. One pair was composed of samples 1 and 3 (enriched x gluten-free) and the other pair was samples 2 and 4 (sugar free x standard). After this assessment, based on the individual descriptors generated, individual score sheets were prepared by the interviewer.
Evaluation of the samples. Attributes were evaluated using an unstructured 9 cm scale anchored at the endpoints by intensity terms. To verify the score sheets’ adequacy, a simulation of the sample evaluation was constructed. This occurred in one session where all samples were evaluated to outline the procedure and familiarize the assessors with the sheets that they would have to use when evaluating samples. The assessors could modify their score sheets, changing the terms at the endpoints of the scales (Richter et al., 2010). This step was
During sensory analysis, the samples were labeled with random three-digit codes, and water was provided for mouth-rinsing between samples. The samples were presented in a sequential and monadic form, and the presentation order was randomized.
Affective tests
The two affective tests employed were acceptance and purchase intent, with the participation of 100 consumers. To evaluate acceptance, a 9-point hedonic scale was used that contained terms between “liked extremely” (corresponding to 9) and “extremely disliked” (equivalent to 1) at the extremes (Zenebon et al., 2008;
Mareti; Grossmann; Benassi, 2010). However, for the test of intent or attitude to purchase, a 5-point scale was used. The numerical scores generated during the evaluations using both scales were statistically analyzed to determine the difference in the degree of preference among products. The presentation order of samples (1, 2, 3 and 4) was randomized.
Data analysis
The results of the triangular test were interpreted in accordance with tabulated values. The data from the affective tests were statistically evaluated by analysis of variance (ANOVA) and then compared using a Tukey test (Zenebon et al., 2008). For these analyses,
the program ASSISTAT, version 7.6, was used. The data from the FCP were submitted to Generalized Procrustes Analysis, and a consensus matrix was obtained using mathematical data operations such as translation, rotation/reflection and scaling (Deliza; Macfie; Hedderley, 2005). The program used to make these statistical analyses was XLSTAT.
A correlation criterion of 0.8 was adopted to select the attributes. This value was the same used by González-Tomás and Costell (2006), but more rigid than the value of 0,6 used by Guàrdia et al. (2010).
RESULTS AND DISCUSSION Free choice profiling
From the total of 48 selected participants, 30 were not approved. After dropouts, 15 assessors were maintained. Heymann et al. (2012) sought to assess how
many judges should be used for sensory descriptive analysis. The results of this study indicated some variability in the minimum number of panelists that gave a stable result, but in general, at least 8 is recommended.
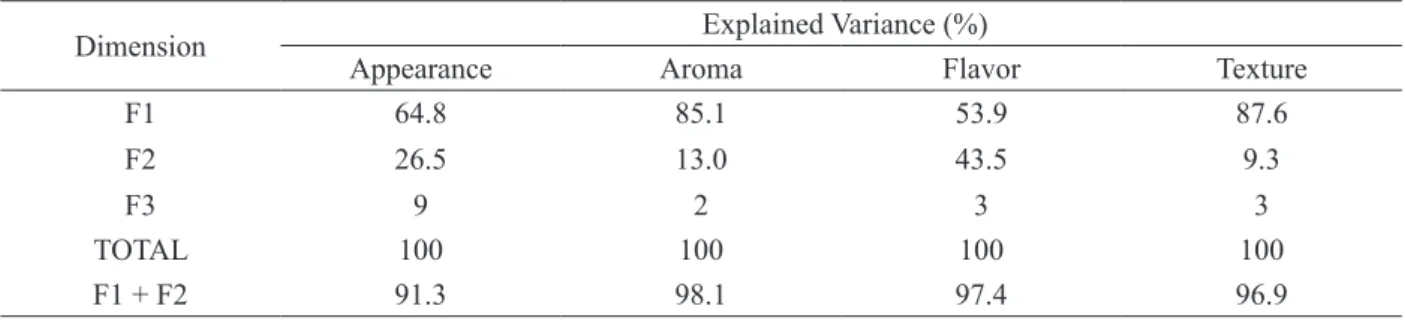
The participants mentioned a total of 98 descriptors. However, a portion of the attributes mentioned did not show high correlation with the main dimensions generated by the GPA; therefore, certain descriptors were not essential to distinguish and characterize the samples. After analyzing the data, it was apparent that only three dimensions of the consensus configuration were sufficient to explain the total variability of the results (Table 2), whereas the work by Gonzáles-Tomás and Costell (2006) required more than ten dimensions.
Richter et al. (2010), considering their consensus
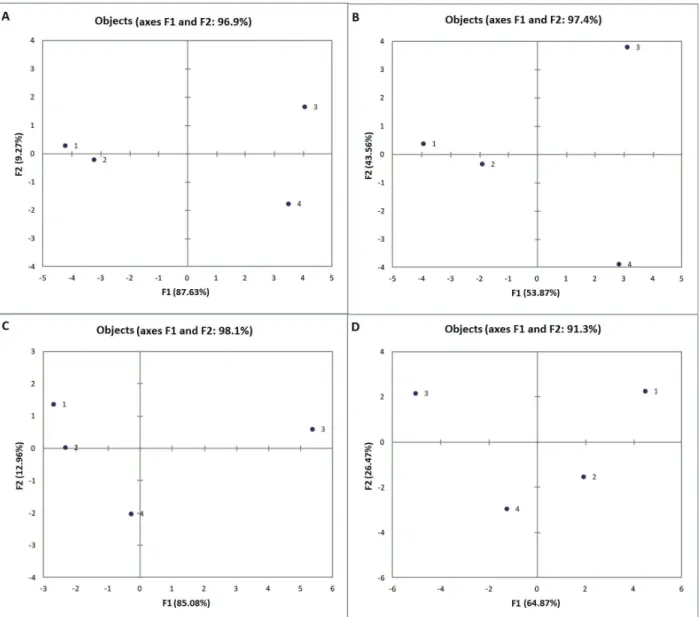
configuration, found that only 38% of the observed variability was explained by the FCP, and they determined that the largest dimension (first) was accountable for only 25%. Thus, the percentage of explanation of the first dimension, which ranged from 53.9% to 87.6% (referring to the flavor and texture attributes, respectively), was considered relatively high. Here, when the four classes of attributes studied were evaluated separately by GPA, more than 90% of the variance could be explained in the consensus configuration of the group (in all four cases) by the first two dimensions (Table 2). For Guàrdiaet al. (2010) with hams and Vit, Deliza and Pérez
(2011) with honey, 83.7% and 64.2% of the explanation was attributed to the total of the first two dimensions, respectively. Therefore, the samples were discussed in a two-dimensional solution, as used in this current work, where the sum of the percentage of explanation for the first two dimensions was greater, ranging from 91.34% to 98.05%.
Table 2: Results of the procrustes analysis of variance per dimension.
Dimension Explained Variance (%)
Appearance Aroma Flavor Texture
F1 64.8 85.1 53.9 87.6
F2 26.5 13.0 43.5 9.3
F3 9 2 3 3
TOTAL 100 100 100 100
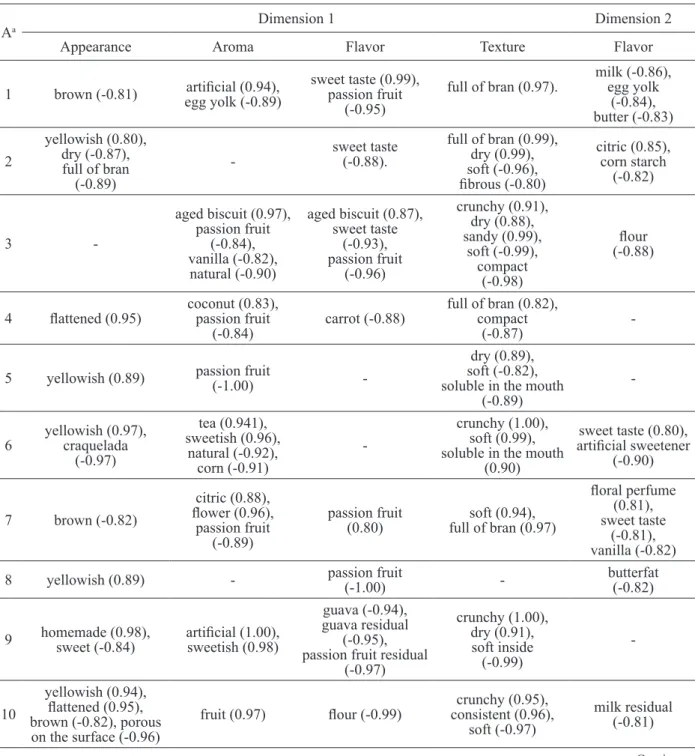
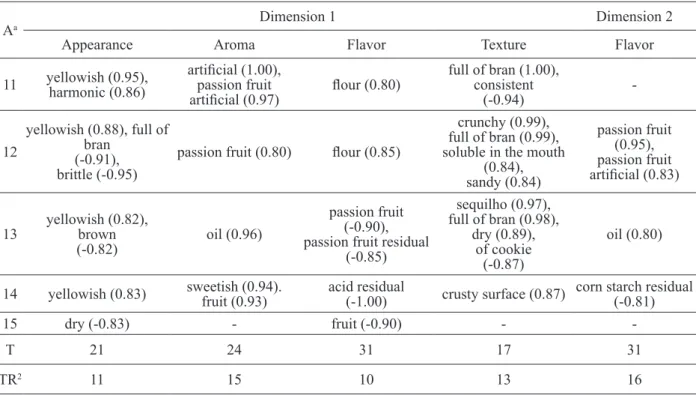
In Table 3, the attributes that were highly correlated (r2 > 0.8) in the first dimension are enumerated, which are
responsible for explaining most of the variability observed. Results of the second dimension were exposed only for
the flavor attribute, as the percentage of explanation or the weight of these two dimensions was closer (54 and 44%, respectively) in this case when compared to other attributes.
Table 3: Attributes better correlated (r2 > 0.8) with the main dimensions for each assessor on fcp.
Aa Dimension 1 Dimension 2
Appearance Aroma Flavor Texture Flavor
1 brown (-0.81) egg yolk (-0.89)artificial (0.94), sweet taste (0.99),passion fruit (-0.95)
full of bran (0.97). milk (-0.86),egg yolk (-0.84), butter (-0.83)
2
yellowish (0.80), dry (-0.87), full of bran
(-0.89)
-sweet taste (-0.88).
full of bran (0.99), dry (0.99), soft (-0.96), fibrous (-0.80) citric (0.85), corn starch (-0.82) 3
-aged biscuit (0.97), passion fruit
(-0.84), vanilla (-0.82), natural (-0.90)
aged biscuit (0.87), sweet taste (-0.93), passion fruit (-0.96) crunchy (0.91), dry (0.88), sandy (0.99), soft (-0.99), compact (-0.98) flour (-0.88)
4 flattened (0.95) coconut (0.83),passion fruit
(-0.84) carrot (-0.88)
full of bran (0.82), compact
(-0.87)
-5 yellowish (0.89) passion fruit(-1.00)
-dry (0.89), soft (-0.82), soluble in the mouth
(-0.89)
-6 yellowish (0.97), craquelada (-0.97) tea (0.941), sweetish (0.96), natural (-0.92), corn (-0.91) -crunchy (1.00), soft (0.99), soluble in the mouth
(0.90)
sweet taste (0.80), artificial sweetener
(-0.90)
7 brown (-0.82)
citric (0.88), flower (0.96),
passion fruit (-0.89)
passion fruit
(0.80) full of bran (0.97)soft (0.94),
floral perfume (0.81), sweet taste
(-0.81), vanilla (-0.82) 8 yellowish (0.89) - passion fruit(-1.00) - butterfat(-0.82)
9 homemade (0.98),sweet (-0.84) artificial (1.00),sweetish (0.98)
guava (-0.94), guava residual
(-0.95), passion fruit residual
(-0.97) crunchy (1.00), dry (0.91), soft inside (-0.99) -10 yellowish (0.94), flattened (0.95), brown (-0.82), porous on the surface (-0.96)
fruit (0.97) flour (-0.99) consistent (0.96),crunchy (0.95), soft (-0.97)
milk residual (-0.81)
Aa Dimension 1 Dimension 2
Appearance Aroma Flavor Texture Flavor
11 yellowish (0.95), harmonic (0.86) artificial (1.00),passion fruit
artificial (0.97) flour (0.80)
full of bran (1.00), consistent
(-0.94)
-12
yellowish (0.88), full of bran
(-0.91), brittle (-0.95)
passion fruit (0.80) flour (0.85)
crunchy (0.99), full of bran (0.99), soluble in the mouth
(0.84), sandy (0.84)
passion fruit (0.95), passion fruit artificial (0.83)
13 yellowish (0.82),brown
(-0.82) oil (0.96)
passion fruit (-0.90), passion fruit residual
(-0.85)
sequilho (0.97), full of bran (0.98),
dry (0.89), of cookie
(-0.87)
oil (0.80)
14 yellowish (0.83) sweetish (0.94).fruit (0.93) acid residual
(-1.00) crusty surface (0.87) corn starch residual (-0.81)
15 dry (-0.83) - fruit (-0.90) -
-T 21 24 31 17 31
TR2 11 15 10 13 16
aAssessors were identified by numbers 1-15. The meaning of “craquelado” in Portuguese: appearance of cracks and grooves on a surface, generally referring to a rustic look. The meaning of “sequilho”: a popular type of cookie in Brazil whose main ingredient is corn starch. T: total number of attributes. TR2: total number of attributes with R2 > 0.8.
Table 3: Continued...
The average sample space obtained from the GPA is shown in Figure 1. Furthermore, Table 3 helps interpret the dimensions of the average space obtained, which were interpreted considering the descriptors most highly correlated with each dimension for each assessor. Therefore, by comparing the attributes with high positive and negative correlations (Table 3) with the consensus configuration of the samples in the main dimensions (Figure 1), it is possible to relate the raised attributes with the studied samples. However, to facilitate the interpretation of the results, the attributes discussed here were those that showed high correlation by more than one assessor (Richter et al., 2010), as the other attributes contributed in a smaller degree to the discrimination of the samples.
When assessing the texture, 8 terms were found to have high correlation with the first dimension considering different assessors (Table 3). The attribute “full of bran” showed 7 positive correlations in the 7 times it was cited. The other attributes that were positively correlated with dimension 1 were “dry”, “crunchy” and “sandy”. The second attribute with the
highest frequency of high correlation was “soft”, which was in the negative region. Accordingly, samples 1 and 2 were characterized as having a softer texture compared to the others. In contrast, samples 3 and 4 presented a texture that was more “full of bran”, “dry” and “crunchy”. Notably, due to lack of consensus on the term “consistent” (same number of positive and negative correlations), this term was not considered important in the description of the samples.
Mareti, Grossmann and Benassi (2010) performed FCP on cookies containing defatted soy flour and oat bran, and they noted that the attributes of softness and sweet taste significantly contributed to the differentiation of the samples being correlated with the main dimensions studied by the authors. In the present study, however, despite being among the most cited, the descriptor “sweet taste” had a questionable role in discrimination of the samples, as discussed earlier. In contrast, the texture attribute “soft” was crucial for the characterization of the samples, much as it was in the cited study.
difference in frequency, such as the descriptors “passion fruit” and “flour”. In these two cases, there was high correlation for more assessors in dimension 1, where it was mostly negative for the first attribute and positive for the second. This dimension also separated samples by the flavor attribute of “passion fruit residual”, which appeared twice in the negative region. The “sweet taste” attribute also showed high correlation for some judges; however, the presence of positive and negative correlations in both dimensions its interpretation was complex, suggesting that the samples did not show significant differences
with respect to this attribute. Thus, dimension 2 was not decisive for the separation of the samples by the flavor, due to the lack of consensus among the panelists. Therefore, based on these coordinates, formulations 1 and 2 were characterized by flavors of “passion fruit” and “passion fruit residual” and samples 3 and 4 presented the flavor of “flour” (Figure 1).
Regarding aroma, 5 of the generated attributes were highly correlated with dimension 1 for 2 or more assessors (Table 3). The term “passion fruit aroma” was what contributed most to the distinction of samples.
In addition, it was the term that presented the highest frequency of high correlations (5 assessors), which were mostly negative. In addition to this term, only the descriptor “natural aroma” showed high negative correlation for more than one assessor. Thus, samples 1 and 2 are strongly characterized by the attributes “passion fruit aroma” and “natural aroma”, as was sample 4 but to a lesser degree. The aroma attributes of “artificial” and “natural” appeared in opposite regions of the graph in the same manner that the developed products appeared far from the commercial products on dimension 1 (in particular, sample 3).
Results for appearance indicated that 5 terms had high correlation in dimension 1 (Table 3) for more than one assessor. The descriptor “yellowish” was the term with the highest frequency of high correlation and was also the most cited (9 correlations with 13 citations). Secondly, the descriptor “dry appearance” stands out, presenting high correlation for the two times it was cited (i.e., all), along with the terms “full of bran” and “flattened” (both with 2 correlations and 3 quotes). Samples 1 and 2, located in the positive region of the graph, are characterized by a yellowish color and a flattened appearance because they positively correlate with these descriptors. In contrast, samples 3 and 4, in the negative area, were distinguished by the appearance attributes of “dry” and “full of bran”, all with high negative correlations (Figure 1).
Assessor performance was considered appropriate because the majority of the panelists (1, 2, 6, 7, 9, 10, 11 and 12) generated more than 50% of the attributes with high correlation in relation to the total number of terms generated individually (Table 4). Using this criterion, the taster who had the best performance was number 3. Taster 15 had the worst performance and was consequently given a lower contribution to the discussed results in relation to the other members.
Affective tests
In Table 4, the samples can be distinguished by their potential to please consumers.
Regarding appearance, there was no significant difference between the optimized cookie (Sample 1) and the sugar-free biscuit, but the acceptance of these was higher compared to the standard (2) and the gluten-free (3) cookies, which also had no significant differences between themselves (Table 4). For the aroma, there were no differences among the four samples.
With respect to flavor, the gluten-free formulation showed a mean that was significantly lower compared to the standard (2) and the sugar-free (4) biscuits. The disadvantage of formulation 3 compared to the standard cookie (2) can be attributed to the presence of a characteristic “flour” flavor for the former. In contrast, although this descriptor also characterized formulation 4, the difference in acceptance between these two formulations can be explained by other apparently unfavorable attributes with high correlation but low frequency, such as “passion fruit artificial” and “floral perfume”, which has not been previously discussed. In other words, due to their high correlation with the second dimension in the positive region, these two descriptors contribute to the characterization of sample 3, and justify, in part, the distance of this formulation relative to sample 4 (from a descriptive and affective point of view).
For texture, the sugar-free biscuit stood out compared to the others, receiving superior evaluations. This product was characterized as having a texture that was more “full of bran”, “dry”, “crunchy”, “sandy” and “soluble in the mouth”. While these attributes also characterize sample 3, which obtained a lower acceptance, sample 4 presented a slightly softer texture and was more compact than sample 3. This indicates that the intensity of these two attributes cooperate to determine acceptability between the two commercial products studied. Ormenese et al. (2001) employed QDA for different brands of stuffed cookies and noted that the formulation that presented better acceptance by consumers demonstrated that attributes such as crunchiness and good dissolution were very important characteristics for market preference.
Table 4: Percentage of high correlation of attributes by taster.
Assessors performance
Assessors 1 2 3 4 5 6 7 8 9 10 11 12 13 14 15
T 16 14 15 13 13 15 16 8 16 17 13 15 20 13 10 TR2* 10 10 13 6 5 11 10 3 11 10 7 11 10 6 2
% of attributes with high correlation 63 71 87 46 38 73 63 38 69 59 54 73 50 46 20
In assessing the overall impression, the averages of the products ranged from 6.0 to 7.3, covering the region of the scale corresponding to “liked slightly” and “liked moderately”. For purchase intention, the mean values ranged from 3.0 to 3.6, which was between “probably would not buy” and “probably would buy”. The results from the overall impression corroborate the data for intent of purchase, with the highest averages for the optimized (1), standard (2) and sugar free (4) formulations, which did not differ statistically among themselves. The gluten free cookie (3), however, had a lower average than the others for the overall impression attribute, corresponding to the term “liked slightly” (6). Moreover, for purchase intent, there was no difference between this and the optimized (1) biscuit.
The optimized formulation (Sample 1) that we developed obtained average grades ranging from 6.57 to 7.65 (between “liked slightly” and “liked moderately”) for different attributes using the same scale, which suggests the best acceptability. Furthermore, the data obtained in
the current work also confirm that the developed product (sample 1) was well accepted because when compared to the other samples, the optimized cookie (1) showed lower averages only for texture (Table 5).
Thus, it can be assumed that the developed formulation using mixed flours has a marketing potential comparable to products already on the market. In addition, the optimized cookie (1) has the advantage of being a source of fiber, and thus a nutritionally improved product. Moreover, the developed flour was obtained from the incorporation of byproducts that are typically usually disposed, thus implicitly favoring a reduction in final cost and an increase in affordability.
The mean age of the 100 volunteers that participated in the acceptance testing was 27 years and most were women (75%) with incomplete higher education and current student status. Therefore, it is possible that the developed product has good adhesion among consumers fitting this profile due to the good acceptability demonstrated by the group of volunteers.
Table 5: Acceptance and purchase intention of formulations.
Samples Average scores by attribute - Acceptance analysis Purchase intention
Appearance Aroma Flavor Texture Overall impression
(1) 7.6±1.5a2 6.9±1.6a 6.6±1.9ab 6.8±2.0b 6.8±1.7a 3.3±1.1ab
(2) 7.0±1.8b 6.8±1.6a 7.2±1.7a 6.8±2.0b 7.0±1.6a 3.5±1.1a (3) 6.5±2.0b 6.6±1.9a 5.9±2.5b 6.5±2.3b 6.0±2.2b 3.0±1.3b (4) 8.0±1.4a 6.9±1.8a 7.1±1.7a 7.8±1.6a 7.3±1.5a 3.6±1.2a
MSD1 0.62 0.64 0.72 0.73 0.65 0.43
1Minimum Significant Difference; 2Means with the same letter in the same column indicate absence of significant difference
CONCLUSIONS
Samples 1 and 2 were both characterized as having a yellowish color, flattened appearance, passion fruit aroma, natural aroma, passion fruit flavor, passion fruit residual flavor, soft texture and compact texture. This demonstrates that the inclusion of mixed flours in formulation 2 essentially did not qualitatively change its characteristic attributes, and this change had little influence on the acceptance, considering that a significant difference between these two samples was only detected for appearance.
Results from the affective tests suggest that the formulation developed in our laboratory has marketing potential that is comparable to the products already on the market. Additionally, this product presents additional benefits due to its economic and nutritional appeal.
REFERENCES
AJILA, C. M.; LEELAVATHI, K.; PRASADA RAO, U. J. S. Improvement of dietary fiber content and antioxidant properties in soft dough biscuits with the incorporation of mango peel powder. Journal of Cereal Science, 48(2):319-326, 2008.
ANIB. Associação Nacional de Biscoitos. 2013. Mercado: dados estatísticos. Available in: http:// www.anib.com.br/dados_estatisticos.asp. Access in: may, 2, 2013.
APARICIO, J. P.; MEDINA, M. A. T.; ROSALES, V. L. Descriptive sensory analysis in different classes of orange juice by a robust free-choice
profile method. Analytica Chimica Acta,
595(1-2):238-247, 2007.
BRASIL. Ministério da Saúde. Agência Nacional de Vigilância Sanitária. Resolução nº 54, de 12 de novembro de 2012. Regulamento técnico sobre informação nutricional complementar (declarações de propriedades nutricionais). Diário Oficial [da] República Federativa do Brasil, Poder Executivo, Brasília, DF.
CHOLLET, S. et al. Sort and beer: Everything you wanted to know about the sorting task but did not dare to ask. Food Quality and Preference, 22(6):507-520, 2011.
DELIZA, R.; MACFIE, H.; HEDDERLEY, D. The consumer sensory perception of passion-fruit juice using free-choice profiling. Journal of Sensory Studies, 20(1):17-27, 2005.
FERREIRA, S. M. R. et al. Cookies sem glúten a partir da farinha de sorgo. Archivos Latinoamericanos de Nutrición, 59(4):433-440, 2009.
GONZÁLEZ-TOMÁS, L.; COSTELL, E. Sensory evaluation of vanilla-dairy desserts by repertory grid method and free choice profile. Journal of Sensory Studies, 21(1):20-33, 2006.
GUÀRDIA, M. D. et al. Sensory characterization of dry-cured ham using free-choice profiling. Food Quality and Preference, 21(1):148-155, 2010.
HEYMANN, H. et al. How many judges should one use for sensory analysis? Journal of Sensory Studies, 27(2):111-122, 2012.
MARETI, M. C.; GROSSMANN, M. V. E.; BENASSI, M. T. Physical and sensorial characteristics of cookies containing defatted soy flour and oat bran. Ciência e Tecnologia de Alimentos, 30(4):878-883, 2010.
OLIVEIRA, A. P. V.; BENASSI, M.T. Sensory
evaluation of sweetened and dietetic chocolate puddings by free-choice profile. Ciência e Agrotecnologia, 34(1):146-154, 2010.
ORMENESE, R. C. S. C. et al. Perfil Sensorial e teste de consumidor de biscoito recheado sabor chocolate. Boletim do Centro de Pesquisa de Processamento de Alimentos, 19(2):277-300, 2001.
RICHTER, V. B. et al. Proposing a ranking descriptive sensory method. Food Quality and Preference, 2 (6):611-620. 2010.
VARELA, P.; ARES, G. Sensory profiling, the blurred line between sensory and consumer science. A review of novel methods for product
characterization. Food Research International,
VERONEZI, C. M.; JORGE, N. Carotenóides em Abóboras. Boletim do Centro de Pesquisa de Processamento de Alimentos, 29(1):10-20, 2011.
VILLEMEJANE, C. et al. Technological and sensory tools to characterize the consistency and performance of fibre-enriched biscuit doughs. Journal of Cereal Science, 57(3):551-559, 2013.
VIT, P.; DELIZA, R.; PÉREZ, A. How a Huottuja (Piaroa) community perceives genuine and false
honey from the Venezuelan Amazon, by free-choice profile sensory method. Revista Brasileira de Farmacognosia, 21(5):786-792, 2011.
ZENEBON, O.; PASCUET, N. S.; TIGLEA, P. Normas Analíticas do Instituto Adolfo Lutz: Métodos Físico-químicos para Análise de Alimentos. São Paulo: Instituto Adolfo Lutz, 2008.