eISSN: 2237-2083
DOI: 10.17851/2237-2083.27.4.1591-1612
Kappa statistic for judgment agreement in Sociolinguistics
Estatística Kappa para concordância de julgamento
em Sociolinguística
Raquel Meister Ko. Freitag
Universidade Federal de Sergipe (UFS), São Cristóvão, Sergipe, Brazil rkofreitag@uol.com.br
Abstract: Perception studies have required the development of new techniques, as well as new ways of analyzing data. This paper discusses the proposal of Kappa statistic for the measurement of agreement amongst judgments in perception tests. The analysis deals with data obtained from a subjective reaction test focusing on the variable pronunciation of /t, d/ as stops or affricates in Aracaju, Sergipe, Brazil, considering aesthetic, rhythmic, and dialectal factors. Kappa statistic shows aspects of the inter-rater agreement and reliability that can explain how the linguistic change is driven in the community. This type of analysis also allows to account for, in a perception study, the sex/gender bias observed in production. Results suggest that Kappa-statistics is a tool that can improve the explanatory power of perceptual studies in Sociolinguistics.
Keywords: Sociolinguistic perception; statistic tools; inter-rater agreement; /t,d/ palatalization.
Resumo: Estudos de percepção têm demandado o desenvolvimento de novas técnicas, assim como novas formas de analisar os dados obtidos. Este texto discute a proposta do teste Kappa para a aferição da força de convergência de julgamentos em testes de percepção. A análise é realizada com dados obtidos em um teste de reação subjetiva quanto à realização variável de /t,d/ em Aracaju, Brasil, considerando fatores estéticos, rítmicos e dialetais. A estatística Kappa mostra aspectos da concordância e da confiabilidade entre os avaliadores que podem ser usados para explicar como a mudança linguística se dá na comunidade. A análise também permite identificar em um estudo da percepção o viés de sexo/gênero observado nos estudos de produção. Os resultados mostram que a estatística Kappa é uma ferramenta que pode ampliar o poder explanatório dos estudos de percepção em Sociolinguística.
Palavras-Chave: Percepção sociolinguística; ferramentas estatísticas; concordância de juízes; palatalização de /t,d/.
Submitted on January 31, 2019 Accepted on June 14th, 2019
Introduction
Since the earliest work in sociolinguistics, studies of linguistic production have paid attention to methods of data collection and analysis. To overcome the observer’s paradox (LABOV, 1972), in which the act of observation itself works against obtaining the most casual speech styles, strategies were developed to gather linguistic data during observation. The large samples of production data constituted through sociolinguistic interviews have led to the development of appropriate mathematical models for quantitative analysis. For example, the study of variation of post-vocalic /r/ in department stores in New York City was initially explored through percentages (LABOV, 1972, 2006) and afterwards through logistic regression (PAOLILLO, 2002) and decision trees (EDDINGTON, 2010; TAGLIAMONTE; BAAYEN, 2012). Each approach has contributed to methods of quantitative analysis currently used in the study of production data.
However, although subjective reaction tests have been conducted since the early studies of sociolinguistics (SHUY, 1969), the same consideration has not been given to methods of quantitative analysis in the study of perception: there is little agreement about the most appropriate statistical method and studies commonly use percentages, as they did in the earliest production studies.
This paper proposes a new quantitative approach to the analysis of data collected in perception studies in sociolinguistics. Its goals are: 1) to explore the concepts of reliability and agreement in judgment tests (as in subjective reaction test, for example), considering inherent inter- and intra-rater variance; 2) to present Kappa as a statistical technique to quantify variability in judgment tests; and 3) to reanalyze a previous dataset using the Kappa statistic.
Quantitative approach to perceptual studies in Sociolinguistics
Perception studies in sociolinguistics try to answer questions about the social meaning of variants and the role of speakers in linguistic change, usually in order to inferred a certain change direction from the data. When participants answer questions as “Does this person sound “ugly” or “beautiful”?” or “Does this person sound “quick” or “slow”?”, answers are not necessarily consensual: if all participants answer “quick”, or “ugly”, there is consensus, and some type of change may be regarded as complete, at least at the level of awareness. However, in processes of inceptive change, variability in answers is expected, and identifying the extent of agreement in answers provided by the participants can help to interpret the direction of change. The extent of agreement also enables identification of sex/gender, dialectal, educational, or other social or cultural biases that drive variant choices. For example, women (or educated or urban participants) may attribute more positive values to one variant than men (or non-educated or rural people).
One technique to account for the extent of agreement is measuring the percentage of judgments, which is easy to calculate and interpret. However, percentages do not take into account differences in agreement that may result from random variability or chance. Studies of patterns of judgment in other fields such as psychology, education and medicine have adopted a more robust measurement, the Kappa statistic, a metric of inter-rater agreement that takes into account the effect of random variability. In this paper, I propose adopting this method for perception studies in sociolinguistics. I will begin by considering the concepts of reliability and agreement in psychometrics before detailing the Kappa statistic and its application to perceptual studies in sociolinguistics.
Reliability and agreement
Measurements of agreement among listener judgments need to consider inter- and intra-rater patterns, which relate to the concepts of
reliability and agreement. Reliability concerns the relative consistency
of measurements, be it a test or a scale. Reliability differs from agreement, which concerns the convergence of ratings, that is, consensus in responses. In other words, reliability refers to consistency of judgement, while agreement is about consensus among judges.
This approach considers intra-rater reliability(the consistency of ratings by the same rater at different times) and inter-rater reliability (the consensus of ratings by independent raters) (LEBRETON; SENTER, 2008). That is, the inter-rater agreement refers to the absolute consensus in scores provided by multiple judges for one or more targets, while intra-rater agreement refers to the absolute consensus in scores by a same rater at different times.
Measuring reliability and agreement in perception studies can help to outline the effects of demographic differences between groups of raters (inter-rater agreement), and raters’ consistency in their own ratings (intra-rater reliability). Kappa is a statistic measure that permits to show and test reliability among multiple raters for categorical data, a common situation in subjective reaction tests.
The Kappa statistic
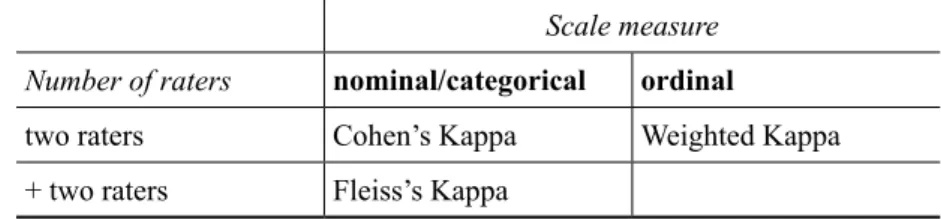
Kappa (κ) is a statistical coefficient that measures the degree of agreement and reliability between two raters who classify each subject in a rating scale. The Kappa coefficient was introduced by Cohen (1960), who considered only two raters and a nominal scale. A later version of Kappa (Fleiss’s Kappa), labeled a Kappa-like statistic or the Kappa statistic (POSNER et al., 1990), expanded the number of judges and the type of scale (centered-weighted Kappa). A weighted Kappa (FLEISS; COHEN, 1973) is a measurement of agreement in ordinal data (CHOUDHARY; NAGAJARA, 2017). Thus, the choice of Kappa test depends on the number of raters and whether the ratings are nominal or ordinal, as shown in Figure 1.
FIGURE 1 – Kappa-statistics application Scale measure Number of raters nominal/categorical ordinal
two raters Cohen’s Kappa Weighted Kappa
Based on Cohen (1960), the basic assumption of the Kappa statistic is the ratio of the difference between the expected Pr(e) and observed agreement Pr(a), as in (1).
(1)
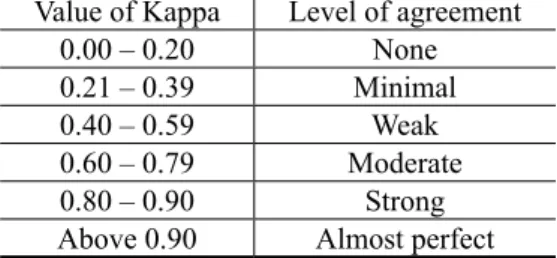
The Kappa coefficient ranges from -1 to +1, where 0 represents the amount of agreement expected from random chance, and 1 represents perfect agreement between raters (figure 2). If Kappa is negative, raters agree with one another less than it would be expected just by chance (which is particularly important in sociolinguistics, as seen below).
FIGURE 2 – Value of Kappa and its interpretation (LANDIS; KOCH, 1977, p. 165) Value of Kappa Level of agreement
0.00 – 0.20 None
0.21 – 0.39 Minimal
0.40 – 0.59 Weak
0.60 – 0.79 Moderate
0.80 – 0.90 Strong
Above 0.90 Almost perfect
Fleiss’s Kappa (FLEISS, 1971) provides a measure of agreement among three or more raters. The formula is the same as in (1), but in Fleiss’s Kappa, Pr(e) is the expected proportion of agreement if the ratings from one trial are independent of the others.
Some other aspects must be considered in adopting the Kappa statistic. First, the rating is measured on a nominal scale, with ordinal or nominal variables, and the response categories are mutually exclusive (that is, no categories overlap). Second, the rating is paired observations of the same phenomenon, which means that all raters assess the same observations. Finally, raters are independent, which means that one rater’s judgment does not affect the other raters’.
The Kappa statistic has several applications in research fields where judgment tasks are required. It is also used to measure agreement between classifications made by the same participants on different occasions, between classifications made by different observers, or
between classifications made with different methods. For example, Aman and Szpavowicz (2007) used Kappa to measure consensus between two pairwise judgments that consisted in identifying emotions in texts based on an appraisal framework, which includes attitudes, judgments, and emotions. The procedure consisted in comparing the results of one judge, the specialist who established a reference standard, against three other non-specialist participants, and calculating the mean of agreement with the reference standard in labeling emotion/non-emotion, emotion categories, and emotion intensities. In a famous study about the universality of facial expressions, Ekman et al. (1987) also adopted the Kappa statistic in a judgment test that consisted of the selection of one emotion term for each expression, in a set of three expressions per emotion (180 subjects) by 10 raters for each of the 10 cultures.
Carletta (1996, p. 253), who notes the interest of computational linguistics and cognitive science in subjective judgments, claims the Kappa statistic is a uniform measure of reliability:
Kappa is widely accepted in the field of content analysis. It is interpretable, allows different results to be compared, and suggests a set of diagnostics in cases where the reliability results are not good enough for the required purpose. We suggest that this measure be adopted more widely within our own research community (CARLETTA, 1996, p. 253).
For perceptual studies in sociolinguistics, reliability can be considered as the ratio of true score variance to total variance, and the Kappa statistic measures pairwise agreement among a set of raters making category judgments, correcting for expected chance agreement. Results may be affected by skewed distribution of categories and by the degree of disagreement among raters. The next section provides a hypothetical example of inter-rater agreement in the discrimination of sounds and how the Kappa statistic can address this question.
Explaining the Kappa-statistics
In the process of phonetic transcription, continuous sounds are usually segmented impressionistically. For example, segmenting /t/ and /d/ segmenting is relatively simple, but there are certain cases where the cutoff is subjective, particularly when there is a process of palatalization,
which produces a gradience of sounds (e.g. /t/ and /tʃ/ in Brazilian Portuguese (FREITAG; SOUZA, 2016).
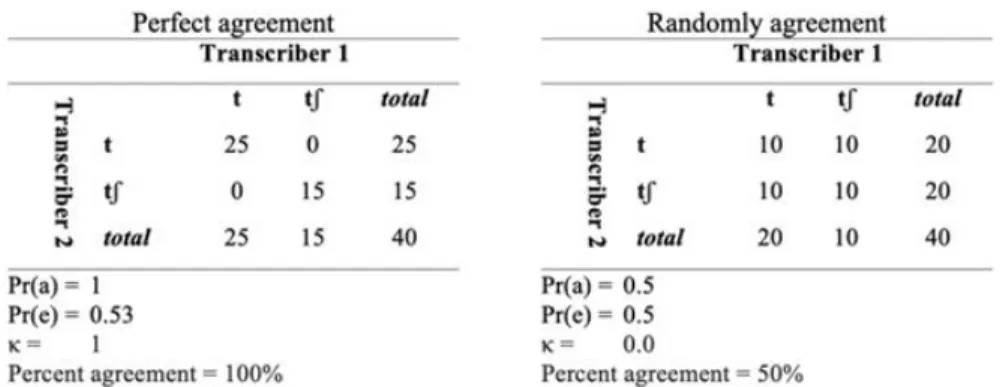
For example, suppose that two transcribers are given a set of 40 sounds that must be transcribed each as non-palatalized (/t/) or palatalized (/tʃ/). Since sounds are inherently grandient, there is no reference standard to judge the transcriptions as right or wrong. Rather, the goal is to identify agreement between transcribers. The results can then provide a reference standard for subsequent transcriptions. In the spreadsheets 1 and 2 in Figure 3, we have different transcribers’ decisions and the indication of whether there’s agreement between them or not.
FIGURE 3 –Spreadsheets of transcribers’ agreement
The ideal scenario is perfect agreement, in which transcribers 1 and 2 transcribe all 40 sounds the same way, as in Spreadsheet 1. Both
transcribers agree that 25 tokens in the dataset are alveolar stops and 15 are palatals, yielding a 63% rate of palatalization, and 100% agreement. However, this ideal scenario is unlikely. In Spreadsheet 2, the distribution of rates is equal (transcribers 1 and 2 transcribe half of the tokens into each category), but the transcribers agree in only 25% of the cases.
If the task were to select transcribers, there is no doubt that the transcribers in spreadsheet 1 would be better than the those in spreadsheet 2. In spreadsheet 2, we must identify the transcriber in disagreement, but we cannot do so based only based on the percentage of agreement: one more transcriber must be added, to compare their mean of agreement with the other ones and to decide which of the three transcribers is in disagreement. Identifying the disagreeing transcriber requires the Kappa statistic. First, we transform the data in the spreadsheets to an n x n contingency table, as shown in Figure 4:
FIGURE 4 –Layout of contingency table for Kappa statistics
Second, we calculate the expected agreement Pr(e) and observed agreement Pr(a). The observed agreement is calculated by dividing the sum of the frequencies in the main diagonal cells (a and d) by n, as in (2), and multiplying by 100 to find the percentage of agreement.
(2)
Pr(a) = (a + d)/n
The expected agreement is based on the assumption that transcription decisions are independent between transcribers. Therefore,
the frequency of chance agreement for a sound to be transcribed as /t/ or /tʃ/ is calculated by multiplying the marginal totals corresponding to each cell on the main diagonal, and dividing by n. The proportion of expected agreement is then calculated by summing across chance agreement in these cells and dividing by n, as in (3).
(3)
Pr(e) = [(f1*g1)/n +(g2*f2)/n)]/n
Finally, these results are input to Kappa’s formula, in (4):
(4)
κ = 1 – (1 – Pr(a))/(1- Pr(e))
In the example of spreadsheets 1 and 2, the sum of ratings is shown in Figure 5, where the Kappa coefficient points to two different scenarios: spreadsheet 1 shows perfect agreement, and spreadsheet 2 shows random agreement.
FIGURE 5 –Summarizing spreadsheets of agreement
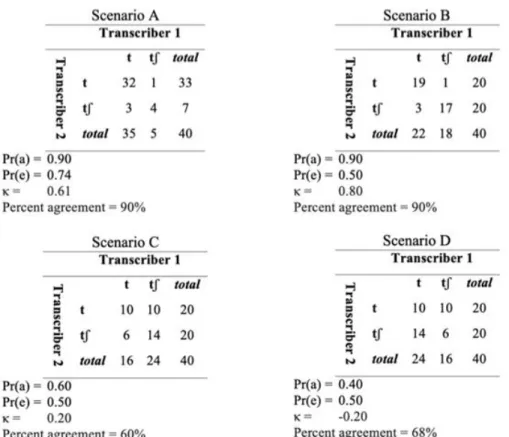
Obviously, perfect agreement has the highest Kappa coefficient (1.0) and random agreement the lowest (0.0). However, results are not always so obvious as these. Suppose two other scenarios, A and B, shown in Figure 6: both show 90% agreement, but the Kappa coefficients suggest that in scenario B the transcribers exhibit strong agreement (κ = 0.80), while in scenario A, they show moderate agreement (κ = 0.60). Comparing results in order to establish a reference standard for
impressionistic transcription of palatalization, scenario B is more reliable than scenario A.
Consider now two other scenarios, C and D. In scenario C, the percentage of agreement is 60% but κ = 0.20, suggesting low agreement. In scenario D, the percentage of agreement is 40% and κ = -0.20. McHugh (2012) warns that a Kappa coefficient of 0 indicates a serious problem in the data (in this case of transcription, if one transcriber is a specialist and the other is not, for example). A negative Kappa signals that agreement is worse than expected by chance. A large negative Kappa is considered very bad in clinical studies, the most common application of Kappa statistics. However, negative Kappa is particularly interesting for sociolinguistic perception studies as it provides evidence of inter-rater bias and intra-rater consistency.
Reanalyzing perceptual data with Kappa statistic
The remainder of this paper is devoted to using the Kappa statistic to re-analyze a dataset from another study, the perception of /t/ and /d/ as palatal or alveolar stops in Brazilian Portuguese spoken in Sergipe. Palatalization of /t/ and /d/ may be regressive, triggered by a following vowel /i/ (e.g. tia ‘aunt’, dia ‘day’), or progressive, triggered by a preceding glide /y/ (e.g. oito ‘eight’, peito ‘chest’).
In regressive contexts, urban dialects in most of Brazil palatalize /t/ and /d/. In some dialects, the alveolar stop is more common, especially among certain social groups. For example, in southern Brazil, alveolar stops are characteristic of descendants of Italian immigrants (BATTISTI
et al., 2007; BATTISTI; DORNELLES FILHO, 2015), and border
areas with Spanish-speaking countries such as Argentina and Uruguay (CARVALHO, 2004; CASTAÑEDA, 2016), or the descendants of immigrants in general (BISOL, 1991). In southeastern Brazil, alveolar stops are interpreted as ‘caipira’, a term used to refer to people from country-side São Paulo, or as ‘nordestino’, which refers to people who have immigrated to São Paulo from northeastern Brazil (OUSHIRO, 2017). In both cases, the value associated with the alveolar stop realization is negative. On the other hand, progressive palatalization is less common and highly stigmatized, restricted to certain dialect areas like the countryside of Sergipe (MOTA, 2008, FREITAG, 2015). Production studies in Sergipe have indicated a change in progress (SOUZA NETO, 2008; SOUZA, 2016; CORREA, 2019; FREITAG; SOUZA NETO; CORRÊA, 2019), but these studies do not investigate the social forces driving this process nor how the innovative variant is evaluated by the community.
Perceptions of /t,d/ variation by undergraduate students in Sergipe have been presented in Freitag and Santos (2016), an exploratory study that considered only percentages of responses. The stimuli consisted of a verbal guise based on samples collected in sociolinguistic interviews from the Falares Sergipanos database (FREITAG, 2013), in near-minimal pairs of isolated words that did not undergo phonetic manipulation (LADEGAARD, 2000; DAILEY; GILES; JANSMA, 2005). Judges listened to the stimuli and responded to a series of questions regarding aesthetic, rhythmic, and regional evaluations about speech (cf. CARDOSO, 2015): “Does this person sound “ugly” or
“beautiful”?”, “Does this person sound “quick” or “slow”?” Responses were binary, consisting of opposing values such as “ugly”/“beautiful” or “quick”/“slow”. The raters were 36 volunteer (18 male and 18 female) undergraduates from the Federal University of Sergipe, who were born and lived in Aracaju, the capital of Sergipe. The rating task was run in PsychoPy v.1.82.01 (PEIRCE, 2007).
The sample of judges is relatively homogeneous: undergraduates of roughly the same age and level of education, who only differed by sex. To expand the analysis beyond percentages, we measured intra- and inter-rater agreement in light of the following questions: Do the observed percentages of ratings match the expected agreement? Do the observed agreement and the percentage of ratings converge? Does the sex of the speaker affect their perceptions?
With 36 raters independently rating all stimuli on a categorical scale, Fleiss’s Kappa is the most appropriate measure. Ratings were arranged in a 3-way table matrix, one for each rated feature. The observed and expected frequencies were calculated for Fleiss’s Kappa, using the kappam.fleiss function (GAMER et al., 2012) in the R irr package (R CORE TEAM, 2018).
The results are presented in two parts: first, the global results for the sample, comparing the palatal and alveolar stop realizations of /t,d/ in regressive and progressive contexts, and second, the distribution considering sex/gender stratification.
The dialectal distribution and the level of consciousness and stylistic monitoring of the variants recall Labov’s (1972) distinction between indicators, markers, and stereotypes. Indicators have no salient variants, with few social or geographic information. Markers and stereotypes carry social, geographic and indexical information, and have a degree of consciousness to emerge within those categories in stylistic variation; while stereotypes are subject to metapragmatic discussion, markers are not.
While regressive palatalization is a sociolinguistic indicator in most of Brazil, previous production studies suggest that in Sergipe this variant is a positive stereotype, since it is evaluated positively and conforms to patterns in the rest of the country, locally viewed as “outside of Sergipe”. The rate of /t,d/ palatalization is 12% (SOUZA NETO, 2008; SOUZA, 2016); it is an ongoing change in the community, led by women and by more educated younger, urban people. However, progressive /t,d/
palatalization is considered ‘ugly’, characteristic of “nordestinos” and people from the countryside. Previous production studies found a rate of 12%, with a decreasing change in the community, characteristic of older, less-educated, non-urban male speakers. These findings suggest that progressive palatalization is negatively stereotyped in the community, which should affect patterns of subjective reaction.
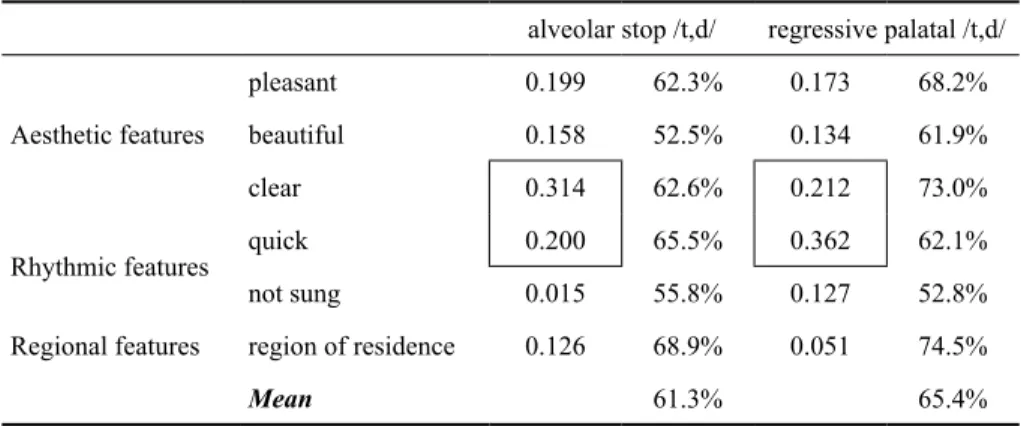
Table 1 presents the results of listener reactions to regressive palatalization (11 subjects, 36 raters, and 396 observations). The mean percentage of agreement for the alveolar stop realization is 61.3% (sd = 0.06), and 65.5% for the palatal realization in all features rated; the range between the global means of the innovative (palatal) and conservative (alveolar stop) realization of /t,d/ in this context is 4.1, which is quasi-chance. The Kappa coefficient shows that in this pairwise comparison, the aesthetic feature “beautiful” and the rhythmic feature “quick” present minimal agreement. In other contexts, there is no agreement. The Kappa statistics confirm that regressive palatalization is not stigmatized, since the judges’ agreement is close to chance, which means that listeners do not care if /t,d/ are palatals or alveolar stops in regressive contexts (i.e. it is below the level of consciousness). Furthermore, all Kappa coefficients for regressive contexts are statistically significantly different from zero (p < 0.05).
TABLE 1 – Percentage of agreement and Kappa coefficient for ratings of regressive palatalization
alveolar stop /t,d/ regressive palatal /t,d/
Aesthetic features
pleasant 0.199 62.3% 0.173 68.2%
beautiful 0.158 52.5% 0.134 61.9%
clear 0.314 62.6% 0.212 73.0%
Rhythmic features quick 0.200 65.5% 0.362 62.1%
not sung 0.015 55.8% 0.127 52.8%
Regional features region of residence 0.126 68.9% 0.051 74.5%
Mean 61.3% 65.4%
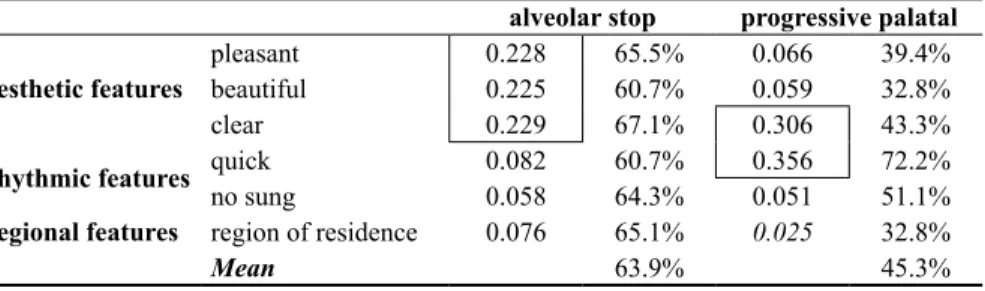
Table 2 presents the results for listener reactions to progressive palatalization (7 subjects, 36 raters, 352 observations for alveolar stops;
5 subjects, 36 raters, 180 observations for palatals). The range in global mean is 18.1, with 63.9% (sd = 0.02) for alveolar stop realizations and 45.3% (sd= 0.14) for palatal realizations, which indicates that the negative stereotype is perceived by the judges.
TABLE 2 – Percentage of agreement and Kappa coefficient for ratings of progressive palatalization
alveolar stop progressive palatal Aesthetic features pleasantbeautiful 0.2280.225 65.5%60.7% 0.0660.059 39.4%32.8%
clear 0.229 67.1% 0.306 43.3%
Rhythmic features quickno sung 0.0820.058 60.7%64.3% 0.3560.051 72.2%51.1% Regional features region of residence 0.076 65.1% 0.025 32.8%
Mean 63.9% 45.3%
(italics means p > 0.05)
The Kappa coefficient shows that, in this pairwise comparison, the aesthetic feature “beautiful” and the rhythmic feature “quick” present minimal agreement for palatal realization. For alveolar stop realizations, the rhythmic feature “quick” also presents minimal agreement, as do the aesthetic features “pleasant” and “beautiful”.
In all other features in both contexts (progressive and regressive), the Kappa coefficient points to 0, which indicates that agreement is not better than chance. Negative values indicate that agreement is worse than chance (0.5, or fifty-fifty). From a sociolinguistic perspective, these results suggest that there is no consensus in the community for these processes of variation.
Despite high percentages of agreement, the Kappa coefficients are at or close to 0, suggesting that positive or negative values of the variants are not picked up on by the raters, or that the raters in the sample are more heterogeneous than assumed.
Tables 3 and 4 separate the results by linguistic context (regressive and progressive) and by sex (the number of raters in each table is half of those in Tables 1 and 2).
TABLE 3 – Percentage of agreement and Kappa coefficient for regressive context ratings and sex/gender raters
alveolar stop regressive palatal
men women men women
Aesthetic features pleasant 0.086 58.1% 0.307 61.8% 0.120 61.1% 0.209 74.2% beautiful 0.106 50.5% 0.212 54.5% 0.071 55.6% 0.202 68.2% clear 0.283 64.2% 0.314 61.1% 0.189 71.7% 0.237 74.2% Rhythmic features quick 0.176 66.2% 0.219 65.5% 0.392 67.7% 0.316 56.6% not sung 0.003 63.6% 0.008 48.0% 0.149 61.1% 0.148 44.4% Regional
features region of residence 0.126 66.7% 0.142 52.5% 0.040 77.8% 0050 71.2%
Mean
(italics means p > 0.05)
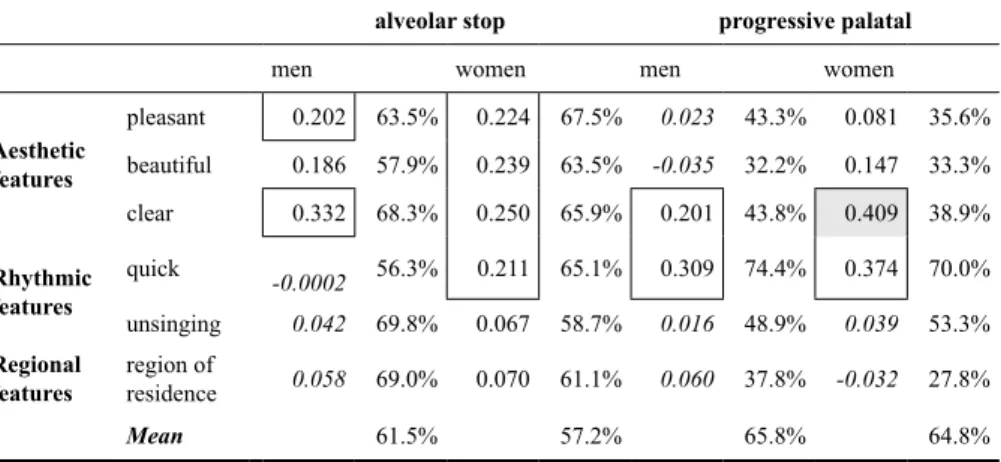
TABLE 4 – Percentage of agreement and Kappa coefficient for regressive context ratings and sex/gender raters
alveolar stop progressive palatal
men women men women
Aesthetic features pleasant 0.202 63.5% 0.224 67.5% 0.023 43.3% 0.081 35.6% beautiful 0.186 57.9% 0.239 63.5% -0.035 32.2% 0.147 33.3% clear 0.332 68.3% 0.250 65.9% 0.201 43.8% 0.409 38.9% Rhythmic features quick -0.0002 56.3% 0.211 65.1% 0.309 74.4% 0.374 70.0% unsinging 0.042 69.8% 0.067 58.7% 0.016 48.9% 0.039 53.3% Regional
features region of residence 0.058 69.0% 0.070 61.1% 0.060 37.8% -0.032 27.8%
Mean 61.5% 57.2% 65.8% 64.8%
(italics means p > 0.05)
In regressive contexts, the mean of the range between alveolar stop and palatal /t,d/ for female judges (7.6) is higher than that for male judges (4.3). Female judges present more features with minimal agreement (all the aesthetic features and the rhythmic feature “quick”, for both realizations). Male judges present minimal agreement only in the aesthetic feature “clear”, for alveolar realizations, and in the rhythmic feature “quick”, for palatal realizations.
In progressive contexts, again, the mean range for female judges (20.5) is higher than that for male judges (17.4).
In this context, the variants are very different in social value: while the alveolar stop is the unmarked realization (neutral), the palatal is a negative stereotype. It is in this realization that the Kappa coefficients for men and women converge in the limit between minimal and weak agreement for the aesthetic feature “clear” and the rhythmic feature “quick”. For the alveolar variant in progressive contexts, female raters present the same pattern shown in regressive context, but the same cannot be said about male raters.
When raters are separated, we get negative Kappa coefficients (despite not being significant; italic values in tables are p > 0.05). According to Landis and Koch (1977), a small negative Kappa coefficient should be interpreted as indicative of no agreement.
No agreement seems to be the conclusion for these findings. The range of inter-rater agreement (<0 – 0.40) reaches the beginning of weak agreement. The range between the contexts varies, which allows us to formulate hypotheses about the relationship between the size and the homogeneity of the sample: Do fewer raters yield a higher range? Does the same group yield a higher range? These questions address the sample size effect: how many raters must there be in a sociolinguistic perception study? Following LeBreton and Senter (2008), calculating inter-rater agreement or reliability requires a sample with 10 judges. However, it is not clear whether a sample of 10 is sufficient for sociolinguistic studies (FREITAG, 2018).
Could the direction and strength of (dis)agreement indicate directions of variation? If there is ongoing linguistic change in the community, the pattern in judgments should be in agreement, but that does not always happen.
The Kappa statistic is then a useful tool for perception studies in measuring (non-) agreement among raters, and can be used in combination with other statistic tools to gauge reliability of ratings.
Conclusion
In sociolinguistic perception studies, simple percentages are insufficient to account for variability in judgments between and within raters. The Kappa statistic provides a technique to measure this variability,
based on the assumption that inter-rater agreement reflects the degree to which different raters are interchangeable. The Kappa statistic is not without limitations: it may prove inconsistent if there is strong agreement between raters, since the coefficient assumes lower values than would have been expected (BLOCK; KRAEMER, 1989; FALOTICO; QUATTO, 2015). Furthermore, since Agresti (1989, p. 273) warns that different patterns of agreement can have the same Kappa value, the Kappa coefficient on its own may not account for agreement. The Kappa coefficient is not a measure of reproducibility, but rather of predictive association (DE MAST, 2007) that can be applied in combination with others tests of association, such as Principal Components Analysis (PCA) (WOLD; ESBENSEN; GELADI, 1987). PCA aims at maximizing the amount of variance in the original data in a dataset with fewer variables, each of which is a linear combination of the original variables. If all the raters strongly agree with each other, their ratings should all weigh heavily on a single factor. Thus, despite the minimum agreement expected, the Kappa statistic can be used combined with other statistic tools in order to provide greater reliability of ratings.
Kappa results can be visualized in an agreement chart, which provides a visual representation for comparing the concordance in paired categorical data, like Bangdiwala’s agreement chart (BANGDIWALA; SHANKAR, 2013), or the Receiver Operating Characteristic (ROC) curve, a powerful tool for measuring raters’ accuracy in binary ratings. In contrast with Kappa, which is a scalar coefficient, ROC is a two-dimensional graph that requires additional transformations (BEN-DAVID, 2008). Thus, the Kappa statistic, when combined with other statistical tools, can contribute to improving the explanatory power of subjective reaction tests in sociolinguistic studies.
Acknowledgments
I wish to thank Julian Tejada and Livia Oushiro for their suggestion in an early version of this paper; to Marta Farias, for language support; to FAPITEC (PRAPEC 3/2017) for grants to attend the NWAV46 Conference in 2017, and to CNPq for a research fellowship.
References
AGRESTI, Alan. An agreement model with Kappa as parameter. Statistics
& Probability Letters, [S.l.], v. 7, n. 4, p. 271-273, 1989. Doi: https://doi.
org/10.1016/0167-7152(89)90104-1
AMAN, Saima; SZPAKOWICZ, Stan. Identifying expressions of emotion in text. In: International Conference on Text, Speech and
Dialogue. Springer, Berlin, Heidelberg, 2007. p. 196-205. Doi: https://
doi.org/10.1007/978-3-540-74628-7_27
BANGDIWALA, Shrikant I.; SHANKAR, Viswanathan. The agreement chart. BMC Medical Research Methodology, v. 13, n. 1, p. 97, 2013. Doi: https://doi.org/10.1186/1471-2288-13-97
BATTISTI, Elisa et al. Palatalização das oclusivas alveolares e a rede social dos informantes. Revista Virtual de Estudos da Linguagem, v. 5, n. 9, p. 1-29, 2007.
BATTISTI, Elisa; DORNELLES FILHO, Adalberto Ayjara. Análise em tempo real da palatalização de/t/e/d/no português falado em uma comunidade ítalo-brasileira. Revista da ABRALIN, v. 14, n. 1, 2015. Doi: https://doi.org/10.5380/rabl.v14i1.42492
BEN-DAVID, Arie. About the relationship between ROC curves and Cohen’s kappa. Engineering Applications of Artificial Intelligence, v. 21, n. 6, p. 874-882, 2008. Doi: https://doi.org/10.1016/j.engappai.2007.09.009 BISOL, Leda. Palatalization and its variable restriction. International
Journal of the Sociology of Language, v. 89, n. 1, p. 107-124, 1991. Doi:
https://doi.org/10.1515/ijsl.1991.89.107
BLOCH, Daniel A.; KRAEMER, Helena Chmura. 2 x 2 kappa coefficients: measures of agreement or association. Biometrics, p. 269-287, 1989. Doi: https://doi.org/10.2307/2532052
CARDOSO, Denise Porto. Atitudes linguísticas e avaliações subjetivas
de alguns dialetos brasileiros. São Paulo: Blucher, 2015. Doi: https://doi.
org/10.5151/BlucherOA-atitudeslinguisticas
CARLETTA, Jean. Assessing agreement on classification tasks: the kappa statistic. Computational Linguistics, v. 22, n. 2, p. 249-254, 1996.
CARVALHO, Ana Maria. I Speak Like the Guys on TV: Palatalization and the Urbanization of Uruguayan Portuguese. Language Variation
and Change, v. 16, n. 2, p. 127-151, 2004. Doi: https://doi.org/10.1017/
S0954394504162030
CASTAÑEDA, Rosa-Maria. The Sociolinguistic Evolution of a Sound Change. Journal of Portuguese Linguistics, v. 15, 2016. Doi: https://doi. org/10.5334/jpl.3
CHOUDHARY, Pankaj K.; NAGARAJA, Haikady N. Measuring
Agreement: Models, Methods, and Applications. John Wiley & Sons,
2017. Doi: https://doi.org/10.1002/9781118553282
COHEN, Jacob. A coefficient of agreement for nominal scales.
Educational and Psychological Measurement, v. 20, n. 1, p. 37-46, 1960.
Doi: https://doi.org/10.1177/001316446002000104
CORRÊA, Thais Regina Andrade. A variação na realização de /t/ e /d/
na comunidade de práticas da UFS: mobilidade e integração. 2019.
Dissertação (Mestrado em Letras) – Universidade Federal de Sergipe, Aracaju, 2019.
DAILEY, René M.; GILES, Howard; JANSMA, Laura L. Language Attitudes in an Anglo-Hispanic Context: The Role of the Linguistic Landscape. Language & Communication, v. 25, n. 1, p. 27-38, 2005. Doi: https://doi.org/10.1016/j.langcom.2004.04.004
DE MAST, Jeroen. Agreement and kappa-type indices. The
American Statistician, v. 61, n. 2, p. 148-153, 2007. Doi: https://doi.
org/10.1198/000313007X192392
EDDINGTON, David. A comparison of two tools for analyzing linguistic data: logistic regression and decision trees. Italian Journal of Linguistics, v. 22, n. 2, p. 265-286, 2010.
EKMAN, Paul et al. Universals and cultural differences in the judgments of facial expressions of emotion. Journal of Personality and Social
Psychology, v. 53, n. 4, p. 712, 1987. Doi:
https://doi.org/10.1037//0022-3514.53.4.712
FALOTICO, Rosa; QUATTO, Piero. Fleiss’ kappa statistic without paradoxes. Quality & Quantity, v. 49, n. 2, p. 463-470, 2015. Doi: https:// doi.org/10.1007/s11135-014-0003-1
FLEISS, Joseph L. Measuring nominal scale agreement among many raters. Psychological Bulletin, v. 76, n. 5, p. 378, 1971. Doi: https://doi. org/10.1037/h0031619
FLEISS, Joseph L.; COHEN, Jacob. The equivalence of weighted kappa and the intraclass correlation coefficient as measures of reliability.
Educational and Psychological Measurement, v. 33, n. 3, p. 613-619,
1973. Doi: https://doi.org/10.1177/001316447303300309
FREITAG, Raquel Meister Ko. Banco de dados falares sergipanos.
Working Papers em Linguística, v. 14, n. 2, p. 156-164, 2013. Doi: https://
doi.org/10.5007/1984-8420.2013v14n2p156
FREITAG, Raquel Meister Ko. Socio-stylistic aspects of linguistic variation: schooling and monitoring effects. Acta Scientiarum. Language
and Culture, Aracaju, v. 37, n. 2, p. 127-136, 2015. Doi: https://doi.
org/10.4025/actascilangcult.v37i2.24240
FREITAG, Raquel Meister Ko. Amostras sociolinguísticas: probabilísticas ou por conveniência?. Revista de Estudos da Linguagem, Belo Horizonte, v. 26, n. 2, p. 667-686, 2018. Doi: https://doi.org/10.17851/2237-2083.26.2.667-686
FREITAG, Raquel Meister Ko; SANTOS, Adelmileise de Oliveira. Percepção e atitudes linguísticas em relação às africadas pós-alveolares em Sergipe. In: LOPES, Norma Silva; ARAUJO, Silvana Silva Farias; FREITAG, Raquel Meister Ko. (org.). A fala nordestina: entre a sociolinguística e a dialetologia. São Paulo: Blucher, 2016. p. 109-122. Doi: https://doi.org/10.5151/9788580392173-06
FREITAG, Raquel Meister Ko; SOUZA, Gládisson Garcia Aragão. O caráter gradiente vs. discreto na palatalização de oclusivas em Sergipe.
Tabuleiro de Letras, v. 10, n. 2, p. 78-89, 2016.
FREITAG, Raquel Meister Ko.; SOUZA NETO, Antônio Félix; CORRÊA, Thais Regina Andrade. Palatalização em Sergipe. In: LOPES, Norma Silva; SANTANA, Elisângela; CARVALHO, Cristina (org.).
Língua e Sociedade, diferentes perspectivas, fim comum. São Paulo:
Blucher, 2019. p. 63-80.
GAMER, Matthias et al. Package ‘irr’. Various coefficients of interrater reliability and agreement, 2012.
LABOV, William. Sociolinguistic Patterns. Pennsylvania: University of Pennsylvania Press, 1972.
LABOV, William. The Social Stratification of English in New York
City. Cambridge: Cambridge University Press, 2006. Doi: https://doi.
org/10.1017/CBO9780511618208
LADEGAARD, Hans J. Language attitudes and sociolinguistic behaviour: Exploring attitude-behaviour relations in language. Journal
of Sociolinguistics, v. 4, n. 2, p. 214-233, 2000. Doi: https://doi.
org/10.1111/1467-9481.00112
LANDIS, J. Richard; KOCH, Gary G. The measurement of observer agreement for categorical data. Biometrics, p. 159-174, 1977. Doi: https:// doi.org/10.2307/2529310
LeBRETON, James M.; SENTER, Jenell L. Answers to 20 questions about interrater reliability and interrater agreement. Organizational
Research Methods, v. 11, n. 4, p. 815-852, 2008. Doi: https://doi.
org/10.1177/1094428106296642
McHUGH, Mary L. Interrater reliability: the kappa statistic. Biochemia
Medica: Biochemia Medica, v. 22, n. 3, p. 276-282, 2012. Doi: https://
doi.org/10.11613/BM.2012.031
MOTA, Jacyra Andrade. Como fala o nordestino: a variação fônica nos dados do Projeto Atlas Lingüístico do Brasil. In: LIMA-HERNANDES, MC et al. (org.). A língua portuguesa no mundo. São Paulo: FFLCH-USP, 2008.
OUSHIRO, Livia. Salience and Covariation in Second Dialect
Acquisition: Northeastern Migrants in São Paulo. In: NEW WAYS
OF ANALYZING VARIATION, 46, 2017, Washington. Washington: Linguistic Society of America, 2017. Paper presented.
PAOLILLO, John C. Analyzing Linguistic Variation: Statistical Models and Methods. Chicago: Center for the Study of Language and Information, 2002.
PEIRCE, Jonathan W. PsychoPy–Psychophysics Software in Python.
Journal of Neuroscience Methods, v. 162, n. 1-2, p. 8-13, 2007. Doi:
POSNER, Karen L. et al. Measuring interrater reliability among multiple raters: an example of methods for nominal data. Statistics in Medicine, v. 9, n. 9, p. 1103-1115, 1990. Doi: https://doi.org/10.1002/sim.4780090917 R CORE TEAM. R: A language and environment for statistical
computing. 2018.
SHUY, Roger W. Subjective Judgments in Sociolinguistic Analysis. Paper presented at the 20th Annual Round Table Meeting on Linguistics and Language Studies, Georgetown University, Washington, D.C., 1969. Disponível em: https://eric.ed.gov/?id=ED027523. Acesso em: 25 jan. 2019.
SOUZA, Gládisson Garcia Aragão et al. Palatalização de oclusivas
alveolares em Sergipe. 2016. Dissertação (Mestrado em Letras) –
Universidade Federal de Sergipe, Alagoas, 2016.
SOUZA NETO, Antônio Félix de. Realizações dos fonemas/t/e/d/em
Aracaju Sergipe. 2008. Dissertação (Mestrado em Letras) – Universidade
Federal de Alagoas, Maceió, 2008.
TAGLIAMONTE, Sali A.; BAAYEN, R. Harald. Models, Forests, and Trees of York English: Was/Were Variation as a Case Study for Statistical Practice. Language Variation and Change, v. 24, n. 2, p. 135-178, 2012. Doi: https://doi.org/10.1017/S0954394512000129
WOLD, Svante; ESBENSEN, Kim; GELADI, Paul. Principal Component Analysis. Chemometrics and Intelligent Laboratory Systems, v. 2, n. 1-3, p. 37-52, 1987. Doi: https://doi.org/10.1016/0169-7439(87)80084-9