INSTITUTO SUPERIOR DE ECONOMIA E GESTAO
DOUTORAMENTO EM: GESTAO
Market Structure, Competition and Efficiency in
Brazilian Banking: 2002-2011
Mark Edward Wolters
Orienta9ao: Professor Doutor Eduardo Barbosa do Couto
Composi9ao do
JUri:
Presidente: Reitor da Universidade Tecnica de Lisboa
Doutor Joaquim Ramos Silva, Professor Associado no Institute Superior de Economia e Gestao;
Doutor Eduardo Barbosa do Couto, Professor Auxiliar no Institute Superior de Economia e Gestao;
Doutor Jose Manuel Dias Lopes, Professor Coordenador no Institute Superior de Gestao Bancaria;
Doutor Anibal Jorge da Costa Crist6vao Caiado, Professor Adjunto no Escola Superior de Ciencias Empresariais do Institute Politecnico de Serubal
Doutor Joao Eduardo Dias Fernandes, na qualidade de especialista na area
INSTITUTO SUPERIOR DE ECONOMIA E GESTAO
DOUTORAMENTO EM: GESTAO
Market Structure, Competition and Efficiency in
Brazilian Banking: 2002-2011
Mark Edward Wolters
Orienta9ao: Professor Doutor Eduardo Barbosa do Couto
Composi<;ao do
JUri:
Presidente: Reitor da Universidade Tecnica de Lisboa
Doutor Joaquim Ramos Silva, Professor Associado no Instituto Superior de Economia e Gestao;
Doutor Eduardo Barbosa do Couto, Professor Auxiliar no Instituto Superior de Economia e Gestao;
Doutor Jose Manuel Dias Lopes, Professor Coordenador no Instituto Superior de Gestao Bancaria;
Doutor Anibal Jorge da Costa Crist6vao· Caiado, Professor Adjunto no Escola Superior de Ciencias Empresariais do Instituto Politecnico de Serubal
Doutor Joao Eduardo Dias Fernandes, na qualidade de especialista na area
Abstract
The past two decades have seen dramatic changes in the Brazilian banking sector. Deregulations in the 1990's and financial pressures in the 2000's have led to a more concentrated banking sector, though not overly concentrated. The Panzar Rosse model finds that Brazil was in monopolistic competition for the 2002-2011 period, and that the financial crisis of the late 2000's had a negative effect on competition.
Using Data Envelopment Analysis we find that over the 2002-2011 period Brazilian banks have become slightly less efficient, and that public banks are the most efficient while foreign banks are the least efficient. The larger banks are also more efficient than their smaller counterparts. The financial crisis also had a negative impact on efficiency with all ownership types and bank sizes losing efficiency, but less of a loss for larger banks. In terms of efficiency bigger is better in the Brazilian banking sector. Finally, due to multiple factors we find that the Brazilian banking sector is not participating in the "Quiet Life" scenario of concentrated markets.
Resumo
As duas ultimas decadas viram mudanyas dramaticas no setor bancario brasileiro. Desregulamentayao na decada de 1990 e as pressoes financeiras nos anos 2000 levaram a urn setor bancario mais concentrado, embora nao excessivamente concentrado. Utilizando o modelo de Panzar Rosse conclui-se que o Brasil estava em concorrencia monopolistica para o periodo 2002-2011, e que a crise financeira do final dos anos 2000 teve urn efeito negative sobre a concorrencia.
Utilizando Data Envelopment Analysis descobrimos que ao Iongo do periodo 2002-20 11 os bancos brasileiros se tomaram urn pouco menos eficientes, e que os bancos publicos sao os mais eficientes, enquanto os bancos estrangeiros sao os menos eficientes. Os maiores bancos tam bern sao mais eficientes do que suas contrapartes de men or dimensao. A crise financeira tambem teve urn impacto negativo na eficiencia com todos bancos a perder a eficiencia independentemente do tamanhos e tipo de propriedade, apesar das perdas serem de menor dimensao para os bancos maiores. Em termos de eficiencia quanto maior, melhor no setor bancario brasileiro. Finalmente, devido a multiplos fatores puramos que o setor bancario brasileiro nao esta a aderir ao cenano "Quiet Life" de mercados concentrados.
Table of Contents
Coordinator of the PhD and Jury Members
Abstract and Resumo
Table of Contents
Abbreviations Index
Figures, Tables and Charts Index
1. Introduction
1.1 The Purpose of the Thesis and Main Research Questions
1.2 Introduction and Brief Summary of the Results
1.3 Structure of the Thesis
2. Literature Review
2.1 Overview ofthe Literature
2.2 Historical Financial Background ofthe Market Structure and
Functioning of the Brazilian Banking Sector
2.2.1 A Historical Perspective on the Brazilian Banking Sector
2.2.2 The Real Plan
2.2.3 PROES- Program of Incentives to the Reduction of the
State-Level Public Sector in Bank Activity
2.2.4 PROER- Program of Incentives to the Restructuring
and Strengthening of the National Financial System
2.2.5 Foreign Bank Participation in Brazil
2.2.6 Economic Indicators
2.2.7 Central Bank Reserve Requirements
2.2.8 Financial Innovation
Page2
Page3
Page4
Page 11
Page 13
Page 16
Page 16
2.2.8.1 Financial Innovation in Brazil
2.2.9 The Financial Crisis' Effects on Brazil
2.3 Literature Review on Competition Measures
2.3.1 The Role ofBanks in the Economy
2.3.2 The Quiet Life Theory
2.3 .3 Structural Approaches to Competition
2.3.4 Non-Structural Models for Competition
2.3.4.1 The Panzar Rosse Model
2.3 .5 Competition Measures Empirical Literature Review
2.4 Literature Review for Efficiency Analysis
2.4.1 Frontier Analysis
2.4.2 Cost Efficiency versus Profit Efficiency versus Alternate
Profit Efficiency
2.4.3 Parametric Estimation Techniques
2.4.3.1 Stochastic Frontier Approach
2.4.3.2 Distribution Free Approach
2.4.3.3 Thick Frontier Approach
2.4.3.4 Fourier Flexible Functional Form
2.4.4 Non-Parametric Estimation Techniques
2.4.4.1 Data Envelopment Analysis
2.4.4.1.1 Bank Activities and Approaches to Data Envelopment Analysis
2.4.4.2 Free Disposal Hull Approach
2.4.4.3 Malmquist Index
2.4.5 Empirical Literature Review for Efficiency Measures
3. Research Questions
Page 51
Page 55
Page 57 Page 58 Page 59 Page 60 Page 62 Page 63 Page 65 Page 74 Page 75 Page 78 Page 79 Page 80 Page 81 Page 81 Page 82 Page 82 Page 83 Page 87 Page 89 Page 90 Page 90
3.1 Principal Research Questions
3 .1.1 Research Question 1: Has the Brazilian banking sector
continued to consolidate over the period of the study?
3.1.2 Research Question 2: Has the Brazilian banking sector
become concentrated to the point that the government should
take action?
3.1.3 Research Question 3: What is the level of competition in the
Brazilian banking sector?
3.1.4 Research Question 4: How efficient is the Brazilian banking sector?
3.2 Fundamental Research Questions
3.2.1 Research Question 5: Has the concentration ofthe sector
had a negative effect on competition?
3.2.2 Research Question 6: How has the current financial crisis
effected the concentration in the Brazilian banking sector?
3.2.3 Research Question 7: Has the current financial crisis affected
competition in the Brazilian banking sector?
3.2.4 Research Question 8: Does ownership type have any relation
to efficiency in the Brazilian banking sector?
3.2.5 Research Question 9: Did the current financial crisis have any
effect on efficiency in the Brazilian banking sector?
3 .2.6 Research Question 10: Does the level of efficiency effect competition
in the Brazilian banking sector?
3 .2. 7 Research Question 11: Is Bigger Better? Does Bank Size have
any relation to efficiency in the Brazilian Banking Sector?
3.2.8 Research Question 12: Is the Quiet Life in effect in the Brazilian
Page 106
Page 106
Page 107 Page 107 Page 108 Page 108 Page 108 Page 109 Page 109 Page 110 Page 110
Page 111
banking sector?
4. Data and Methodology
4.1 The Data
4.2 Methodology
4.3 The Panzar Rosse Model
4.3.1 The Data Envelopment Analysis Model
5. Developments in the Brazilian Banking Sector
5.1 Concentration Ratios and Market Share
5.2 The Herfindahl Index Test for Market Power
5.3 The Effects of Concentration on Competition
5.4 Foreign Participation and Competition
6. Empirical Results
6.1 Empirical Results for the Panzar Rosse H-Statistic
6.1.1 Overall Competition Measure for 2002-2011
6.1.2 The Financial Crisis and Its Effect on Competition
6.1.3 Similarities of the Two Separate Dependent Variables' H-Statistics
Results
6.2 Empirical Results for Data Envelopment Analysis Efficiency Scores
6.2.1 Overall Efficiency Scores
6.2.2 Efficiency Scores by Ownership Type
6.2.3 Efficiency Scores by Bank Size
6.2.4 The Effects of the Financial Crisis on Banking Efficiency
6.2.4.1 The Financial Crisis and Banking Efficiency by Ownership Type
6.2.4.2 The Financial Crisis and Banking Efficiency by Bank Size
7. Conclusions, Contribution to Scientific Knowledge and Further Research
Page 111
Page 113
Page 113
Page 114
Page 114
Page 120
Page 125
Page 125
Page 129
Page 131
Page 134
Page 136
Page 136
Page 137
Page 143
Page 153
Page 154
Page 154
Page 157
Page 161
Page 166
Page 166
Page 168
7.1 Conclusions
7.2 Contribution to Scientific Knowledge
7.3 Further Research
References
Appendix 1: Total Asset Quarterly Concentration Ratios Q 1 2002 - Q 1 2011
Appendix 2: Total Deposit Quarterly Concentration Ratios Q1 2002- Q1 2011
Appendix 3: Total Loans Quarterly Concentration Ratios Q 1 2002 - Q 1 2011
Appendix 4: Graphs of Concentration Ratios for Total Assets,
Total Deposits and Total Loans Q1 2002- Q1 2011
Appendix Sa: Descriptive Characteristics and Averages
Appendix 5b: Quarterly Descriptive Averages Q1 2002- Q1 2011
Appendix 6: Quarterly Herfindahl Index Q1 2002- Q1 2011
Appendix 7: Quarterly Market Structure by Ownership Q 1 2002 - Q 1 20 11
Appendix 8: Quarterly Market Share of Total Assets by Ownership Type
Q1 2002- Q1 2011
Appendix 9: Quarterly Market Share of Total Deposits by Ownership
Type Q1 2002- Q1 2011
Appendix 10: Market Share of Total Loans by Ownership Type
Q1 2002- Q1 2011
Appendix 11: Descriptive Statistics for Regression of
Page 170
Page 180
Page 181
Page 184
Page 192
Page 193
Page 194
Page 195
Page 196
Page 197
Page 198
Page 199
Page 200
Page 201
Page 202
Concentration Measures on Competition 2002-2010 Page 203
Appendix 12: Correlation Matrix for Concentration Measures and H-Statistics Page 204
Appendix 13: Quarterly Average DEA Efficiency Scores by Ownership
Type Q1 2002- Q1 2011 Page 205
Efficiency Scores by Ownership Graphs Q 1 2002 - Q 1 2011
Appendix 15: Weighted Average Quarterly DEA Efficiency Scores by
Ownership Q 1 2002 - Q 1 2011
Appendix 16: Average Quarterly DBA Efficiency Scores by Bank Size
Q1 2002- Q1 2011
Appendix 17: Weighted Average DBA Efficiency Scores by Bank Size
Q1 2002- Q1 2011
Appendix 18: Average and Weighted Average Quarterly DBA Efficiency
Scores by Bank Size Graphs Q 1 2002 - Q 1 2011
Appendix 19: Correlation Matrix for 2002-2011 Panzar Rosse Model B
Appendix 20: Correlation Matrix for 2002-2011 Panzar Rosse Model IR
Appendix 21: Correlation Matrix for 2002-2011 Model X
Appendix 22: Correlation Matrix for 2002-2008 Pre-Financial Crisis Model B
Appendix 23: Correlation Matrix for 2002-2008 Pre-Financial Crisis
Page 206
Page 207
Page 208
Page 209
Page 210
Page 211
Page 212
Page 213
Page 214
2002-2008 Model IR Page 215
Appendix 24: Correlation Matrix for 2002-2008 Pre-Financial Crisis Model X Page 216
Appendix 25: Correlation Matrix for 2009-2011 Post-Financial Crisis Model B Page 217
Appendix 26: Correlation Matrix for 2009-2011 Post Financial Crisis Model IR Page 218
Appendix 27: Correlation Matrix for 2009-2011 Post Financial Crisis Model X Page 219
Appendix 28: Correlation Matrix 2002-2011 for all banks with Total Revenue
to Total Assets and Interest Revenue to Total Assets Page 220
Appendix 29: Correlation Matrix 2002-2011 for Panel Banks with Total Revenue to Total
Assets and Interest Revenue to Total Assets Page 221
Appendix 30: Correlation Matrix 2002-2008 for all banks with Total Revenue to Total Assets
Appendix 31: Correlation Matrix 2002-2008 for Panel Banks with Total
Revenue to Total Assets and Interest Revenue to Total Assets
Appendix 32: Correlation Matrix 2009-2011 for all banks with Total Revenue
to Total Assets and Interest Revenue to Total Assets
Appendix 33: Correlation Matrix 2009-2011 for Panel Banks with Total Revenue
Page 223
Page 224
to Total Assets and Interest Revenue to Total Assets Page 225
Appendix 34: Correlation Matrices for Quarterly H-Statistic Results and
Total Assets Correlation Measures
Appendix 35: Correlation Matrices for Quarterly H-Statistic Results and
Total Deposits Correlation Measures
Appendix 36: Correlation Matrices for Quarterly H-Statistic Results and
Total Loans Correlation Measures
Appendix 37: Relationship Between Competition and Total Assets
Concentration (CR3, CR5, CR10 and ID) with Total Revenue over
Total Assets as the Dependent Variable
Appendix 38: Relationship Between Competition and Total Deposits
Concentration (CR3, CR5, CRIO and ID) with Total Revenue over Total
Assets as the Dependent Variable
Appendix 39: Relationship Between Competition and Total Loans
Concentration (CR3, CR5, CR10 and ID) with Total Revenue over Total
Assets as the Dependent Variable
Appendix 40: Quarterly H-Statistics with Total Revenue over Total Assets
and Total Revenue as the Dependent Variables
Appendix 41 : Graph of Quarterly H -Statistics with Total Revenue over Total
Assets and Total Revenue as the Dependent Variables
Page 226
Page 226
Page 226
Page 227
Page 228
Page 229
Page 230
Abbreviations Index
AE - Allocative Efficiency
BO VESPA - Bolsa de Val ores Mercadorias & Futuros de Sao Paulo
BRIC -Brazil, Russia, India, China
CAMEL (Capital adequacy, Asset quality, Management quality, Earnings ability and
Liquidity position)
CDI- Certificate of Inter-Financial Deposit (Certificados de Deposito Interfianceiro)
CR - Concentration Ratio
CRS - Constant Return to Scale
DEA - Data Envelopment Analysis
DF A - Distribution Free Approach
DMU- Decision Making Unit
EE- Total Economic Efficiency
EU- European Union
FDH- Free Disposal Hull
FF- Fourier Flexible Functional Form
GDP- Gross Domestic Product
HI - Herfindahl Index
lA - Intermediation Approach
PROER - Program of Incentives to the Restructuring and Strengthening of the National
Financial System
P A- Production Approach
PR- Panzar Rosse Model
PROES - Program of Incentives to the Reduction of the State-Level Public Sector in Bank
ROA- Return on Assets
ROE -Return on Equity
SCP- Structure Conduct Performance Paradigm
SELIC- Sistema Especial de Liquidacao e Custodia or Overnight Rate
SF A - Stochastic Frontier Analysis
SME - Small and Medium Size Enterprises
TA- Total Assets
TD - Total Deposits
TF A- Thick Frontier Analysis
TE- Technical Efficiency
TL- Total Loans
VRS - Variable Return to Scale
Figures, Tables and Charts Index
Page 24:
Page 28:
Page 38:
Page 39:
Page 43:
Page 44:
Page 45:
Page 46:
Page 53:
Page 64:
Page 85:
Page 89:
Page 126:
Chart 2.1 Yearly Average Consumer Price Inflation in Brazil 2002-2009
Table 2.1 Market Structure of the Brazilian Banking System by Branches and
Ownership, 2002-2011
Table 2.2 Top 10 Banks by Total Assets Q1 2002 versus Q1 2010
Chart 2.2 Quarterly Average SELIC Rate 2002-2011
Chart 2.3 Comparison Bank Interest Rate Spreads for Average Lending Rates
for Brazil, Mexico, Argentina and Chile 2002-2009
Chart 2.4 SELIC Overnight Rate, Official Long Term Interest Rate, General
Lending Rate, Corporate Lending Rate, and Individual Interest Rate in effect in Brazil from December 2009 to June 2011
Chart 2.5 Quarterly Real/Dollar Exchange Rates Q1 2002 to Q1 2011
Chart 2.6 Monthly Bovespa Index Close January 2002- May 2011
Chart 2.7 The Growth ofthe Repo Market in Brazil2002-2011
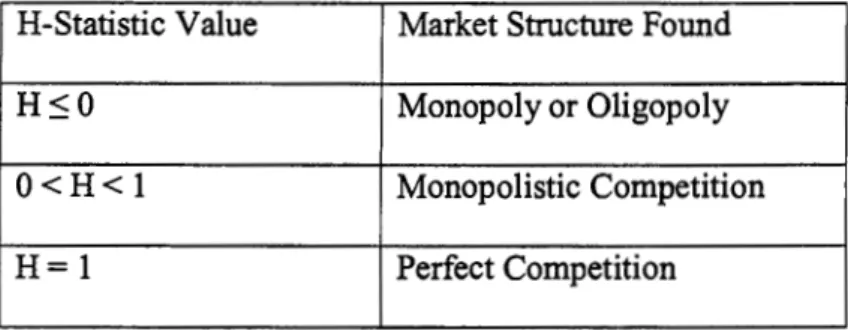
Table 2.3 Panzar Rosse H-Statistic Explanatory Values
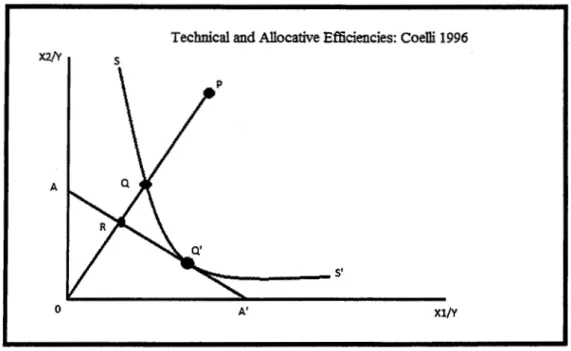
Figure 2.1: Technical and Allocative Efficiencies Shown on an Input Oriented
Two Input One Output CRS Model
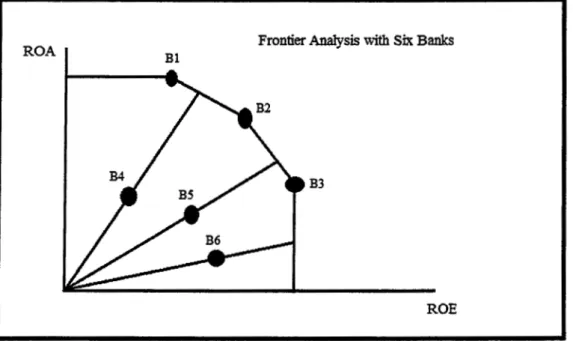
Figure 2.2 Frontier Analysis with Six Banks Example on a Two Axis
Efficiency Frontier Based on Return on Assets as the Y axis and Return on
Equity as the X axis and Variable Returns to Scale
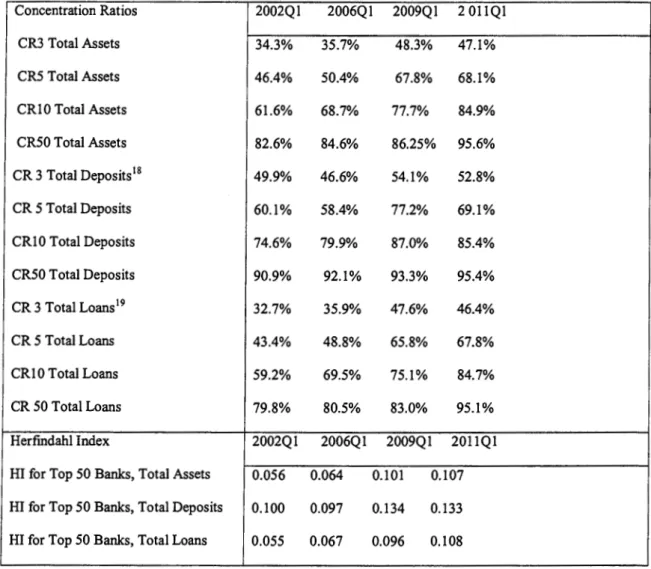
Table 5.1 Concentration Ratios and Herfmdahl Index for Brazilian Banks, Q1
Page 130:
Page 132:
Page 132:
Page133:
Page 134:
Page 140:
Page 141:
Page 145:
Page 147:
Page 149:
Chart 5.1 Herfindahl Index Test for Market Power for Total Assets, Total
Deposits and Total Loans in Brazilian Banking by Quarter, Q1 2002- Q1
2011
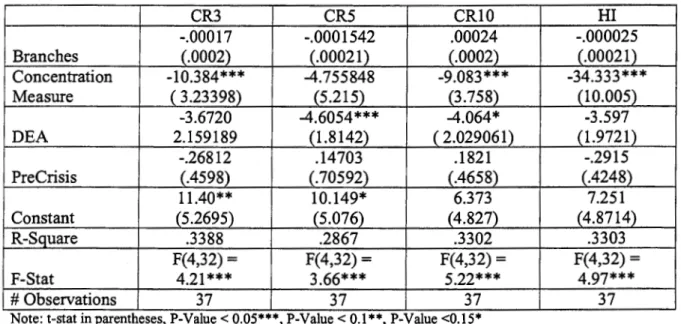
Table 5.2 Relationship Between Competition and Total Asset Concentration
(CR3, CR5, CR10 and HI)
Table 5.3 Relationship Between Competition and Total Deposits
Concentration (CR3, CR5, CR10 and HI)
Table 5.4 Relationship Between Competition and Total Loans Concentration
(CR3, CR5, CR10 and HI)
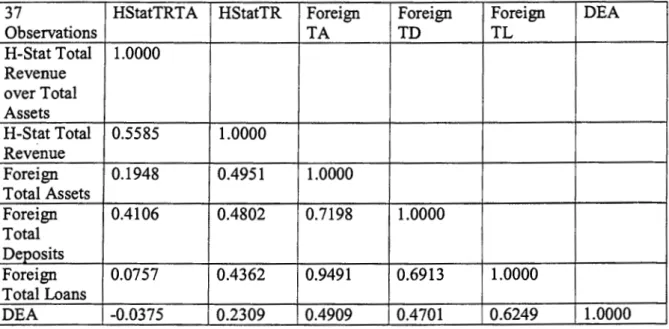
Table 5.5 Correlation Matrix of Quarterly H-Statistics and Foreign
Participation
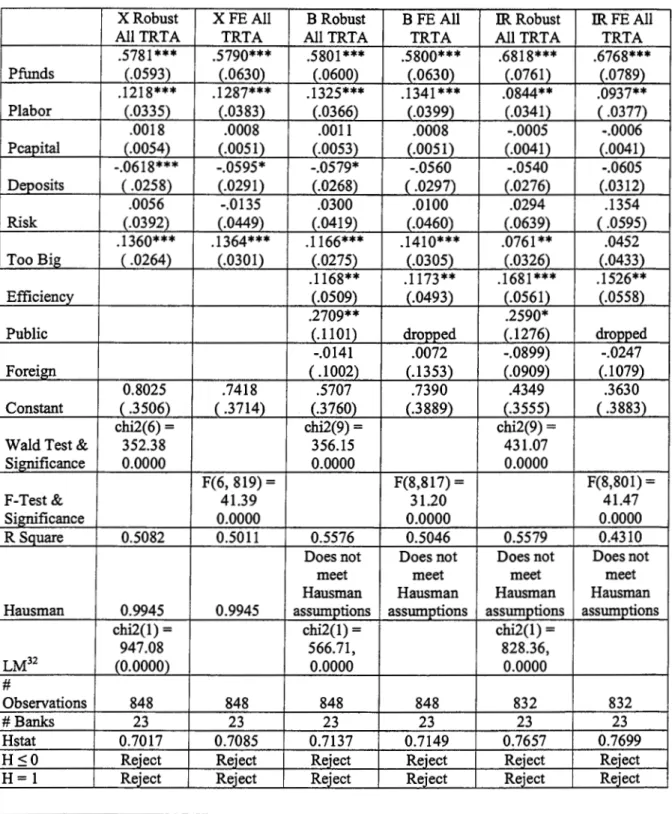
Table 6.1.1 Regression Results for Panzar Rosse for 2002-2011 with Total
Revenue and Interest Revenue as the dependent variables
Table 6.1.2 Regression Results for Panzar Rosse for 2002-2011 with Total
Revenue over Total Assets and Interest Revenue over Total Assets as the
dependent variables
Table 6.2.1 Regression Results for Panzar Rosse Pre-Financial Crisis Period
2002-2008 with Total Revenue and Interest Revenue as the dependent
variables
Table 6.2.2 Regression Results for Panzar Rosse Pre-Financial Crisis Period
2002-2008 with Total Revenue over Total Assets and Interest Revenue over
Total Assets as the dependent variables
Table 6.3.1 Regression Results for Panzar Rosse Post-Financial Crisis Period
2009-2011 with Total Revenue and Total Interest Revenue as dependent
Page 150:
Page 154:
Page 155:
Page 156:
Page 158:
Page 160:
Page 162:
Page 163:
Page 164:
Page 165:
Page 167:
Page 168:
Page 174
Table 6.3.2 Regression Results for Panzar Rosse Post-Financial Crisis Period
2009-2011 with Total Revenue over Total Assets and Total Interest Revenue
over Total Assets as dependent variables
Table 6.3.3 Summary of Robust Standard Error H-Statistic Measures for
Overall, Pre-Crisis and Post-Crisis periods by Model and Dependent Variable
Chart 6.1 Average Yearly DEA Efficiency Scores by Ownership Type
Chart 6.2 Weighted Average Yearly DEA Efficiency Scores by Ownership
Type 2002-2011
Table 6.4 Average Yearly DEA Efficiency Scores by Ownership Type
2002-2011
Table 6.5 Weighted Average Yearly DEA Efficiency Scores by Ownership
Type 2002-2011
Chart 6.3 Average Yearly DEA Efficiency Scores by Bank Size 2002-2011
Table 6.6 Average Yearly DEA Efficiency Scores by Bank Size 2002-2011
Chart 6.4 Weighted Average Yearly DEA Efficiency Scores by Bank Size
2002-2011
Table 6.7 Weighted Average Yearly DEA Efficiency Scores by Bank Size
2002-2011
Table 6.8 Pre-Financial Crisis (2002-2007) and Post-Financial Crisis
(2008-20 11) Efficiency Scores Based on Ownership Type
Table 6.9 Pre-Financial Crisis (2002-2007) and Post-Financial Crisis
(2008-20 11) Efficiency Scores Based on Bank Size
Chart 7.1 Overall, Pre- and Post-Crisis H -Statistic Scores with Robust
Chapter 1: Introduction
1.1 The Purpose of the Thesis and Main Research Questions
This thesis sets out to analyze the Brazilian banking sector from 2002 to the first quarter of
2011. The thesis analyzes the developments in concentration and market structure in the
industry. Additionally, it uses an established competition measure, the Panzar Rosse
H-Statistic, to measure competition in the Brazilian banking sector. It further develops the
relative efficiency scores for Brazilian banks with an input oriented Data Envelopment
Analysis. Finally, the effects of the current financial crisis on competition and efficiency are
calculated and analyzed. The main research questions deal with the developments in each of
these areas over the period and are as follows.
• Has the Brazilian banking sector continued to consolidate over the period of the
study?
• Has the Brazilian banking sector become concentrated to the point that the
government should take action?
• What is the level of competition in the Brazilian banking sector?
• Has the concentration of the sector had a negative effect on competition?
• How has the current financial crisis effected the concentration in the Brazilian
banking sector?
• Has the current financial crisis affected competition in the Brazilian banking sector?
• How efficient is the Brazilian banking sector?
• Did the current financial crisis have any effect on efficiency in the Brazilian banking
sector?
• Does the level of efficiency effect competition in the Brazilian banking sector?
• Is Bigger Better? Does Bank Size have any relation to efficiency in the Brazilian
Banking Sector?
• Is the Quiet Life in effect in the Brazilian banking sector?
1.2 Introduction and Brief Summary of the Thesis
Over the past two decades Brazil has become an economic power on the world stage.
Whether it is their increased voice in world affairs, e.g. World Trade Organization
negotiations, continued developments in energy independence, agricultural commodities and
industrial raw materials or increased participation in the world banking markets; Brazil has
arrived on the world stage. Over this period of general development and change, the Brazilian
banking sector has changed as well. From an economy of hyperinflation in the early 1990's to
government liberalization and privatization in the late 1990's (resulting in a boom and bust of
foreign banks) and finally the rise of dominant domestic banks, the result of all of these
incidents is a concentration of the Brazilian banking market in the 2000's.
The Brazilian banking sector has seen not only an intense amount of concentration in terms
of total assets, total deposits and total loans, but a high level of competition from 2002-2008,
with a drop in competition in the 2009-2011 period due to the effects of the financial crisis.
Competition itself is vital to any industry and with it comes winners and losers, regardless of
government plans or actions. As a result certain banks have become more efficient and the
more efficient banks have been able to win new customers as they are able to bring more
increase in market share of the largest banks as well as their consistently higher efficiency
scores. Competition and the need for efficiency drives industries to be more concentrated and
thus the stronger more efficient banks have become even larger at the expense of their less
efficient/competitive rivals. This seems to be the scenario playing out in the Brazilian
banking sector during the period of study.
Given the many recent changes in competition and market structure within the Brazilian
banking sector, we set out to investigate how the banking market structure, banking
efficiency, and overall competition have changed from 2002 to the beginning of 2011 in
order to show their individual developments and to also see the effect of the financial crisis
on each of them. Our study focuses on the 50 largest universal banks in Brazil on a quarterly
basis and in terms of Total Assets. We analyze the market structure in terms of market
concentration in Total Assets, Total Deposits and Total Loans with regard to bank size as
well as ownership type (Public Banks which are owned by the federal or individual state
governments, Domestic Private Brazilian Banks and Foreign Banks) in order to determine at
what pace and in which way the Brazilian banking market structure has changed during the
period.
Additionally, we apply the Panzar Rosse (PR) model in order to test for competition and
hence market structure within the Brazilian banking sector. The Panzar Rosse model uses a
so-called H-statistic as a measure of banking competition. It is based on a reduced revenue
equation that uses factor input prices in order to test for competition while using
concentration as a proxy for competition. We assessed the development of the H -Statistic
pre- and post-financial crisis point divided at the end of 2008 (2002-2008 and 2009-2011
being the two periods) in order to gauge market competition developments over the period.
Furthermore, we test for efficiency developments in the Brazilian banking sector using Data
Envelopment Analysis (DEA) that allows us to surmise if banks' managerial decisions on
cost controls are being affected by the concentration in the market and how efficiency may be
affecting competition in the sector.
The results from our analyses show that over the period in question the concentration ratios
for the top five and top ten banks in Brazil increased considerably over the period in terms of
Total Assets and Total Loans with a less severe concentration increase in Total Deposits,
while the total market share for the top 50 banks remained relatively unchanged over the
period. This tells us that the big banks in Brazil are getting larger at the expense of their
smaller competitors. The Herfindahl Index, which is another measure of concentration, shows
an increase in concentration over the period as well in terms of Total Assets, Total Deposits
and Total Loans, however they have not reached levels of an over concentrated market that
would cause government concern.
The Panzar Rosse H-Statistic was used as a proxy for competition and it showed that over the
2002-20111 period the Brazilian banking sector was found to be monopolistic competition.
When analyzing the differences in competition levels before and after the financial crisis we
see that the competition fell drastically due to the effects of the financial crisis, however it
The DBA analysis over the period showed that the largest banks are considerably more
efficient than their smaller counterparts and the gap between the two has widened over the
period. Also public banks (state or federally owned) were the most efficient banks in the
study. Therefore, we can say that large Brazilian banks are not taking the "Quiet Life"
approach and becoming less efficient as they grow larger.
However, the slight overall decline in the banking sector in overall relative efficiency was
mostly influenced by a dip in efficiency over the 2009-2011 period. This dip was due to the
effects of the financial crisis facing the banks during the 2009-2011 period. In relation to the
financial crisis and efficiency, regardless of ownership type efficiency fell around 10% across
the board. However, if looking at bank size the largest banks only had a small dip (about 2%)
in relative efficiency from pre-financial crisis levels.
Therefore we can say the less competitive banks were being driven out of the market or at
least to a less important position. This exodus is in accord with Demsetz' Efficiency
Hypothesis that states that more competitive and efficient banks will win market share from
less efficient/competitive rivals as they can pass on their savings from efficiency onto their
customers by charging a lower price. This would seem to be the case for the Brazilian
banking industry as we see in our results on banking efficiency.
1.3 Structure of the Thesis
The thesis continues with Chapter 2 discussing the makeup and recent history of the Brazilian
banking industry and contains the literature review on competition measures and on
efficiency measures. Chapter 3 focuses on the research questions of the thesis. Chapter 4
contains the developments in terms of market structure and concentration in the Brazilian
banking sector over the period of the study. Chapter 6 contains the empirical results of the
Panzar Rosse and Data Envelopment Analysis models. And Chapter 7 summarizes the
findings, notes the thesis' contribution to scientific knowledge and suggestions for further
Chapter 2: Literature Review
2.1 Overview of the Literature
This study contains information and data from various scientific and professional sources in
order to give the reader a better background into competition measures, efficiency measures
and the Brazilian banking sector's history. This is in order for readers to better understand the
changes that have occurred over the analyzed 2002 to 2011 period. The topics covered in the
literature review are as follows.
• Historical financial background of the market structure, banking
regulation/deregulation and the overall functioning of the Brazilian Banking Sector.
• Literature review on competition measures and specifically for the Panzar Rosse
Model.
• Literature review on various efficiency analyses.
2.2 Historical Financial Background of the Market Structure and
Functioning of the Brazilian Banking Sector
2.2.1 A Historical Perspective on the Brazilian Banking Sector
In Chapter 5 the market structure and ownership developments within the Brazilian Banking
sector are fully analyzed. These results show that the sector has increased in concentration in
5 it is important to know the historical and financial background that led up to the
consolidation of the Brazilian banking sector. This is done in order to better understand and
explain these developments. Therefore, we must look over the past twenty years in Brazilian
banking and develop an understanding of how the market has transformed over the time
period. These past twenty years have been marked by reform, new regulations, foreign
investment, new bank entry and exit, privatization, consolidation, and changes in competition
and efficiency.
Additionally, the banking system in Brazil allows for banks to operate in multiple areas of
financial activity. They can combine the activities of commercial, investment, development,
leasing, and mortgage lending banks into a conglomerate bank. This conglomerate bank is
then the bank that reports to the Central Bank and is also reported and analyzed in our
studies. This is an important factor when looking at the securitizations that took place in
order to circumvent certain Central Bank reserve requirements which will be discussed later.
2.2.2 The Real Plan
When focusing on the Brazilian government's participation, influence and instituted changes
in the sector the first step in these series of changes was the Real Plan. This was a major
stabilization plan developed by the Brazilian government in order to reign in years of
runaway inflation1 and fiscal irresponsibility. The Real Plan used a semi-fixed exchange rate
in conjunction with more open trade and investment policies. This led to a quasi-dollarization
of the Brazilian Real. It was not a direct one to one dollarization as was the case in Argentina
after the Mexican crisis in 1994-1995 when the Brazilian government began to allow the Real
to devalue little by little. This led to a full free float of the Real in 1999 after a period of
intense speculative pressure on the currency leading up to the free float (De Paula and Alves
2003). After the free float of the Real the government focused on inflation targeting. This
inflation targeting helped maintain single digit inflation even after the free float and continues
to today.
Chart 2.1 Yearly Average Consumer Price Inflation in Brazil 2002-2009
16
14
12
10
8
6
4
2
0
A
/ \ .
/
\.
/
\.
'"
2002 2003 2004
...
"'
2005 2006
Source: International Monetary Fund World Economic Outlook 2009.
~
-2007 2008 2009
The Real Plan had a striking and significant effect on inflation after its introduction in 1994,
and continued to help control inflation even after the devaluation of the Brazilian Real in
January of 1999 (De Paula and Alves 2003). According to the Brazilian government the
inflation rate in 1994 was 2,240% and by 1998 it had fallen to 4.85%. In the year 2000 after
the floating of the Brazilian Real inflation stayed at a respectable 8.03% even with the added
pressure of the ending of the true semi-fixed exchange rate portion ofthe Real Plan in 1999.
price inflation, as seen in Chart 2.1, there was a slight increase in inflation during the
Argentine financial crisis of 2002/2003 and a brief upturn in inflation at the beginning of the
2008/2009 financial crisis.
Before the Real Plan, Brazilian banks made a profit from inflation charges. Inflation charges
are felt by non-interest bearing deposits and cash deposits. Since the banks are the issuers of
the deposits they receive a part of the inflation charges. This charge was a significant
percentage of Brazilian banks' profits. In the early 1990s inflation charges for banks
accounted for 3.4% ofGDP (Nakane and Weintraub 2005).
However, after the instatement of the Real Plan and Brazil changing from a high inflation
country to a low inflation country the inflation charges as a percentage of GDP dropped to
0.03% in 1995 (De Paula and Alves 2003). If we take into account that the average yearly
inflation rate was over 336% for the 1980's in Brazil we see that this had been a long
standing income generator for Brazilian banks (Fraga 2004). However, this dramatic drop in
income from inflation charges led banks to more risky loan agreements with clients that may
not have been deemed credit worthy before. This led to more loan defaults and more bank
bailouts by the federal government. Additionally, with low levels of legal protection for
creditors in the 1990s did not help the situation (Lucinda 201 0).
There were two further effects of the high inflation rates. First, the over branching of banks as
to limit the downside effects of the high levels ofinlfation. These extra branches became less
profitable after the Real Plan was instituted as the need for extensive branch networks waned.
The second and more positive effect was a high level of investment in information
technology. This investment was done in order for the banks to be able to quickly clear
inter-bank balances so as to suffer the least amount of negative effects from the high levels of
inflation. This helped to institute more efficient bank transactions throughout the banking
system (Lucinda 201 0).
The increase in bailouts along with other financial and economic problems led to additional
measures being taken by the Brazilian government in order to reign in some of the inefficient
state banks within Brazil as well as inefficient and unsafe private banks. These measures set
out to facilitate the exit or purchase of inefficient or risky banks. Belaisch (2003), Beck et al.
(2005), Neto et al (2005), and Nakane and Weintraub (2005) take a specific look at the
transformations in the Brazilian banking sector from before the Real Plan to after the
deflation of the Brazilian Real roughly the period 1990-2002.
2.2.3 PROES - Program of Incentives to the Reduction of the State-Level
Public Sector in Bank Activity
Before the Real Plan the state-owned banks in Brazil, (that would be the banks owned by the
individual states within the country, i.e. Sao Paulo, Espirito Santo, Parana, etc.) had a long
bail the state banks out of financial problems on numerous occasions. This in itself led to
more problems as state banks knew that the federal government would bail them out if their
financial situation became to dire. The federal government decided it needed to do something
with their financially troubled state banks (Beck et al 2005). The proposal for dealing with
the state banks need for reform came about in 1996 with the PROBS program (Program of
Incentives to the Reduction of the State-Level Public Sector in Bank Activity).
Within PROBS a state bank had essentially five choices. The first choice was to leave the
market completely through liquidation. Second, the bank could allow the federal government
to take control and privatize or liquidate the bank. Third, the bank could privatize on its own.
Fourth, the bank could be restructured and continue running as a state bank. There was a
further fifth option of turning the bank into a developmental agency (Beck et al 2005). Due to
a long history of state governments using their state banks as patronage mechanisms it would
seem that the state governments would prefer to restructure their banks and keep them under
their control.
However, in order to maintain control of their state bank the state governments would have to
cover at least half of the restructuring costs and institute full scale management changes.
These criteria set by the federal government were meant to force states' hands in the matter
and make them privatize their banks. With that purpose in mind the PROES was successful
due to the fact that in 2002 there were only 14 of the original 32 public banks remaining in
operation from 1994. Of those 14 banks 9 were ranked in the top 50 in terms oftotal assets in 2002 and in the first quarter of 2002 they held 29.4% of Total Assets, 45.5% of Total
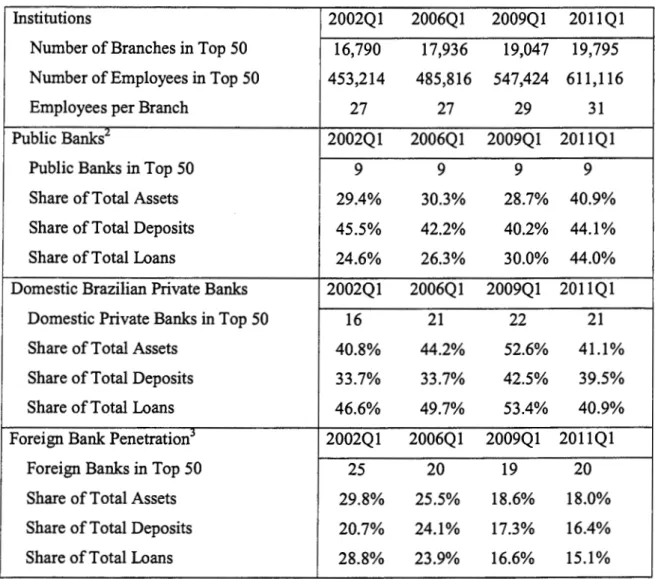
Table 2.1 Market Structure of the Brazilian Banking System by Branches
and Ownership, 2002-2011
Institutions 2002Q1 2006Q1 2009Q1 2011Q1
Number of Branches in Top 50 16,790 17,936 19,047 19,795 Number of Employees in Top 50 453,214 485,816 547,424 611,116
Employees per Branch 27 27 29 31
Public Banks:.! 2002Q1 2006Q1 2009Q1 2011Q1
Public Banks in Top 50 9 9 9 9
Share ofTotal Assets 29.4% 30.3% 28.7% 40.9%
Share ofTotal Deposits 45.5% 42.2% 40.2% 44.1%
Share ofTotal Loans 24.6% 26.3% 30.0% 44.0%
Domestic Brazilian Private Banks 2002Q1 2006Q1 2009Q1 2011Q1
Domestic Private Banks in Top 50 16 21 22 21
Share of Total Assets 40.8% 44.2% 52.6% 41.1%
Share ofTotal Deposits 33.7% 33.7% 42.5% 39.5%
Share ofTotal Loans 46.6% 49.7% 53.4% 40.9%
Foreign Bank PenetrationJ 2002Q1 2006Q1 2009Q1 2011Q1
Foreign Banks in Top 50 25 20 19 20
Share ofTotal Assets 29.8% 25.5% 18.6% 18.0%
Share of Total Deposits 20.7% 24.1% 17.3% 16.4%
Share ofTotal Loans 28.8% 23.9% 16.6% 15.1%
Source: Banco Central do Brasil and author calculations. Top 50 based on Total Assets.
It would be safe to say that the PROES program had run its course by the beginning of 2002.
Looking at Table 2.1 we note that the number of public banks ranking in the top 50 stays
constant over the period 2002-2011 with nine banks ranking in the top 50 (with an occasional
appearance of small public banks reaching the lower parts of the top 50 in terms of assets and
on a few occasions giving them ten banks in the top 50, see Table 2.1 and Appendix 7). Total
2 Banks that are either federally or state controlled. 3
Assets held by public banks in the top 50 held relatively constant from 2002 to 2009, 29.4%
in Ql 2002,30.3% in Q1 2006, and 28.7% in Ql 2009 then there is an uptick to 40.8% in Q1
20114• While their percentage ofTotal Loans increased from 24.6% in Q1 2002, to 26.3% in
Q1 2006, to 30.0% in Q1 2009 to 43.4% in Q1 2011. This increase is attributed to a
combination of shrinking influence of foreign banks in the market and a slight jump by the
Central Bank's inclusion of the national developmental bank in the government's Top 50
Universal Banks data set.
However, public banks did see stagnation in their market share in Total Deposits over the
2002-2011 period. Their Total Deposits were 45.5% in Q1 2002, 42.2% in Q1 2006 07,
40.2% in Q1 2009 and 44.1% in Q1 2011. This lowering or stagnation ofpercentages could
be attributed to the banks significantly higher initial market share in Total Deposits in
comparison to their market shares in Total Assets and Total Loans, as well as an increase in
domestic Brazilian banks' shares in the deposits market. Also, consumer sentiment in regards
to public banks may have also played a role in the non-correspondence.
We must keep in mind that though the largest public banks in Brazil are owned by the federal government they are not fully public. They do list their shares on the Brazilian stock market,
the BOVESP A, as well as other markets around the world and therefore have private
management groups and some private investors who apply pressure to maintain a profit
regardless of government initiatives. Though the public banks in Brazil are majority
controlled by the federal or state government, they perform the same tasks as their domestic
for private as well as professional customers and work in the foreign exchange and fund
markets.
Therefore, we can say that the public and private banks are competing fully throughout the
market. Yet the main difference between the public and private banks in terms of duties is the
requirement of public banks to provide services to the Brazilian government and their social
policies, i.e. retirement benefits or micro-credit schemes. These policies may raise public
banks costs due to the unevenness of government policy and actual costs incurred by said
policies. The banks would then pass a burden onto the banks customers to cover costs arising
from government policy decisions that raise banks' operational costs.
2.2.4 PROER -
Program of Incentives to the Restructuring and
Strengthening of the National Financial System
PROES was only the first step in shoring up the banking sector. Additionally, the private
sector banks were compelled to change ownership structure and business style by the PROER
program in 1995 (Program of Incentives to the Restructuring and Strengthening of the
National Financial System). Under PROER weak, inefficient or threatened banks had the
option to either increase their capital, transfer shareholder control or be merged with another
bank. In order to facilitate the transition and sales of the weaker private banks the central
bank enacted measures to make it easier for stronger banks to purchase their weaker
The PROER program saw a dramatic decrease in the number of private domestic banks
within Brazil, from 146 in 1994 to only 75 in 2002, of which 16 were in the top 50 universal
banks. This drop in real numbers of banks did not mean a drop in the share of the banking
market held by Brazilian domestic banks. In terms of share of deposits, domestic private
banks had a 38.85% share ofthe market in 1993 and a 37.16% share in 2002. Additionally,
their share of the loan market increased from 31.55% in 1993 to 40.45% in 2002. This
increase in the loan market was due in part to the extreme drop off in the share of public
sector banks, which fell from 61.88% of the loan market in 1993 to a mere 29.07% in 2002
(Nakane and Weintraub 2005). Consequently, again, we could say that the PROER program
was a success in what it set out to do, eliminate inefficient and unsafe private Brazilian
domestic banks.
It is important to note that the changes instituted by the PROER program helped to solidify
the private domestic banking market and set it up for its continued growth post-2002 by
helping to eliminate the inefficient and unsafe banks it was meant to weed out. In Chapter 5
looking at Table 5.1 we can see that the true "winner" of the 2002-2011 period is the
domestic private banks. Just in terms of the participation of the private domestic banks in the
top 50, their market share has increased in Total Assets from 40.8% in Q1 2002, to 44.2% in
Q1 2006, 52.6% in Q1 2009 and a decline to 41.1% in Q1 20115, Total Deposits from 33.7%
in Q1 2002, to 33.7% in Q1 2006, 42.5% in Q1 2009 and 39.5% in Q1 2011, and in Total
Loans increased from 46.6% in Q1 2002, to 49.7% in Q1 2006, and 53.4% in Q1 2009, and
40.8% in Q1 2011. However, contrary to the post-PROES and PROER period (1994-2002),
this time the domestic private banks gained more from the failings of foreign banks as
opposed to public banks.
With the conclusion of the Real Plan, PROBS and PROER programs some would surmise
that the government would take a smaller part in other banking activities in order to allow the
market to dictate rates and borrowing. However, due to the limited amount of long term loans
available from private banks within Brazil the federal and state governments play a key role
in long term financing projects as well as long term financing for corporations and
individuals as their goals are more geared toward long term development and less toward
profit maximization (Teixeira and Mollo 2006).
2.2.5 Foreign Bank Participation in Brazil
In terms of foreign participation in the Brazilian market, the opening of the banking sector
and ability of foreign banks to purchase Brazilian domestic banks, in correspondence with the
Real Plan, led to a large investment by international banks within Brazil. With the overall
banking industry consolidating from 246 banks in 1994 to 155 in 2002, the number of foreign
controlled banks rose from 37 to 56 in the same time period. Additionally, the share of the
market of foreign banks in terms of net worth, assets, deposits, and share of the loan market
increased at an astounding rate. The share of the net worth of the Brazilian banking sector
controlled by foreign banks rose from 7.3% in 1993 to 33.6% in 2002, while the share of
assets rose from 8.4% to 27.7%, deposits from 4.8% to 20.1%, and share ofthe loan market
increased from 6.6% to 30.5% (Nakane and Weintraub 2005).
Claessens et al's study (2001) found some interesting results when comparing foreign banks
in developed versus developing nations. While in developing nations foreign/international
would show that the structures used by international banks in developing nations are more
efficient and productive than their domestic developing nations' counterparts. Conversely,
this did not hold true in developed nations. This may be due to a level of trust or
entrenchment in the domestic developed banking sector where the domestic banks have
already asserted their own level of trust and reputation thus, cutting off one of the
international banks' main selling cards, i.e. a stable reputation.
The Brazilian example of the 1990's is a common occurrence across Latin America and the
consolidation of the domestic banking sectors did not have a negative effect on the foreign
banks numbers. The foreign banks may not have been as negatively affected by the downturn
as the domestic banks since they were geared toward more long-term strategies and had better
cost efficiencies than the domestic inefficient banks that went out of business (Levine 1996
and Nakane and Weintraub 2005).
Some of the benefits enjoyed by the domestic banking client with the onset of foreign bank
competition in the industry include an improved level of service, an increase in the number of
financial products available to the domestic consumer and increased regulation that would
allow for a more stable domestic banking environment (Levine 1996). Levine (1996) also
points out that the simple presence of internationally respected banks helps countries to be
able to gain access to international capital, because the international banks add credibility to
Additionally, as the market became more concentrated and inefficient firms were exiting the
market, the margins earned by the banks were reduced. This should be positive for the
consumer as they enjoy the benefit of lower cost banking (Claessens et al. 2001). These lower
bank margins of the surviving, more competitive banks would result in lower profits. Thus,
domestic banks were forced to become more cost efficient in order to stay competitive and
profitable (Claessens et al. 2001).
The main negative for the domestic banks would be the increased costs in competing against
a larger international bank with a stronger reputation than the domestic bank. The domestic
consumer may lose out as well, as international banks may not be as willing to offer riskier
loans for smaller domestic customers (Claessens et al2001, Becket al2005).
Further studies on foreign owned banks in domestic markets have shown interesting findings.
For example, foreign owned banks in the United States were shown to be significantly less
efficient than their US domestic counterparts (Chang et al., 1993, DeYoung and Nolle, 1996,
Mahajan et al., 1996). These studies ran through the early 1990s when foreign banks were
making a large push into the US banking market. Hence, we could say that the foreign banks
are not bringing new efficiency gains with them.
However, further research and conjecture would suggest that these non-US and non-Brazilian
banks were trading off efficiency for rapid growth in market share in ways that may not be
monetarily efficient, but do help them achieve their long term goals. The Data Envelopment
less efficient than their Brazilian domestic private and public counterparts, however for
further discussion on efficiency in the banking sector based on ownership see the Results
chapter below.
Regardless of the foreign banks efficiency actions upon entering, the reforms and
globalization of the financial sectors in Brazil and indeed all of Latin America throughout the
1990's, lead to a marked increase in foreign bank participation (Yildirim and Philippatos
2007). According to Nakane and Weintraub (2005) from 1994 to 2002 Brazil saw an increase
in the number of foreign owned banks of over 150% while the total number of banks in the
country fell to 63% of their 1994 numbers. This contrast in the success of foreign banks
versus the overall consolidation of the Brazilian banking market shows that the downfall of
the state and federal banks in Brazil due to PROES and the private banks due to PROER did
not necessarily transfer to the foreign banks within Brazil during the initial 1994-2002 period.
However, this honeymoon period for foreign banks within Brazil after the reforms of the
1990's was relatively short lived. Belaisch (2003) noted over the period 1995-2000 that
foreign banks were growing by buying up private domestic Brazilian banks. Their growth in
the market was significant, as stated above. Pre-reforms foreign banks were insignificant
players in the market; yet by 2001 they represented 28 of the top 50 banks in terms of Total
Assets. However, post-2002 the boom was over. Either by domestic private bank growth or
housing market problems brought on by the late 2000's world financial crisis, foreign bank
The highs that Belaisch (2003) and Nakane and Weintraub (2005) wrote of had started to
wither from 2002. Foreign banks' influence in the top 50 banks Total Assets also slowly
diminished over the 2002-20011 period. Foreign banks represented 50% of the top 50 banks
in Brazil in Q1 2002, but only held 19 ofthe top 50 spots by Q1 2009. The erosion of market
power did not limit itself to just the number of banks in the top 50, from a market share
point6-of-view Total Assets declined from 29.8% in Ql 2002 to 25.5% in Q1 2006 to a
further reduction to 18.6% in Q 1 2009 and 18.0% in Q 1 2011. Their share of the loan market
fell even more starting at 28.8% in Q1 2002 to 23.9% in Q1 2006 to 16.6% in Q1 2009 to a
further loss to 15.1% in Q1 2011.
The news was not all gloom and doom as the foreign banks held up better in terms of Total
Deposits, in Q1 2002 they had 20.7% of the market and rose to 23.9% of the market by Q1
2006, however, by Q1 2009 they had sunk back to 17.3% then 16.3% in Q1 2011 of Total
Deposits. The post crisis drops are more an effect of the flight of foreign banks from Brazil
than a loss of desirability of their services by Brazilian customers. For a full analysis of the
concentration ratios and market structure developments please see Chapter 5. For a full list of
quarterly developments in Total Assets, Total Deposits and Total Loans by Ownership see
Appendices 8, 9 and 10.
The shrinkage in foreign bank participation toward the end of the study fell dramatically as
some foreign banks had to re-evaluate their positions during and after the world wide banking
and financial crisis of 2008 to 2011. Still, some foreign banks had already decided to leave
the market or change their participation before this crisis. For example, as Staub et al (2010)
points out Bank of America sold its Bank Boston Brazilian assets to Itau in 2006 as they
found they were having difficulties increasing their market share in Brazil. There were
continued mergers and acquisitions throughout the late 2000's with the majority being larger
banks buying out their smaller niche rivals (Staub et al2010).
Additionally, as the market concentrated over the period mergers and acquisitions also
changed. It is no longer solely larger banks buying out their smaller competitors, they have
moved to buying other larger players as well. When Unibanco merged with ltau to become,
briefly, the largest bank in Brazil at the end of 2008 beginning 2009 it signaled that
consolidation within the large banks was a possibility as well.
With Foreign bank participation, the effects of the PROES and PROER plans the market did
consolidate (this is discussed in length further in chapter 5). However, if one looks at the top
ten banks in terms of assets in
Q
1 2002 versus the top 10 banks in terms of asset size inQ
12011 the list has not changed very much 7.
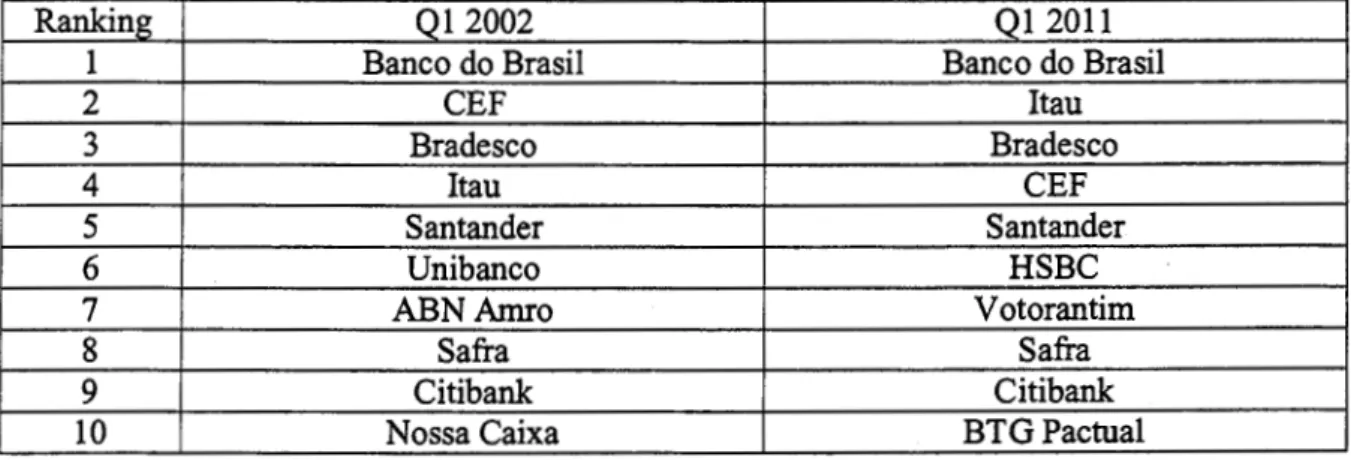
The top 10 in 2002 had three public banks (two federal and one state), three private domestic
banks and five foreign owned or participated banks. In 2011 that had changed to two public
(two federal banks, the one state bank having been acquired by Banco do Brasil (federal
public), four private domestic banks, and four foreign participation banks. Of the top 10 from
7
2002 three banks were no longer in existence having been acquired by other top ten banks
(Unibanco #6 in 2002 by Itau, ABN AMRO #7 in 2002 by Santander, and the previously
mentioned state bank ofNossa Caixa #10 in 2002 being absorbed by Banco do Brasil). And
the new additions to the top ten in 2011 HSBC from #12 to #6 (foreign), Votorantim from
#15 to #7 (private domestic), and BTG Pactual from #23 to #10 (foreign) were all major
players in 2002 as well.
Table 2.2 Top 10 Banks by Total Assets Q1 2002 versus Q1 2011
Ranking Ql2002 Q1 2011
1 Banco do Brasil Banco do Brasil
2 CEF Itau
3 Bradesco Bradesco
4 I tau CEF
5 Santander Santander
6 Unibanco HSBC
7 ABN Amro Votorantim
8 Safra Safra
9 Citibank Citibank
10 Nossa Caixa BTG Pactual
Source: Brazilian Central Bank statistics
2.2.6 Economic Indicators
There are other influences and characteristics within the Brazilian banking and financial
sector that should be noted. Brazilian banks have dealt with a history of inflation,
fluctuations in exchange rates, as well as domestic and international economic and financial
issues. This history of unstable macroeconomic factors have helped increase pressures from
within and without on the banking sector. The SELIC overnight money market interest rate
on the overnight rate for Brazilian banks. The peaks in 2002, 2005 and 2008 all are during
economic crises and/or pressures facing Brazil and international markets. Therefore, in order
to see what the true cost of capital was over the period using the SELIC rate gives the reader
an overall idea of the interest rates facing banks in the overnight market and thus, what could
be passed on to bank customers.
Chart 2.2 Quarterly Average SELIC Rate 2002-2011
0.3000
0.2500
0.2000
LIJ
~
a::
c.J 0.1500
::;
LIJ
Ill
0.1000
0.0500
0.0000
Source: Banco Central do Brasil and author calculations determining average SELIC rate for the quarter.
The overnight rate shows how economic/financial events, domestic or foreign, can affect the
interest rate in Brazil. If we take a look at the two peaks in the data, Q3 2002, and Q4 2008
the first represents the economic crisis in Argentina, Brazil and Uruguay in 2002, and 2008
affected the Real's value in the currency markets, see Chart 2.5, as well as the Brazilian stock
exchange the BOVESPA, as can be seen in Chart 2.6.
Brazil's termination of their quasi-dollarization of the Real in 1999 had a knock on effect
throughout South America. It along with other economic factors led to severe speculation on
the Argentine Peso which had been using a dollarization plan for quite some time. As
speculation on the Argentine Peso continued it led to an eventual devaluation of the Peso and
this had a further knock on effect hurting the Brazilian Real and economy as well. This was
mainly due to Brazil being one of Argentina's largest trading partners and neighbors. One can
see that during the peak of the crisis the SELIC rate went from a third quarter 2002 average
of 18.10% to 26.44% by the second quarter of2003. The 2002 crisis bump in the SELIC rate
was a combination of the effects of the flight from Brazilian government debt of investors, an
increase in inflation and a dip in the Real (Robitaille 2011).
During the global banking and financial crisis of 2008/2009 we can see a bump in the SELIC
rate from 11.25% in the first quarter of 2008 to 13.75% for the fourth quarter of 2008.
However by the second quarter of2009 the average quarterly rate was back down to 10.35%.
The knock -on effect of Argentina's currency crisis of the early 2000's is especially negative
as can be seen by the Brazilian Real losing approximately 40% of its value against the US
Dollar during the crisis.
However, it is important to note the overall downward trend in the SELIC rate as well as the
shocks. These would seem to allude to a more stable financial system that is more adept to
handling shocks in the market than had been the case in previous decades.
Furthermore, the SELIC interest rate is important in our analysis as it gives us banks cost of
capital and thus will allow us to see what banks have to pay for capital. Additionally, the
large fluctuations in the SELIC rates between Q1 2002 and Q1 2011 (minimum 8.75% Q4
2009, maximum 26.44% Q2 2003) could lead to difficulties in lending and changes in
lending practices in each quarter. Thus it is important to note the SELIC rate as it can better
show the financial situation facing banks in each quarter. However, it is important to note that
the SELIC rate is only for interbank practices and do not reflect as well the actual loan rates
passed on to the banking institutions corporate and private customers, this is further discussed
below and shown in Chart 2.4.
An additional financial note is that the threat of a return to high inflationary times has led to a
significant level of financial indexation in Brazil. This is seen in the high degree of deposits
linked to the SELIC overnight rate or a price index (Robitaille 2011 ).
However, the SELIC rate does not give the full picture on the interest rates faced by Brazilian
companies and individuals. Brazil has a history of high (by international standards) bank
spreads. Teixeira and Mollo (2006) note the combination of a history of high inflation, a
concentrated banking market, and the attractiveness of secure return government debt have
led banks to depend less on consumer credit for income. The main factor being the
thus firms have been tempted away from medium and long term investments for the safer
government option.
Therefore in order to maintain a return equal or better than the government rates the spreads
have been kept artificially high. For example in 2002/2003 the average spread for firms was
14-15% while personal or private loan spreads were as high as 50%. This is well above the
spreads found in developed nations at the time, approximately 5%. The reasoning behind this
difference is that the government needed to attract foreign investment and capital and help
guard against future exchange rate shocks and inflation (Teixeira and Mollo 2006).
Of note is that at the beginning of the study the percent of credit given to the private sector in
terms of GOP was a mere 25% which was lower than that of their South American neighbors
or the Asia Tiger economies of the period. Fortunately by 2007 the increase in private credit
led to a 35% ratio to GDP for Brazil, however this was still below the norm for comparable
economies (Robitaille 2011).
It is important to add that long term private credit is generally difficult to obtain in Brazil
with the BNDES being the main supplier of private long term credit. The majority of
financial instruments used by the private sector are connected with short-term rates such as
the SELIC or price index while debts of maturities of over five years are rather rare
(Robitaille 2011 ).
However, the high by international standard loan spreads in Brazil have been declining over
payroll and vehicle loans which gave banks more lending options to private clients
(Robitaille 2011 ).
This decrease was insignificant in comparison to the spreads found in comparable Latin
American banking sectors. Chart 2.3 shows the average lending spreads for banking clients in
Brazil, Mexico, Argentina and Chile. The fact that Brazilian spreads on average are eight
times that of their Latin American counterparts shows that there is room for lowering of the
effective interest rate charged to non-bank borrowers. Additionally, the high spreads may be
hampering the development in non-banking industries that use bank credit in order to develop
their businesses. An analysis on this area is beyond the scope of this research.
Chart 2.3 Comparison Bank Interest Rate Spreads for Average Lending
Rates for Brazil, Mexico, Argentina and Chile 2002-2009
50
45
40
35
30
25
20
15
10
5
0
-"""
...-
"--~
-
~-2002 2003 2004 2005 2006 2007 2008 2009
-Brazil -Mexico -Argentina -Chile
Source: The World Bank and International Monetary Fund International Statistics 2011.
If one looks at only the December 2009- June 2011 period in Chart 2.4 the differences
apparent. Though the SELIC Overnight rate has hovered around 10% for the 18 month period
and the long term rate stayed at 6% the actual rates facing businesses ranged from 25% to
over 30% while individuals faced interest rates ranging from 40% to 47%. These wide
differences in lending rates showcase the need for further developments of credit options
within the Brazilian economy in order to promote growth and reduce the debt burden on
businesses and individuals.
Chart 2.4 SELIC Overnight Rate, Official Long Term Interest Rate,
General Lending Rate, Corporate Lending Rate, and Individual Interest
Rate in effect in Brazil from December 2009 to June 2011
50.00%
-
.r--
--~
-45.00%
40.00%
35.00%
__,
-
...,..
-SELIC30.00%
25.00% -Long Term Interest Rate
20.00% -General Lending Rate
15.00% -corporate Lending Rate
10.00% -Individuals Lending Rate
5.00%
Source: The World Bank and International Monetary Fund International Statistics 2011.
Additionally, in Brazil the corporate bond market is relatively underdeveloped and reinforces