Carlos Pestana Barros & Nicolas Peypoch
A Comparative Analysis of Productivity Change in Italian and Portuguese Airports
WP 006/2007/DE _________________________________________________________
Carlos Farinha & Isabel Andrade
Robin Hood versus Piggy Bank: Income
redistribution in Portugal 2006-10
WP 28/2013/DE/CEMAPRE _________________________________________________________
Department of Economics
W
ORKINGP
APERSISSN Nº 0874-4548
School of Economics & Management
Robin Hood versus Piggy Bank: Income
redistribution in Portugal 2006-10
Carlos Farinha Rodrigues
*Isabel Andrade
Summary: The redistributive effect of the Portuguese welfare state through pensions, benefits and taxes is investigated in detail over the 2006-10 period using disposable income as benchmark. All social and fiscal policy instruments analysed contribute significantly to the reduction in inequality and poverty, with benefits other than pensions being the most cost-efficient. However, the impact of the economic crisis and austerity policies implemented from 2010 has reversed the previous trends and affected negatively the efficacy and efficiency of all instruments.
Key words: income inequality, redistribution, tax and expenditure policy, Portugal.
JEL: C81, D31, H22, H55.
(*) Instituto Superior de Economia e Gestão / Universidade de Lisboa CEMAPRE – Centre for Applied Mathematics and Economics Rua do Quelhas 6, 1200-781 Lisboa, Portugal.
2
1. Introduction1
Portugal is a member of Esping-Andersen´s Continental-European group
of countries typified by “transfer-heavy and service-lean” welfare states. It is also one of the most unequal (and poorest) of the EU countries. The aim of this paper is to analyse the redistributive character of the Portuguese welfare state over the 2006-10 period, a complex and difficult time, and the most recent period for which data is available.
Income inequality in Portugal is one of the highest in the EU. As Rodrigues and Andrade (forthcoming) discuss, it increased in the early nineties and then remained relatively unchanged until the mid-noughties, when the successful implementation of social policies aimed at decreasing poverty together with the continuing expansion of the welfare state achieved a reduction in inequality (and poverty). Rodrigues et al. (2012) show the Gini coefficient fell from 0.381 in 2004 to 0.337 in 2009. However, the deep financial crisis, economic austerity and Troika agreement led to a new turning point and rise in the Gini to 0.342 in 2010. The reduction in inequality in 2006-09 is mainly explained by the stronger growth in the income share of the lower incomes: the 1st decile share grew at an annual rate of 2.6% compared to the 0.4% average. Figure 1 shows that the share of the two lowest deciles (and 5th) rose virtually consistently until 2009, but then either remained unchanged or fell, while the inverse occurred with the share of the two highest.
1
3
Figure 1: Income deciles shares 2006-10 (2006=100)
Source: INE-Statistics Portugal, EU-SILC 2007-2011.Authors’ calculations.
Simultaneously, public social expenditure has grown from 9.7% of GDP in 2000 to 12.7% in 2007 and 18% in 2010, as shown in Rodrigues and Andrade (2013). Its two highest components are ‘old age’ (mainly
pensions) and ‘health’ expenditures, reflecting the rapid ageing of the population. Rising tax rates have led to tax revenues exceeding 30% of GDP.
This paper discusses the effects of three redistributive instruments, pensions, benefits and taxes, and how efficient they have ultimately been in reducing inequality and poverty in Portugal. It takes a different approach from the multi-country/one year analysis in, for example, Čok et al. (2013), Förster and Whiteford (2009), Fuest et al. (2009), Immervoll and Richardson (2011), Kenworthy and Pontusson (2005), and Marx and van Rie (forthcoming), and it complements the analysis of the Portuguese tax-benefit system in Gouveia (2011) and Alves (2012). It is organised as follows: section 2 discusses briefly how social programs and taxes affect income distribution; section 3 introduces and applies the income accounting framework to Portuguese disposable income; section 4 analyses the redistributive effect of the above three instruments; section 5
85 90 95 100 105 110 115
2006 2007 2008 2009 2010
D
e
ci
le
In
co
m
e
S
h
ar
e
s (2006=
100)
4 studies redistribution towards the lowest quintile; and section 6 concludes the paper.
2. How social programs and taxes affect income distribution
Förster and Whiteford (2009) stress that the analysis of the impact any welfare system has on income redistribution and inequality reduction needs to take into account its design features, particularly how the system is financed and what relationship exists, if any, between income, contributions and entitlement. Targeting and progressivity are essential parts of its design and influence the resulting redistribution effects on household income. Werding (2003) identifies two main types of welfare systems: Beveridgean and Bismarckian, where the former is funded by general taxation and built on universal flat rate provision based on residence and need criteria, whereas the latter presumes a relationship between contributions and entitlement and therefore is funded (at least partially) by social security contributions.
5 Finally, the redistribution effect cannot be reduced to taxes and benefits, as Immervoll and Richardson (2011) argue, but should also include the provision/usage of public services (non-cash benefits), and recognise their direct influence on households’ work and savings decisions. Marical et al.
(2006) estimate their redistributive effect, and conclude that Portuguese public spending in health reduces the Gini by 14.3%, in education by 11.4%, both well above the Continental-European group countries average, and in other public services (social housing and social care for the elderly and the very young) by 2.9%.
3. Income inequality and redistribution in Portugal, 2006-10
Ideally the redistributive effects of the welfare state would be evaluated
against a ‘pure’ pre-welfare state benchmark, or counterfactual, as discussed in Esping-Andersen and Myles (2009). As that is manifestly impracticable, a version of the OECD (2008) “income accounting
6
Figure 2: Modified Income Accounting Framework
Income Components
Wage and salaries
+ Self-employment income
+ Property Income
+ Other private incomes
1. Market Income
+ Pensions
2. Market Income + Pensions
+ Other Social Security Benefits
3. Gross Income
- Employee Social Security Contributions
4. Gross Income - SSC
- Income Taxes
5. Household Disposable Income Source: Adapted from OECD (2008).
Market income includes wages and salaries, plus self-employment, property, and other private incomes. It is the closest approximation to an economy with no explicit state intervention, but excluding all other incomes leads to a large number of individuals and households having zero (market) income. MarketP (Market + Pensions) income adds (gross) old-age pensions and survivors related benefits. It also includes the
non-contributory social pension and “regular inter-household cash transfers” (mostly alimony payments). Gross income is defined as MarketP income plus social security cash benefits: unemployment, housing, sickness,
7 Direct taxes are income tax (IRS) and a municipal tax on the market value
of the household’s home (IMI). The EU-SILC database has no information on indirect taxes paid by the households, such as VAT. Pensions and benefits affect different age cohorts, and reveal different aspects of the welfare state and its redistributive role. Pensions fulfil a major part of its piggy bank role, representing 45% of the social security budget in 2010. Cash benefits include both piggy bank benefits, such as unemployment, sickness, and maternity benefits, and Robin Hood benefits, such as the means-tested child, CSI, and RSI benefits.
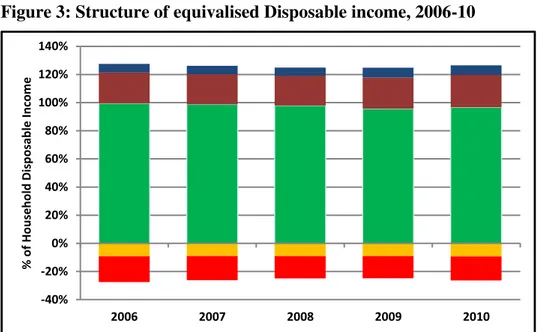
The structure of Disposable income, the benchmark income as discussed below, is given in Figure 3 and shows no substantial variation over the period. The average tax rate was about 14% throughout, corresponding to about 17% of the equivalised disposable income. Adding SSC raises these values to 21% and 26%, respectively.
Figure 3: Structure of equivalised Disposable income, 2006-10
Source: INE-Statistics Portugal, EU-SILC 2007-2011.Authors’ calculations.
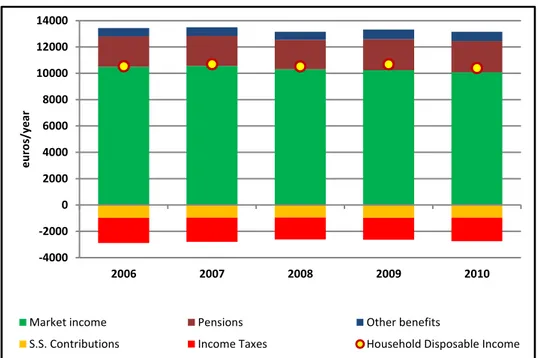
The drop in Market income in 2009-10 and in Disposable income (denoted by the yellow ball) in 2010 becomes clearer in Figure 4. The real
-40% -20% 0% 20% 40% 60% 80% 100% 120% 140%
2006 2007 2008 2009 2010
%
o
f H
o
u
seh
o
ld
D
isp
o
sab
le
In
co
m
e
8 increase in transfers in 2009 due to the action of the automatic stabilisers at the start of the economic crisis (but before the deep cuts in welfare) was enough to prevent a drop in Disposable income then, but in 2010, it was at its lowest level since 2006.
Figure 4: Equivalised Disposable income, 2006-10 (in €/year, 2010 prices)
Source: INE-Statistics Portugal, EU-SILC 2007-2011.Authors’ calculations.
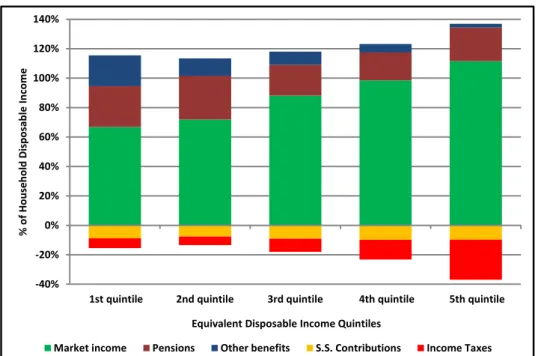
A more detailed analysis of Disposable income and its structure by income quintiles is undertaken for 2010, the latest EU-SILC data available, but also the year when the effects of the austerity policies become apparent. Figure 5 shows the different income structure across the quintiles, reflecting both strong household inequality levels and the redistributive character of taxes and benefits. Pensions and benefits represent almost half of the Disposable income of the 1st quintile and just above 40% of that of the 2nd, whereas they represent between 30% and 25% of the highest three. Conversely, SSC and taxes represent less than 20% of the income of the three lowest quintiles, but 37% of the 5th. Hence, Market income is lower than Disposable income in the first three quintiles, virtually equals that of the 4th and exceeds it by just over 10% in the 5th.
-4000 -2000 0 2000 4000 6000 8000 10000 12000 14000
2006 2007 2008 2009 2010
e
u
ro
s/year
Market income Pensions Other benefits
9 Nonetheless, the 1st quintile is not dominated by pensioners, as might be expected: it is the 2nd quintile that has the highest proportion of pensions in Disposable income, 29.74%, and proportion of the total number of pensioners, 25.2%. It is followed closely by the 1st and 5th with 27.7% and 23.0% of total pensions, respectively, and each about 19% of pensioners. The Bismarckian pension system plus an explicit policy aim to decrease old age poverty explains this structure built on an elderly poverty rate below the national rate in 2010 (Rodrigues and Andrade, 2013).
Figure 5: Structure of Equivalised Disposable income by quintiles 2010
Source: INE-Statistics Portugal, EU-SILC 2011.Authors’ calculations.
As expected, benefits are clearly pro-poor: their proportion in Disposable income falls consistently from the 1st quintile (21.0%) to the 5th (2.5%), but almost halves between the 1st and 2nd (11.8%). Thus, households that depend on benefits are highly concentrated in the 1st quintile. The progressive character of the tax system is also clear: taxes represent 13.4% of the 4th quintile income, but 27.2% of the 5th. However, they are actually higher in the 1st than the 2nd (6.8% versus 5.7%) suggesting a certain regressive character at the lower end of the distribution when
-40% -20% 0% 20% 40% 60% 80% 100% 120% 140%
1st quintile 2nd quintile 3rd quintile 4th quintile 5th quintile
%
o
f H
o
u
seh
o
ld
D
isp
o
sab
le
In
co
m
e
Equivalent Disposable Income Quintiles
10 ranked by Disposable income. The compulsory fixed rate SSC stay rather even (8% to 10%) across the distribution.
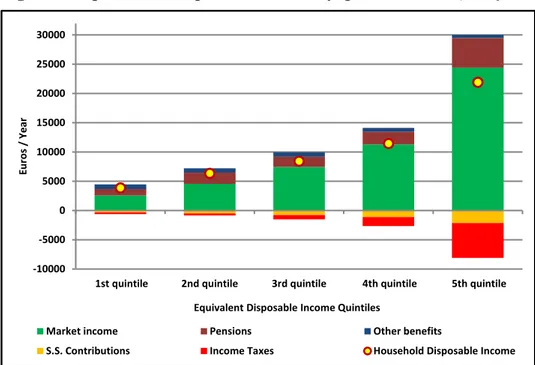
Disposable income (denoted by the yellow ball) inequality is more evident in Figure 6: the 5th quintile average is more than 5.5 times that of the 1st, and still almost twice that of the 4th. It is also higher than MarketP income in the 1st (1.5 times), 2nd (1.4), and 3rd (1.1) quintiles, virtually equal in the 4th and clearly lower in the 5th (0.9).
Figure 6: Equivalised Disposable income by quintiles, 2010 (in €/year)
Source: INE-Statistics Portugal, EU-SILC 2011.Authors’ calculations.
4. The redistributive effect of pensions, benefits, and taxes; efficiency and efficacy
The analysis of the redistributive effect (RE) of the three types of instruments follows the widely used methodology based on Kakwani’s decomposition and discussed in Verbist (2004) and Urban (2009). It compares measures of inequality calculated at the different stages of the income accounting framework using the different incomes analysed in the previous section.
-10000 -5000 0 5000 10000 15000 20000 25000 30000
1st quintile 2nd quintile 3rd quintile 4th quintile 5th quintile
E
u
ro
s /
Year
Equivalent Disposable Income Quintiles
Market income Pensions Other benefits
11 A crucial part of the discussion of the RE of social policy measures has to be that of its efficacy and cost-efficiency. It is not enough that the welfare state lessens inequality, as already demonstrated. It has to be seen to be doing it in an efficient way, particularly in times of crisis and budget cuts. Yet, as Förster and Whiteford (2009) discuss, the actual design of the welfare state policies influences the results: “for a given amount of spending, benefits paid to those with fewer economic resources will be greater under a means-tested system than under a universal benefit system, which in turn will provide more generous payments than an earnings-related system.” (page 35). As referred above, the Portuguese system relies on all three: most pensions are contributions-related (therefore earnings-related), some benefits are means-tested and others are universal.
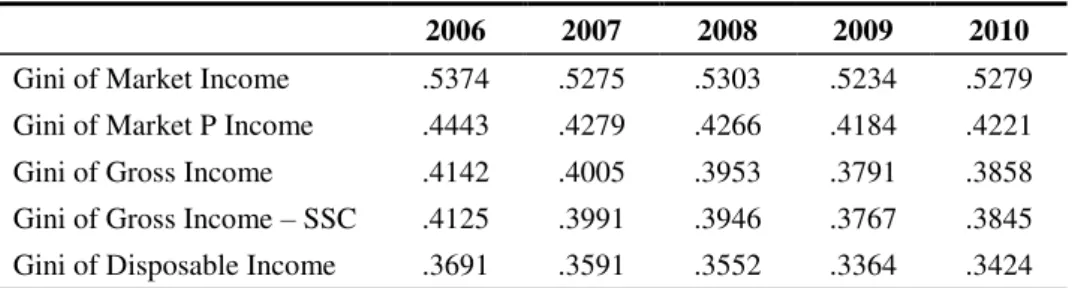
The RE of a social policy instrument is defined as the difference in a measure of inequality (the Gini in Table 1) calculated pre and post-instrument income.
Table 1: Gini coefficients, 2006-10
2006 2007 2008 2009 2010
Gini of Market Income .5374 .5275 .5303 .5234 .5279 Gini of Market P Income .4443 .4279 .4266 .4184 .4221 Gini of Gross Income .4142 .4005 .3953 .3791 .3858 Gini of Gross Income – SSC .4125 .3991 .3946 .3767 .3845 Gini of Disposable Income .3691 .3591 .3552 .3364 .3424
Source: INE-Statistics Portugal, EU-SILC 2007-2011.Authors’ calculations.
During the 2006-09 period practically all Gini decreased, but this trend was reversed in 2010. The instrument that has the highest impact on the
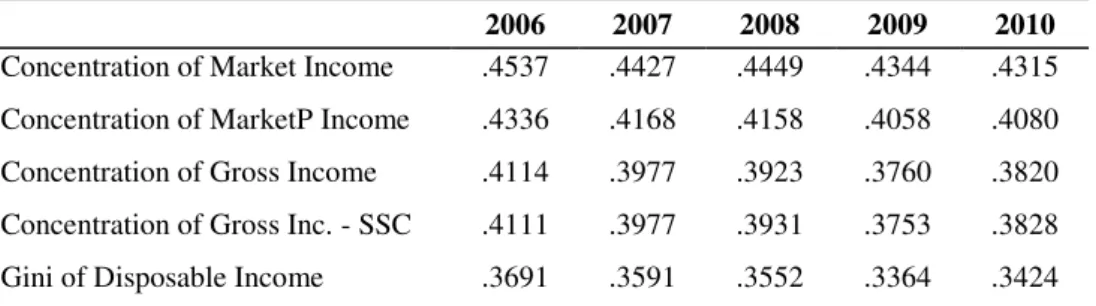
12 making the analysis benchmarked on that concept. Like in Försters and Whiteford (2009) and OECD (2012), the benchmark income concept chosen here is Disposable income. Compared to the other accounting framework income concepts, it is the more sensible option, as it is the income households have to spend. Therefore, in Table 2 it is the Concentration coefficient (CC) of all incomes ranked by Disposable income that is reported. The CC is calculated like the Gini except that all equivalised incomes are ranked by Disposable income instead of each specific one. Conversely, the only Gini is that of the benchmark Disposable income.
Comparing Table 2 with Table 1, it is immediately apparent that using Disposable income ranking leads to a reduction in each CC value compared to its Gini counterpart. For example, in 2006 the Market income Gini is 0.5374 and its CC is 0.4537. This apparent substantial drop in inequality is solely due to the different rankings used, not to any change in inequality itself.
Table 2: Income Concentration Coefficients and Gini, 2006-10
2006 2007 2008 2009 2010
Concentration of Market Income .4537 .4427 .4449 .4344 .4315 Concentration of MarketP Income .4336 .4168 .4158 .4058 .4080
Concentration of Gross Income .4114 .3977 .3923 .3760 .3820 Concentration of Gross Inc. - SSC .4111 .3977 .3931 .3753 .3828 Gini of Disposable Income .3691 .3591 .3552 .3364 .3424
Source: INE-Statistics Portugal, EU-SILC 2007-2011.Authors’ calculations.
13
Figure 7: Income Concentration Coefficients and Disposable Income Gini, 2006-10
Source: INE-Statistics Portugal, EU-SILC 2007-2011.Authors’ calculations.
The efficacy of an instrument is defined as the difference between the Gini (or CC counterpart) before and after the introduction of that instrument, i.e., it is measured by its RE. Efficiency is defined as efficacy/size*100, where size is the average (instrument) amount received/paid by beneficiary/contributor. Thus, this concept of efficiency
coincides with the absolute value of Kakwani’s progressivity index,
which is calculated as the difference between the CC of the instrument itself and the CC (or Gini) of the pre-instrument income.
While efficacy asks whether an instrument works or not in reducing inequality, its cost-efficiency measures how well it works, and therefore is inversely proportional to how much it costs. The higher its value the more pro-poor the system is, as the poorer receive a higher share of benefits than their share of pre-benefits income (both ranked by Disposable income).
0,30 0,32 0,34 0,36 0,38 0,40 0,42 0,44 0,46 0,48 0,50
2006 2007 2008 2009 2010
Market Income Market Income + Pensions
14
Table 3: Efficacy and Efficiency of benefits and taxes, 2006-10
2006 2007 2008 2009 2010
Efficacy of Pensions 0.020 0.026 0.029 0.029 0.024 Size of Pensions 0.181 0.179 0.179 0.188 0.192
Efficiency of Pensions 0.112 0.145 0.163 0.152 0.123
Efficacy of Other Social Benefits 0.022 0.019 0.024 0.030 0.026 Size of Other Social Benefits 0.048 0.048 0.046 0.055 0.054 Efficiency of Other S. Benefits 0.466 0.400 0.513 0.542 0.484
Efficacy of Taxes 0.042 0.039 0.038 0.039 0.040 Size of Taxes 0.182 0.172 0.158 0.156 0.171 Efficiency of Taxes 0.230 0.224 0.240 0.249 0.237
Source: INE-Statistics Portugal, EU-SILC 2007-2011.Authors’ calculations.
The efficacy of pensions and benefits is comparable in Table 3, rising between 2007 and 2009 and falling in 2010, but taxes have the highest (mostly unchanged) efficacy by far. Benefits are clearly the most cost-efficient instrument, with pensions the least one. The cost-efficiency of all instruments rose up to 2009 and fell noticeably in 2010. SSC are not included because their effect on inequality is close to zero.
15 is hampered by serious limitations: Rodrigues et al. (2012) estimate that only 75% of the Portuguese households pay taxes.
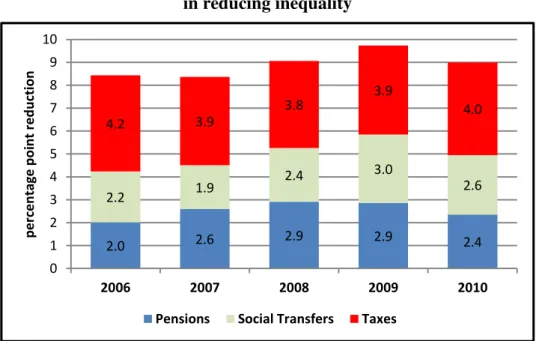
Figure 8 summarises the effects of all three instruments in reducing inequality measured by the Disposable income Gini. Taxes are consistently the highest contributor, while pensions and benefits alternate in 2nd place, but the impact of all three fell in 2010.
Figure 8: Summary of the effects of pensions, benefits, and taxes in reducing inequality
Source: INE-Statistics Portugal, EU-SILC 2007-2011.Authors’ calculations.
5. Redistribution towards the lowest quintile
A distinct way of analysing redistribution, and particularly targeting, is through the monitoring of net public transfers to each quintile of the Disposable income distribution, as reported in Table 4 for 2010. As public transfers include pensions, the 5th quintile share is about twice that of the 4th and thrice that of the 1st, with the share of the 2nd also high. The share of taxes is much more unequal: the 5th quintile pays almost 60% of the total, nearly six times what the 1st and 2nd pay together. The column of net transfers reveals that all but the 5th quintile receive more than they pay, in close to decreasing order. The exception/reversal is between the 1st and
2.0 2.6 2.9 2.9 2.4
2.2 1.9 2.4 3.0 2.6 4.2 3.9 3.8 3.9 4.0 0 1 2 3 4 5 6 7 8 9 10
2006 2007 2008 2009 2010
p e rc e n tage p o in t re d u ction
16 2nd quintiles due to already discussed concentration of pensioners in the latter.
Table 4: Net transfers to quintiles, 2010
1st quintile
2nd quintile
3rd quintile
4rd quintile
5th quintile Share of public transfers paid to 12.2 17.1 16.3 18.3 36.2 (Share of pensions paid to) (9.0) (15.8) (14.8) (18.2) (42.2) Transfers to 3.6 5.1 4.8 5.4 10.8
Share of taxes paid by 4.4 6.2 11.1 19.3 59.1 Taxes from 1.2 1.6 2.9 5.1 15.6 Net transfers to 2.5 3.4 1.9 0.3 -4.8
Source: INE-Statistics Portugal, EU-SILC 2011.Authors’ calculations.
Notes: The share of each quintile (rows 1, 2, and 4) is calculated as a % of
total transfers/taxes (each row adds to 100). Rows 3, 4 and 5 are calculated as % of the total equivalised Disposable income.
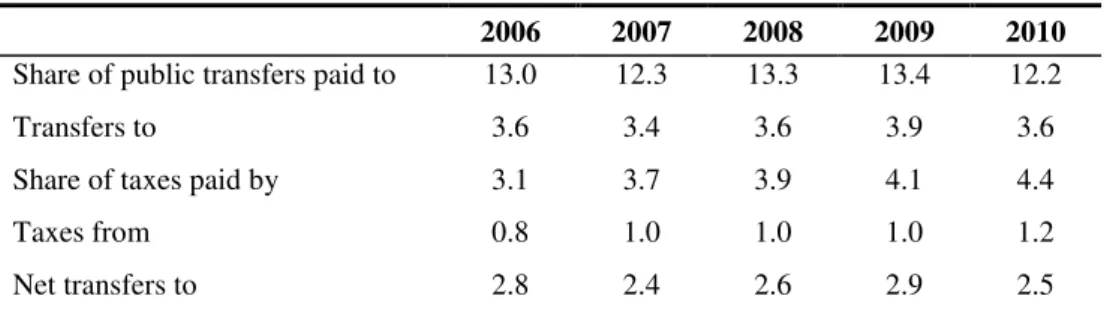
Table 5 shows that net transfers to the 1st quintile have remained relatively unchanged throughout the period, with peaks in 2006 and 2009 and a drop in 2010. Most significant is the steady increase in taxes paid by the lowest quintile.
Table 5: Net transfers to 1st quintile, 2006-10
2006 2007 2008 2009 2010
Share of public transfers paid to 13.0 12.3 13.3 13.4 12.2 Transfers to 3.6 3.4 3.6 3.9 3.6
Share of taxes paid by 3.1 3.7 3.9 4.1 4.4 Taxes from 0.8 1.0 1.0 1.0 1.2 Net transfers to 2.8 2.4 2.6 2.9 2.5
Source: INE-Statistics Portugal, EU-SILC 2007-2011.Authors’ calculations.
Notes: As for Table 4.
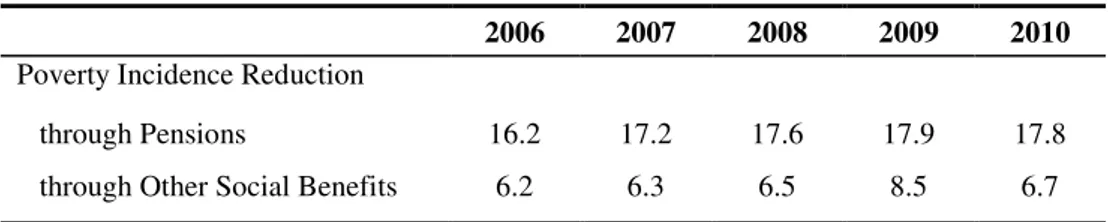
17 For the same poverty line (60% of the median of the equivalised Disposable income) it is possible to calculate what the poverty rate would be if pensions and benefits (net of taxes) did not exist. Table 6 reports the difference between this value and the ‘official’ poverty rate in this period.
Table 6: Poverty Rate Reduction through cash transfers (in p.p.)
2006 2007 2008 2009 2010
Poverty Incidence Reduction
through Pensions 16.2 17.2 17.6 17.9 17.8
through Other Social Benefits 6.2 6.3 6.5 8.5 6.7
Source: INE-Statistics Portugal, EU-SILC 2007-2011.Authors’ calculations.
Pensions contribute much more than benefits, apt in a country with an old-age dependency ratio above 28% and their effect carried into 2010 unchanged. However, the crisis is evident: in 2009 the action of the benefits automatic stabilisers helped households that were experiencing financial difficulties, but as budget cuts were imposed and benefits cut in 2010, their action was curtailed and their role in reducing poverty was reduced itself.
7. Conclusion
This paper shows that the decrease in inequality in Portugal in 2006-09 was achieved by an increase in social transfers, but foremost by their improved RE. Furthermore, the piggy bank function of the welfare system dominated its Robin Hood role, although the RE of the latter had lower efficacy and cost-efficiency throughout the period.
18 fell slightly in 2006-09, which implied both a small drop in the efficacy of taxes and a small rise in their efficiency.
The results for 2010 reveal the 1st effects of the austerity policies: a fall in the efficiency of all redistributive instruments, less efficacy of social transfers, a reversal in the previous trends of inequality and poverty reduction, whilst the policy measures implemented in 2012-13 point to their accentuation. An effective reform of the redistributive role of the state that will enable a reduction in inequality, poverty and social exclusion even in a time of economic crisis has to incorporate an increase in the efficacy and cost-efficiency of its redistributive instruments. A widening of the fiscal base and progressivity of the fiscal system, and increasingly means-tested social benefits with more rigorous assessment and entitlement of recipients, i.e., the intensification of the Robin Hood role of the welfare state, has to be an integral part of its successful reform.
References
Alves, Nuno. 2012. “A view on income redistribution in Portugal and in
the EU.”Banco de Portugal Economic Bulletin, Winter: 41-58.
Atkinson, Anthony B. 1980. “Horizontal equity and the distribution of the tax burden.” In The Economics of Taxation, eds. Henry J. Aaron and Michael J. Boskins, 3-18. Washington D.C.: Brookings Institution Press.
Attia, Nicole, and Valérie Bérenger. 2009. “European integration and
social convergence: A qualitative appraisal.” Panoeconomicus, (56)1: 3-19.
Čok, Mitja, Ivica Urban, and Miroslav Verbič. 2013. “Income
redistribution through taxes and benefits: The case of Slovenia and
Croatia.” Panoeconomicus, (60)5: 667-686.
Esping-Andersen, Gøsta and John Myles. 2009. “The welfare state and
redistribution.” In The Oxford Handbook of Economic Inequality, eds. Wiemer Salverda, Brian Nolan, and Timothy T. Smeeding, 639-664. Oxford: OUP.
Förster, Michael and Peter Whiteford. 2009. “How much redistribution
19
Fuest, Clemens, Judith Niehues, and Andreas Peichl. 2009. “The
redistributive effects of tax benefits systems in the enlarged EU.” IZA DP No.4520.
Gouveia, Miguel. 2011. “A eficiência das políticas contra a pobreza em
Portugal.”Revista Brotéria, 173(6): 439-452.
Immervoll, Herwig and Linda Richardson. 2011. “Redistribution
policy and inequality reduction in OECD countries: What has changed in
two decades?” OECD Social, Employment and Migration Working Papers No.122.
Immervoll, Herwig, Horacio Levi, Christine Lietz, Daniela Mantovani, Cathal O’Donoghue, Holly Sutherland, and Gerlinde
Verbist. 2005. “Household incomes and redistribution in the EU:
Quantifying the equalising properties of taxes and benefits.” IZA DP No.1824.
Josifidis, Kosta, John Hall, Novica Supić, and Olgica Ivančev. 2011.
“European welfare regimes: Political orientation versus poverty.” Panoeconomicus, (58)5: 651-674.
Kenworthy, Lane and Jonas Pontusson. 2005. “Rising inequality and
the politics of redistribution in affluent countries.” Perspectives on Politics, 3(3): 449-71.
Marical, François, Marco Mira d’Ercole, Maria Vaalavuo, and
Gerlinde Verbist. 2006. “Publicly-provided services and the distribution of resources.” OECD Social, Employment and Migration Working Papers No.45.
Marx, Ive, Lina Salanauskaite, and Gerlinde Verbist. 2013. “The
paradox of redistribution revisited: And that it may rest in peace?” IZA DP No.7414.
Marx, Ive and Tim van Rie. Forthcoming. “The policy response to inequality: Redistributing income.” In Changing Inequalities in Rich Countries: Analytical and Comparative Perspectives, eds. Wiemer Salverda, Brian Nolan, Daniele Checchi, Ive Marx, Abigail McKnight, István György Tóth and Herman G. van de Werfhorst. Oxford: OUP.
OECD. 2008. Growing unequal? Income Distribution and Poverty. Paris:
OECD.
20
Rodrigues, Carlos F. 2009. “Efficacy of Anti-poverty and Welfare Programs in Portugal: The Joint Impact of the CSI and RSI.” ISEG Economics Department WP 42/2009.
Rodrigues, Carlos F. and Isabel Andrade. 2013. “Growing Inequalities
and their Impacts – Country Report for Portugal.” http://www.gini-research.org/.
Rodrigues, Carlos F. and Isabel Andrade. Forthcoming. “Portugal:
There and back again, an inequality’s tale.” In Changing Inequalities and Societal Impacts in Rich Countries: Thirty Countries' Experiences, eds. Brian Nolan, Wiemer Salverda, Daniele Checchi, Ive Marx, Abigail McKnight, István György Tóth and Herman G. van de Werfhorst. Oxford: OUP.
Rodrigues, Carlos F., Rita Figueiras, and Vítor Junqueira. 2012.
Desigualdades Económicas em Portugal. Lisboa: FFMS.
Rodrigues, Carlos F. and Vítor Junqueira. 2012. “EUROMOD
Country Report - Portugal (2007-2010).” Euromod.
Urban, Ivica. 2009. “Kakwani decomposition of redistributive effect: Origins, critics and upgrades.” ECINEQ WP 2009-148.
Verbist, Gerlinde. 2004. "Redistributive effect and progressivity of taxes: an international comparison across the EU using EUROMOD." Euromod WP EM5/04.
Werding, Martin. 2003. “After another decade of reform: Do pension